How Long Does Record/Replay Take?
Record/replay overhead is a function of the number of memory accesses and the amount of sharing in the test program.
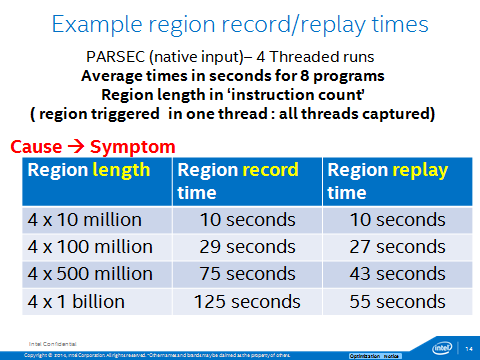
Time for Recording/Replaying a Region
Source: CGO2014 paper on DrDebug
Slow Down for Whole-Program Recording
Source: Measured with PinPlay kit v2.0. (We are continuously looking to improve these kits.)
| Average Slowdown x Native |
|||
|---|---|---|---|
| Benchmark/Input |
How It Was Recorded/Replayed (pin -t pinplay-driver.so ...) |
Logger | Replayer |
| SPEC2006/'ref' |
-log:mt 0 / -replay:addr_trans 0 |
98x | 11x |
| PARSEC/'native' >=4T |
-log:mt 1 / -replay:addr_trans 0 |
197x | 37x |
Why Does PinPlay Have a High Overhead (Especially for Recording)?
The design goals of PinPlay were:
- No special hardware requirement (including no reliance on hardware performance counters).
- No special operating system requirement (including no virtual machine nor modified kernel).
- Complete and faithful reproduction of multithreaded schedules.
- Portability (small size, operating system independence) of a recording ("pinball").
- No program source is needed. No recompilation nor relinking is required.
As a result, PinPlay works on multiple operating systems out of the box and guarantees that a bug, once captured, will not escape. However, that comes with a high overhead, especially during recording.
There are two major sources of slowdown in PinPlay (we are continuously looking to improve these issues).
System Call Side-Effect Analysis
A shadow memory is implemented during recording. All real memory writes observed in the program are replicated on the shadow memory. Memory reads lead to a comparison of real memory values and shadow memory values and mismatch or missing value leads to an injection being emitted in the *.sel file. At replay time, all memory reads are monitored and recorded memory values are injected if present. The details are described in our SIGMETRICS 2006 paper, "Automatic Logging of Operating System Effects to Guide Application-Level Architecture Simulation."
The overhead of this technique is proportional to the number of memory accesses in the program.
Shared Memory Access Order Analysis
During recording, all memory accesses are monitored and a cache coherency protocol is simulated, including maintenance of the last reader or writer for each shared memory access. A subset of detected read-after-write, write-after-read, and write-after-write dependences is recorded in the *.race file. During replay, all memory accesses are monitored and a thread is delayed if it tries to access a shared memory location out of order.
The overhead of this technique is proportional to the number of shared memory accesses in the program.