A quick getting started guide to use Intel® VTune™ Profiler GUI profiling DPC++ sample codes on Intel® oneAPI Toolkits Container
This tutorial guides users on using the Intel® oneAPI Base Toolkit container image on a Linux* system to enable using Intel VTune Profiler to profile a DPC++ program. Intel VTune Profiler is a component in the Intel® oneAPI Base Toolkit, which is a required toolkit for other domain-specific toolkits like the oneAPI HPC toolkit. This guide includes detailed steps and tips on using Intel VTune Profiler not covered by current online documentation.
Install Docker*, download and run Intel® oneAPI Base Toolkit Docker image
We use Ubuntu* as an example to show the detailed steps.
Step 1. Install the Docker and some housekeeping commands (run them in root privilege)
#update the software repository
apt-get update

#Uninstall the previous docker version
apt-get remove docker docker-engine docker.io

#Install Docker
apt install docker.io

#start docker as a service
systemctl start docker

#enable docker service
systemctl enable docker
Step 2. Download and run the Intel oneAPI IoT Toolkit Docker image
#download oneAPI Base Toolkit's docker image. dockerHub also provides other oneAPI toolkit docker image as well.
#note: The Docker image is ~5 GB and can take ~15 minutes to download. It will require 25 GB of disk space
image=intel/oneapi-basekit
docker pull "$image"

#add local connection access to X server
xhost local:root

#Run oneAPI Base Toolkit docker image (warning notes : this command is INSECURE to the host if you consider to expose this docker environment to other end users)
docker run --cap-add=SYS_ADMIN --cap-add=SYS_PTRACE --net=host -e DISPLAY --device=/dev/dri -it "$image"
Compile DPC++ sample codes as a profiling workload
Step 3. Download oneAPI DPC++ sample codes
#Run oneapi-cli to get DPC++ sample codes
/opt/intel/oneapi/dev-utilities/latest/bin/oneapi-cli
Step 4. Choose "create a project -> cpp -> Toolkit -> Intel® oneAPI DPC++ -> C++ compiler -> CPU, GPU, FPGA -> Vector Add"
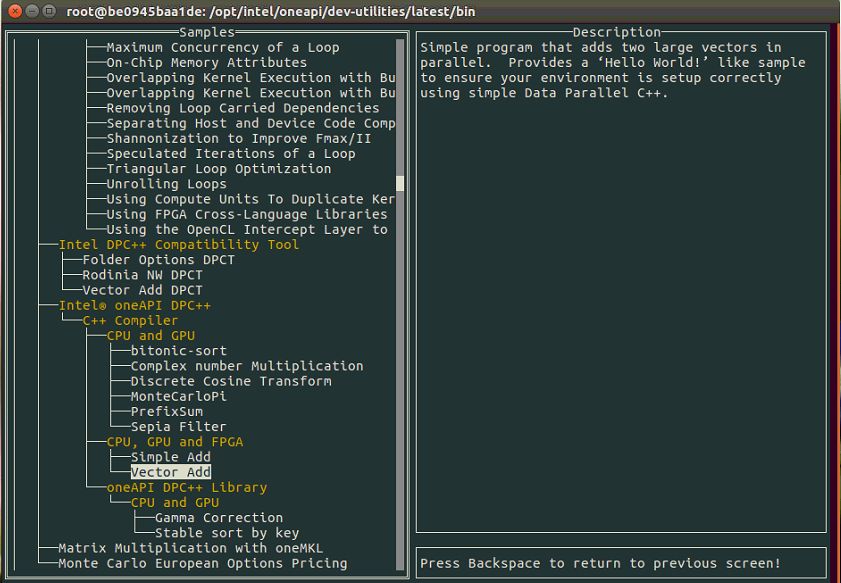
Step 5. Enter "vector-add" sample codes folder which is just created
#compile the vector-add DPC++ code
root@be0945baa1de:/opt/intel/oneapi/dev-utilities/latest/bin/vector-add> make
. The console output is shown below if vector-add sample is successfully compiled and excuted.
root@be0945baa1de:/opt/intel/oneapi/dev-utilities/latest/bin/vector-add# ./vector-add-buffers
Running on device: Intel(R) Gen9
Vector size: 10000
[0]: 0 + 0 = 0
[1]: 1 + 1 = 2
[2]: 2 + 2 = 4
...
[9999]: 9999 + 9999 = 19998
Vector add successfully completed on device.
Launch Intel® VTune Profiler GUI to directly profile DPC++ GPU workload
Step 6. Run Intel VTune Profiler GUI directly
#Launch VTune Profiler's Graphical User Interface
vtune-gui
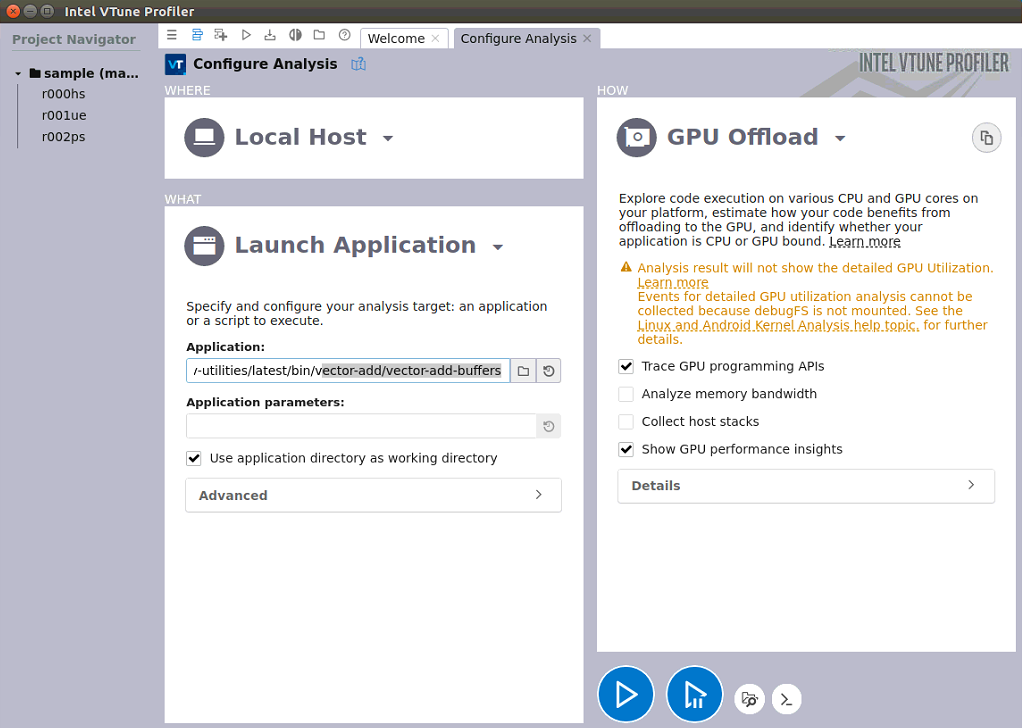
Configure GPU offload analysis and uncheck memory bandwidth. (This requires the host's debugFS to be mounted in the Docker image. Please note this is also an insecure option to the host if considering to expose docker to end-users. We may provide the updates in this article later)
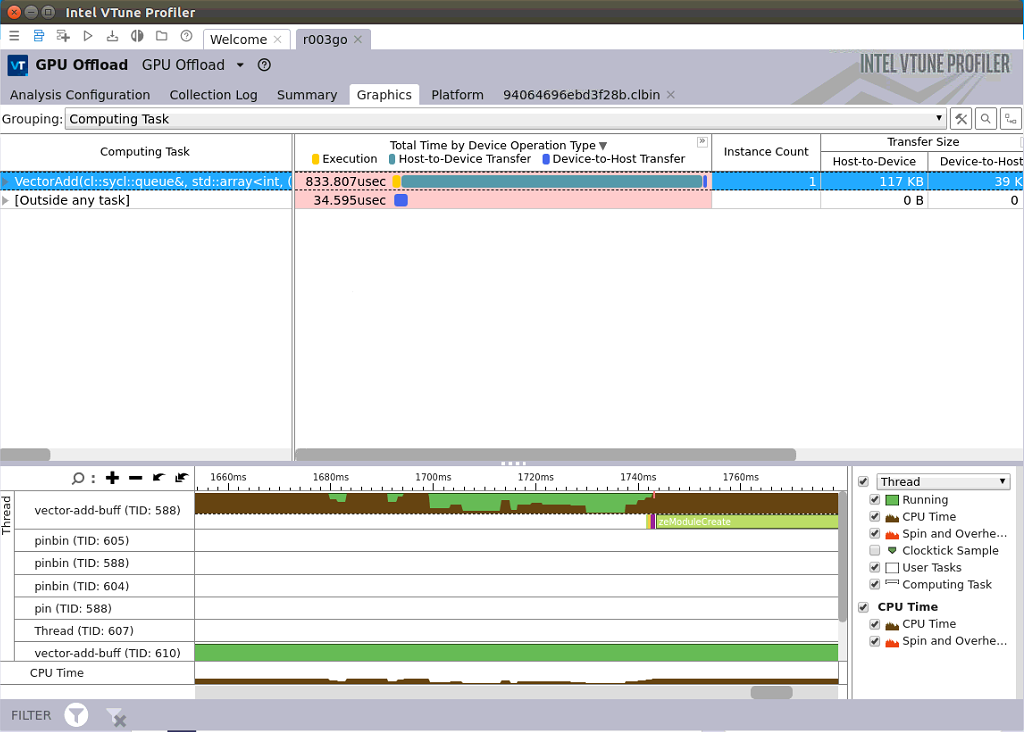
Intel VTune Profiler can reveal oneAPI SYCL hotspot kernel function (Vector-Add for this case) and also oneAPI Level Zero's call flows in Intel VTune Profiler's timeline below.
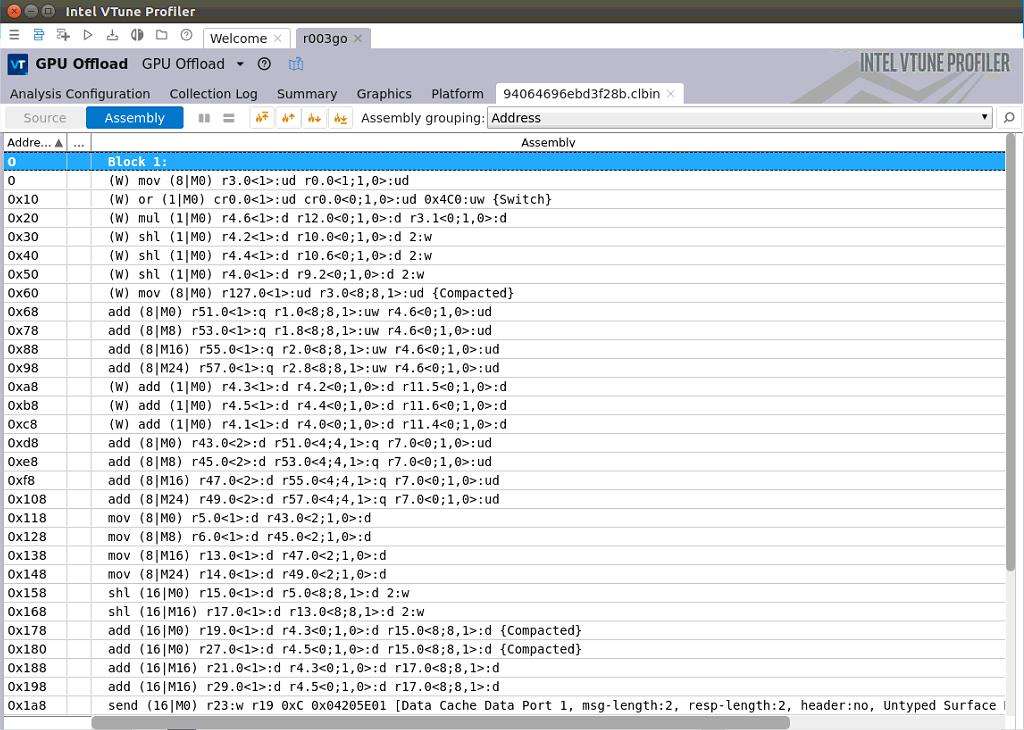
And it's the same as OpenCL* kernel profiling capabilities Intel VTune Profiler could provide; Intel VTune Profiler can reveal SYCL kernel implementation details in source assembly level.
See Also
Intel® VTune™ Profiler User Guide - Containerization Support
Get Started with the Intel® oneAPI Base Toolkit for Linux* (Beta) - Using Containers
Intel® oneAPI IoT Toolkit Container for Ubuntu and CentOS