Introduction
FFmpeg* is an open source tool for processing, converting, and streaming multimedia content such as audio and video. This article demonstrates the concept of profiling FFmpeg using Intel® VTune™ Profiler, which enables us to identify performance bottlenecks and implement optimization effectively.
Prerequisites
- Operating system: Ubuntu*, Windows*
Note The instructions in this article are tested on Ubuntu 22.04.2. - Root or sudo privileges are required.
Note Intel VTune Profiler needs to be run as an administrator to do hardware event-based sampling because FFmpeg depends on Linux kernel modules. - Install FFmpeg on Ubuntu.
- Update repository: apt update && sudo apt upgrade
- Install FFmpeg: apt install ffmpeg
- Verify the installation: -version
- Install stand-alone Intel VTune Profiler or Intel® oneAPI Base ToolKit (which includes Intel VTune Profiler)
Video Creation with FFmpeg
In this article, we focus on analyzing the process of video creation using FFmpeg with Intel VTune Profiler. The following is a general syntax for the FFmpeg command to create a video:
ffmpeg [global_options] [input_options] -i input_file [output_options] output_file
Where:
- [global_options]: Options that apply globally to the entire FFmpeg process
- [input_options]: Options specific to the input sources
- -i input_file: Specifies the input file or source
- [output_options]: Options specific to the output video file
- output_file: Name of the output video file you want to create
Note To view a summary of available FFmpeg options along with their descriptions directly in the terminal, you can use the command ffmpeg -h. For more comprehensive information on FFmpeg, refer to the documentation referenced in this article.
Approaches
We can profile an application in Intel VTune Profiler using the Launch Application method or the Attach to Process method.
Method 1: Steps to Use the Launch Application Method
Use the Command Line Interface
- The following is a sample command line for generating an mp4 video:
ffmpeg -y -f lavfi -i testsrc=duration=600:size=1280x720:rate=30 testsrc.mp4
In the previous command, FFmpeg generates a 10-minute (600 second) test video with a resolution of 1280 x 720 pixels and a frame rate of 30 frames per second, and then saves it as testsrc.mp4 in the current working directory. - To run the desired performance analysis, use the following command:
Where:vtune-collect <analysis_type> [-target-system=<system>] [-knob <knobName=knobValue>] [--] <target>
- <analysis_type>: The type of analysis to run. To see the list of available analysis types, enter vtune -help collect.
- -target-system: An option targeted for remote analysis and specifies a remote Linux* system or an Android* device.
- -knob: A configuration option that modifies the analysis.
- [knobName=knobValue]: The name of the specified knob and its value.
- <target>: The path and name of the application for analysis. In this scenario, we need to replace <target> with the command used in Step 1.
Run the following sample command to run a hotspot analysis:
vtune -collect hotspots -knob sampling-mode=hw --app-working-dir=/home/<username> -- ffmpeg -y -f lavfi -i testsrc=duration=600:size=1280x720:rate=30 testsrc.mp4
To run a predefined performance analysis, in the Intel VTune Profiler User Guide, see Run Command Line Analysis.
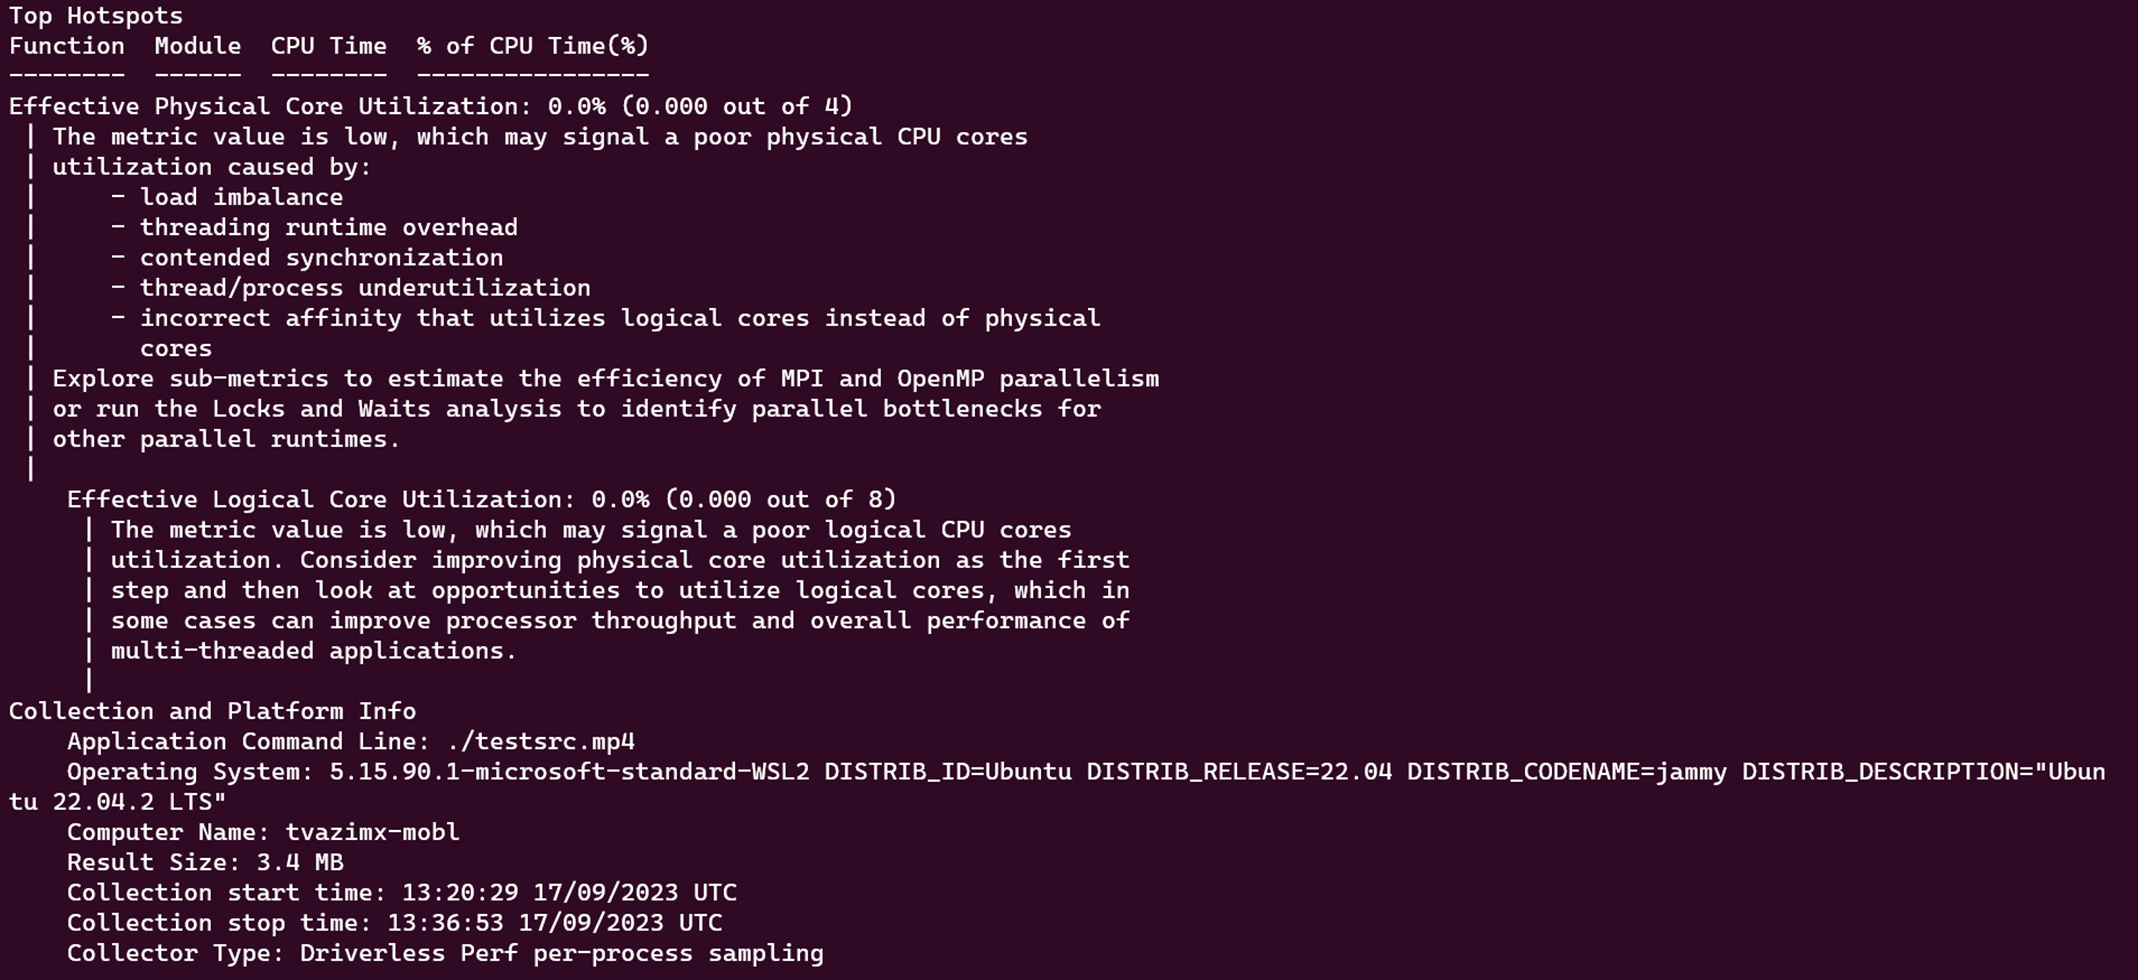
The output looks like the following screenshot:
Use the Graphical User Interface
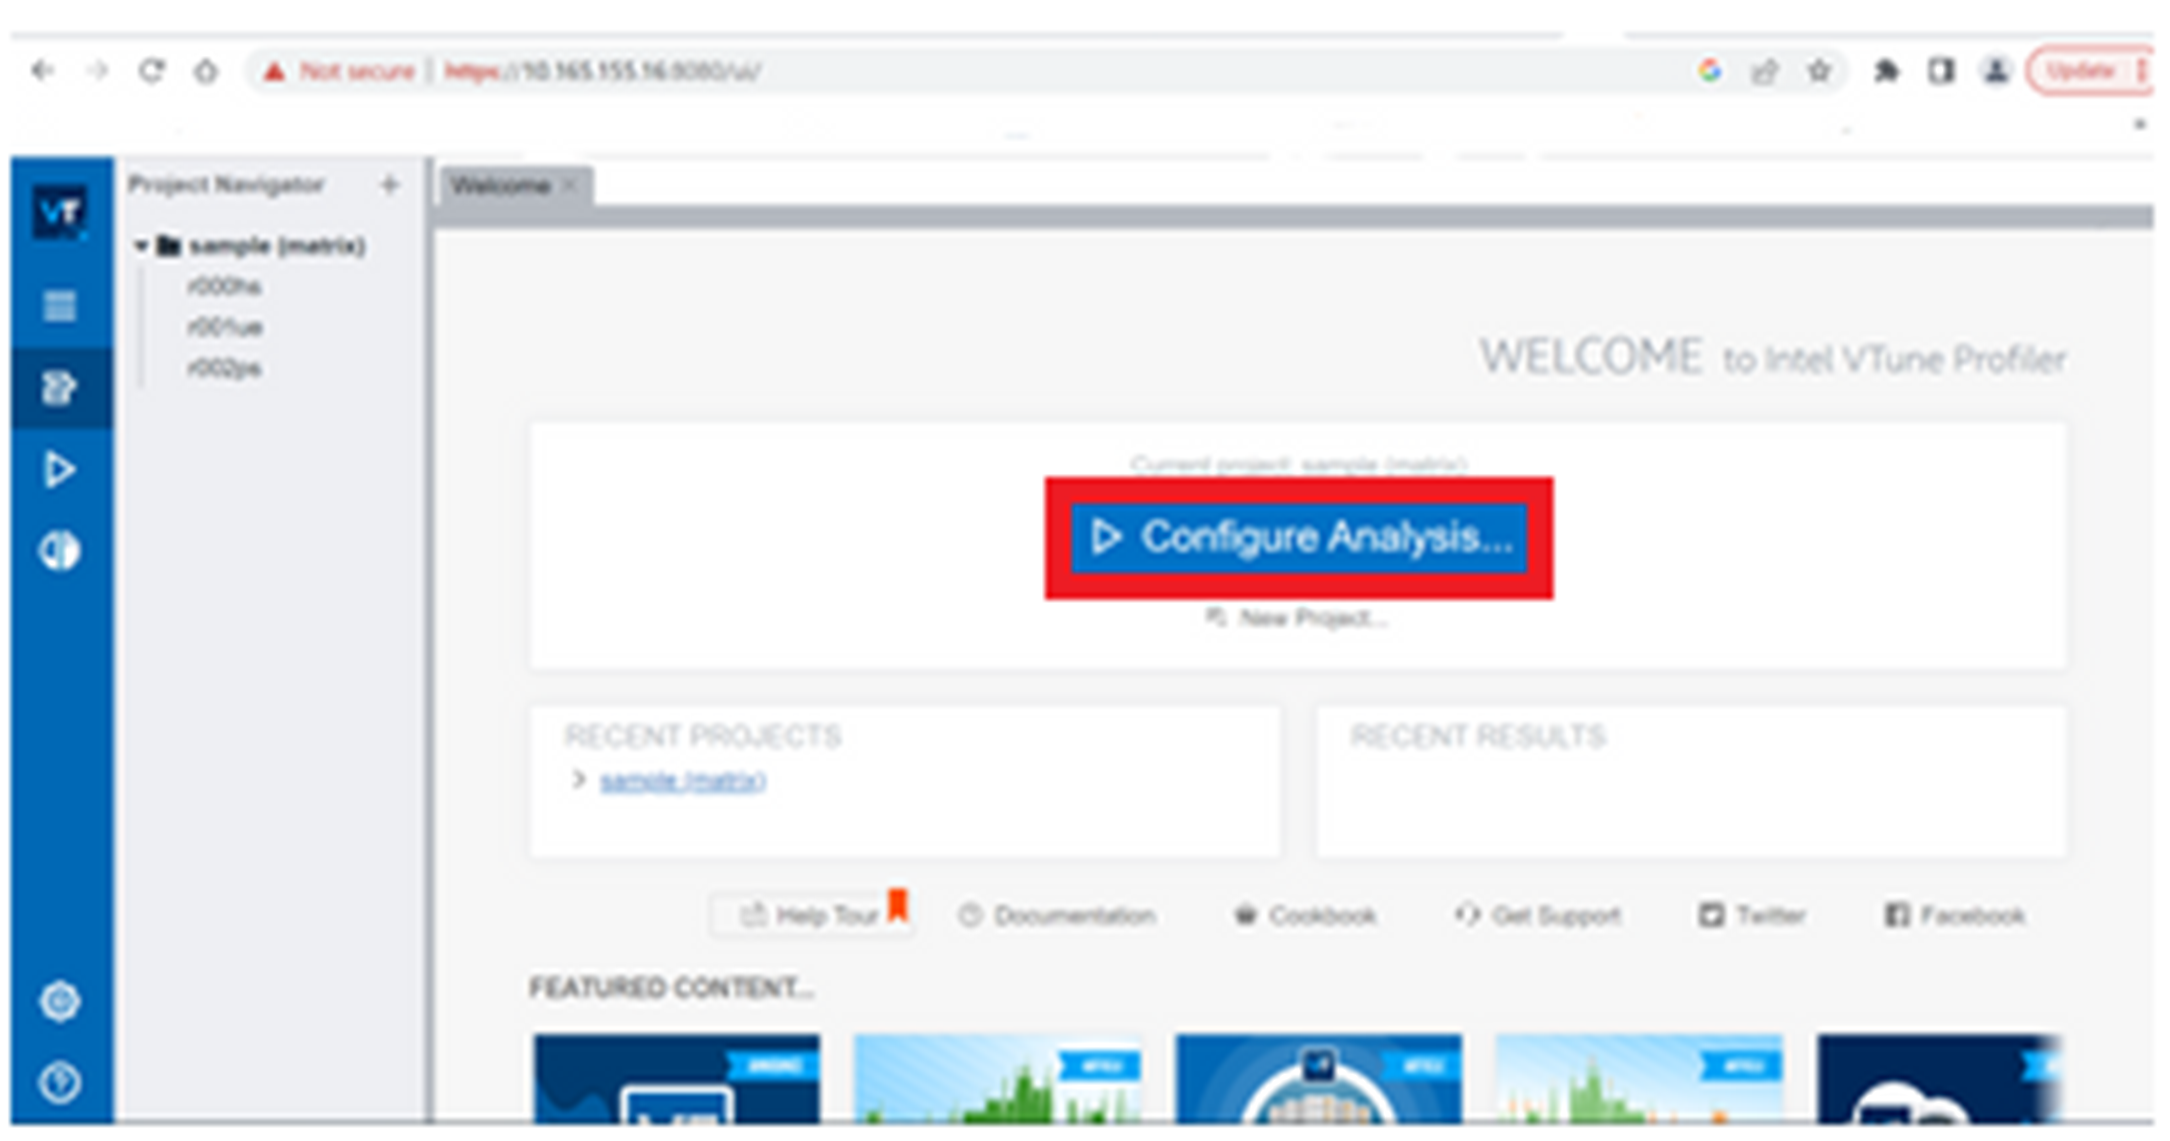
- Launch the Intel VTune Profiler application as an administrator, and then select Configure Analysis, as shown in the following image.
Upon configuring the analysis, the following Configure Analysis page appears:
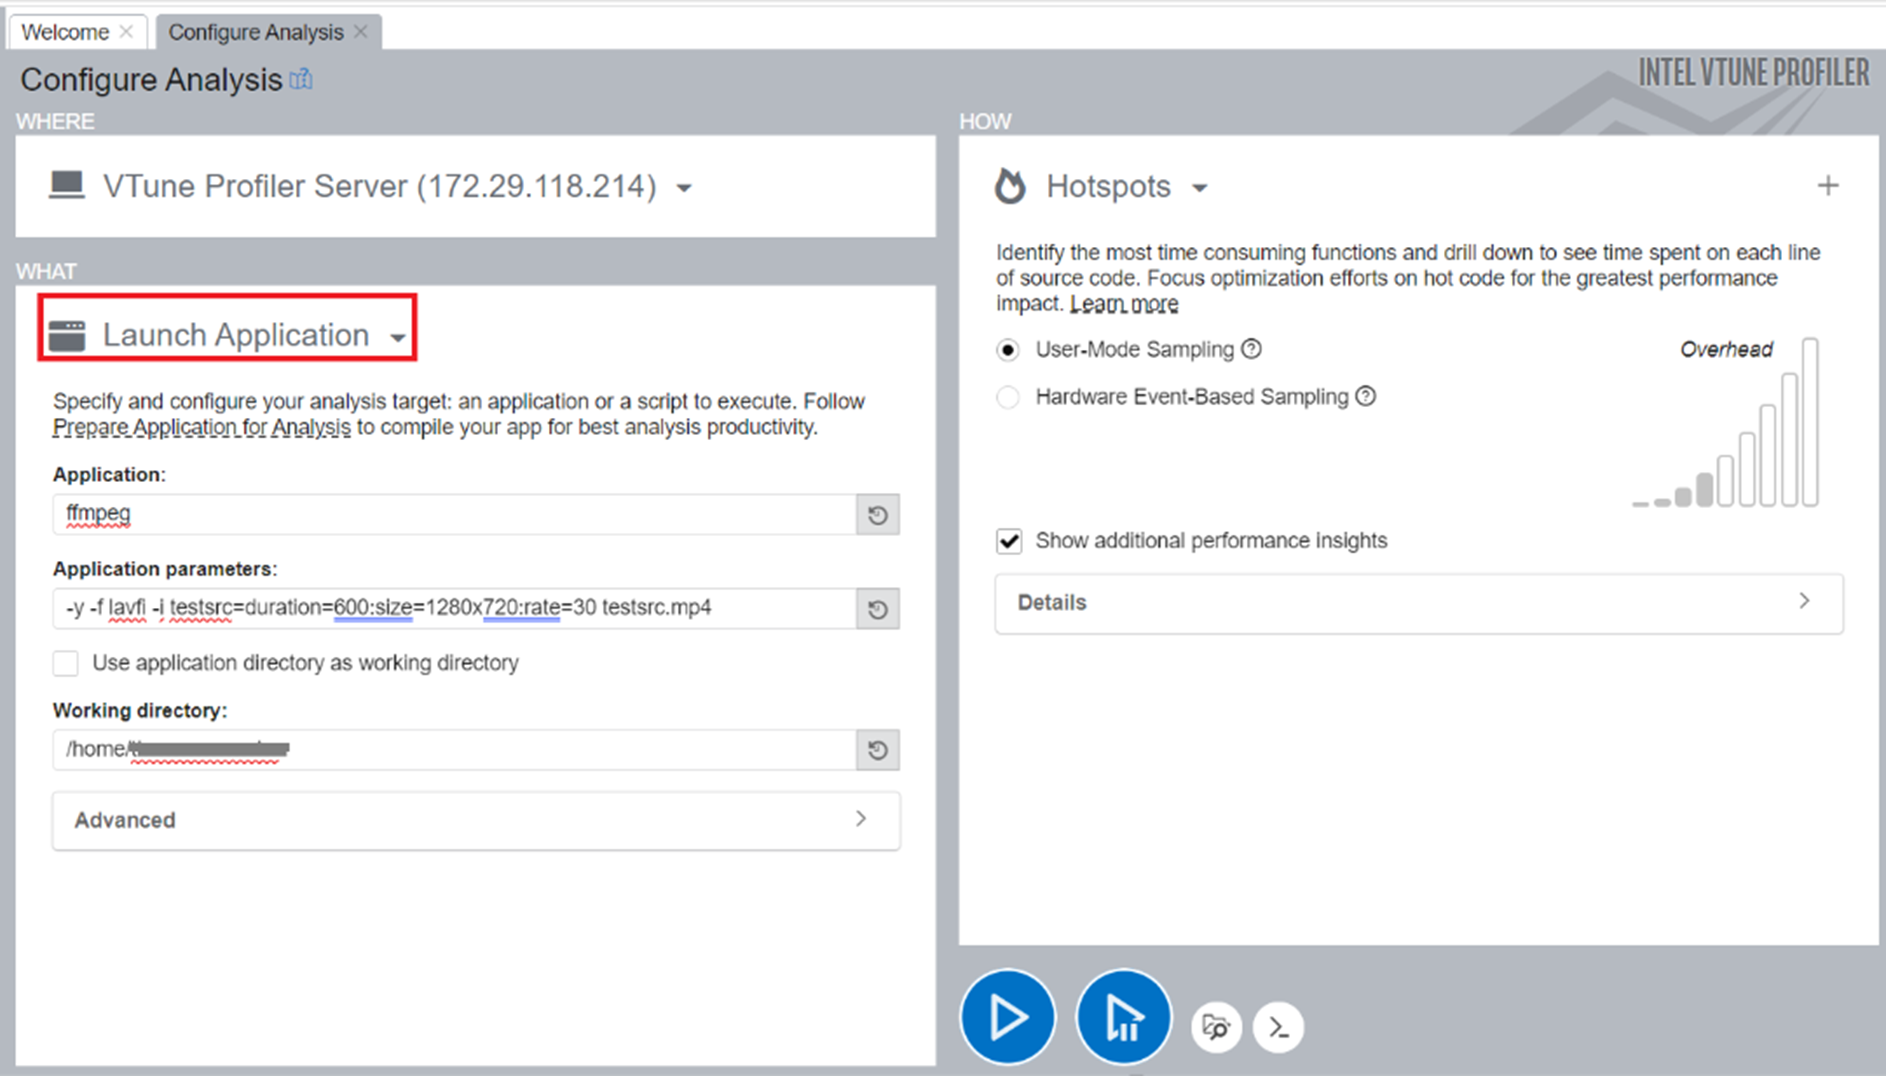
Under the WHAT section, select Launch Application from the dropdown list. Under Launch Application, there are two fields for Application and Application parameters. The following screenshot gives an example of providing details to launch an FFmpeg application.
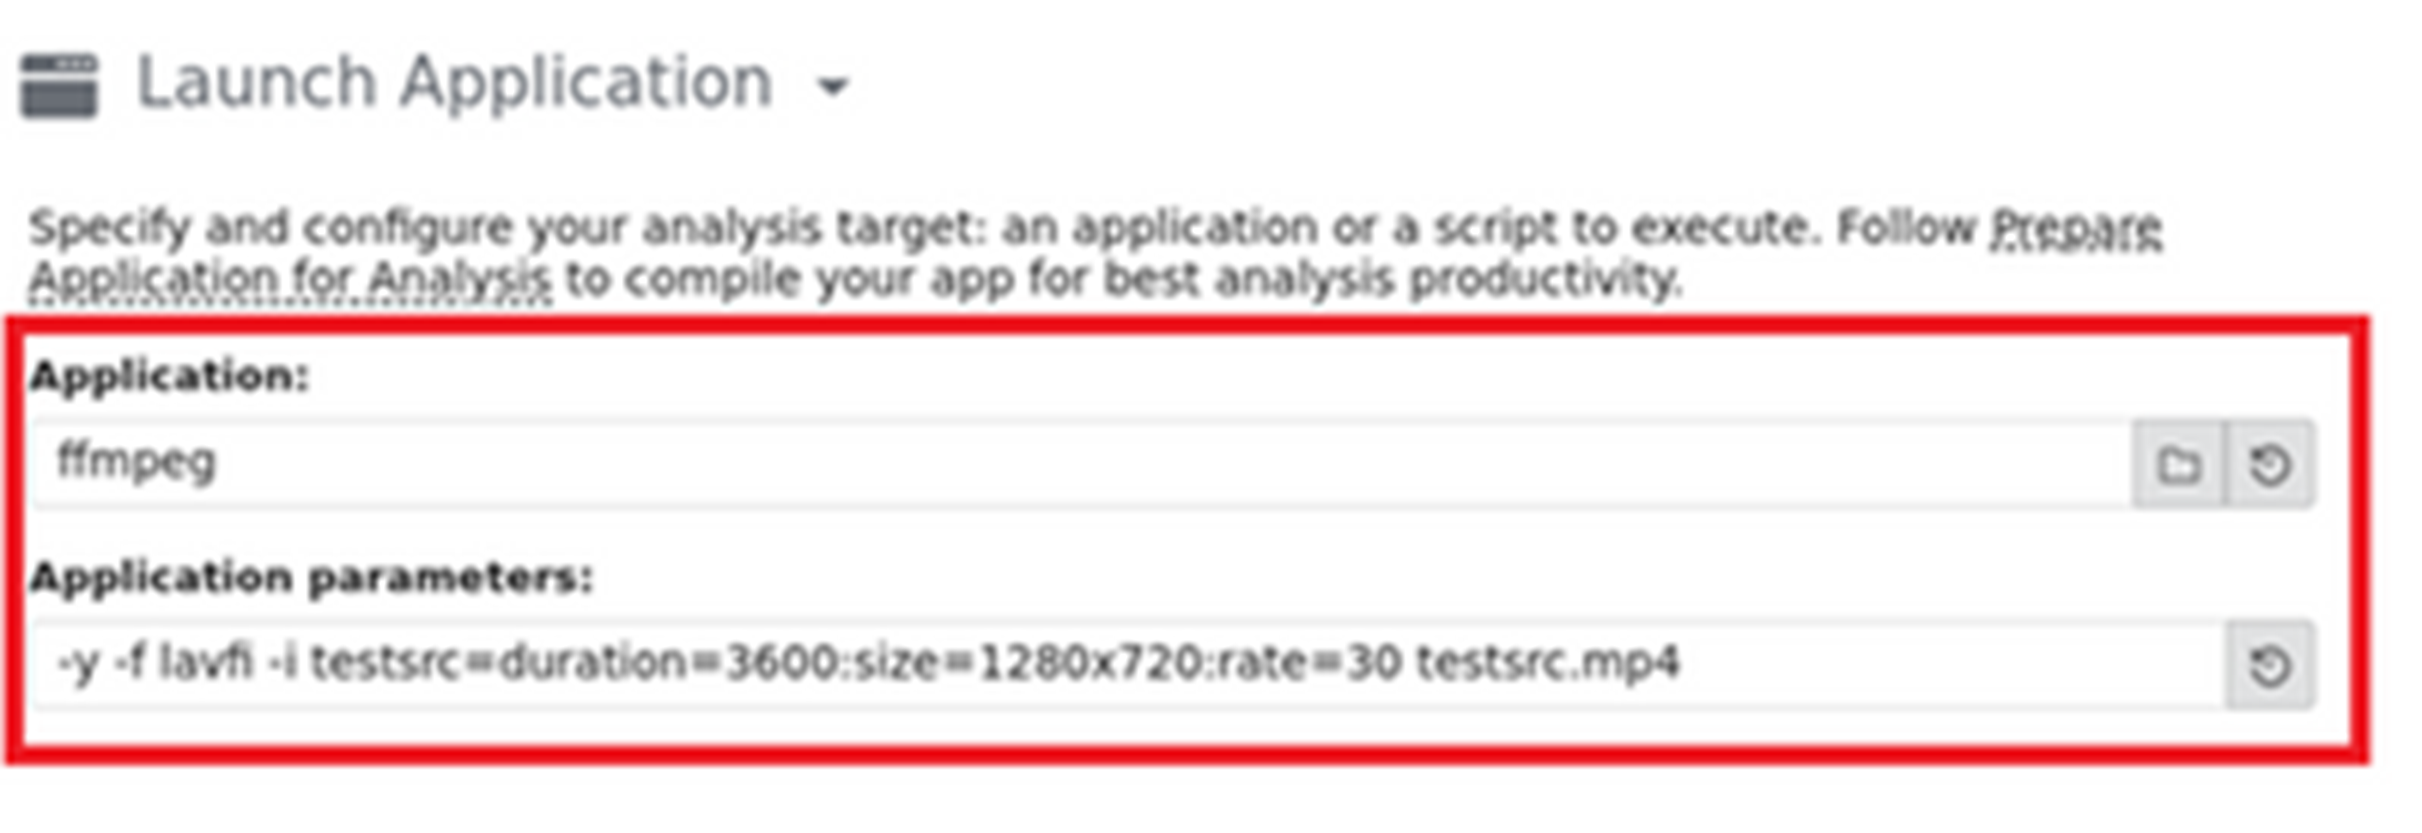
- When you try to profile an application via the launch application option, by default the output is stored in the directory where the application exists. You can disable this by deselecting the Use application directory as working directory option, and then selecting a location with appropriate write permissions, such as your home directory, as shown in the screenshot:

- Choose the Hotspots analysis type under the HOW section as given in the screenshot below. Here, you can select either User-Mode Sampling or Hardware Event-Based Sampling, based on the requirements. Select the Play button as shown in the following screenshot.
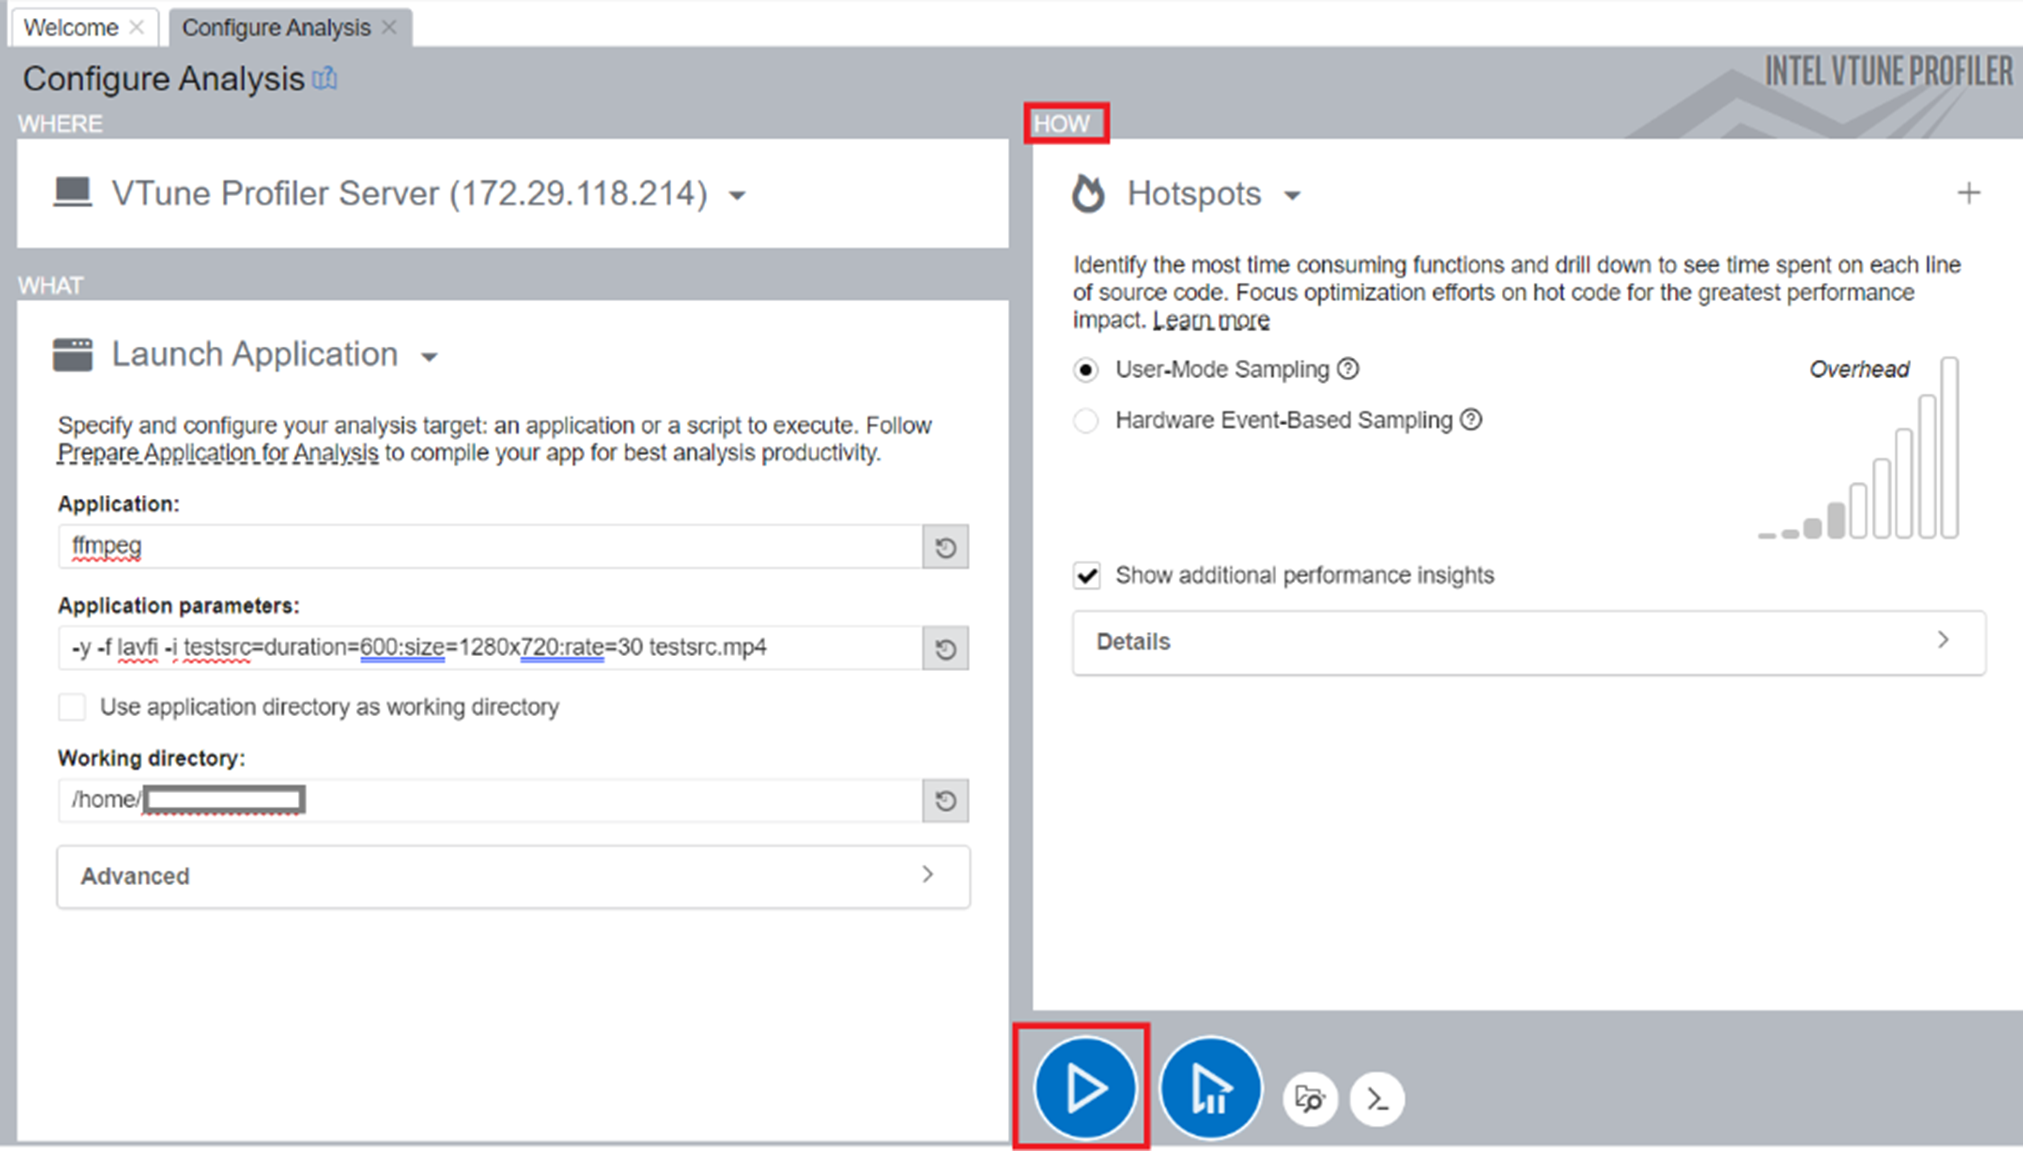
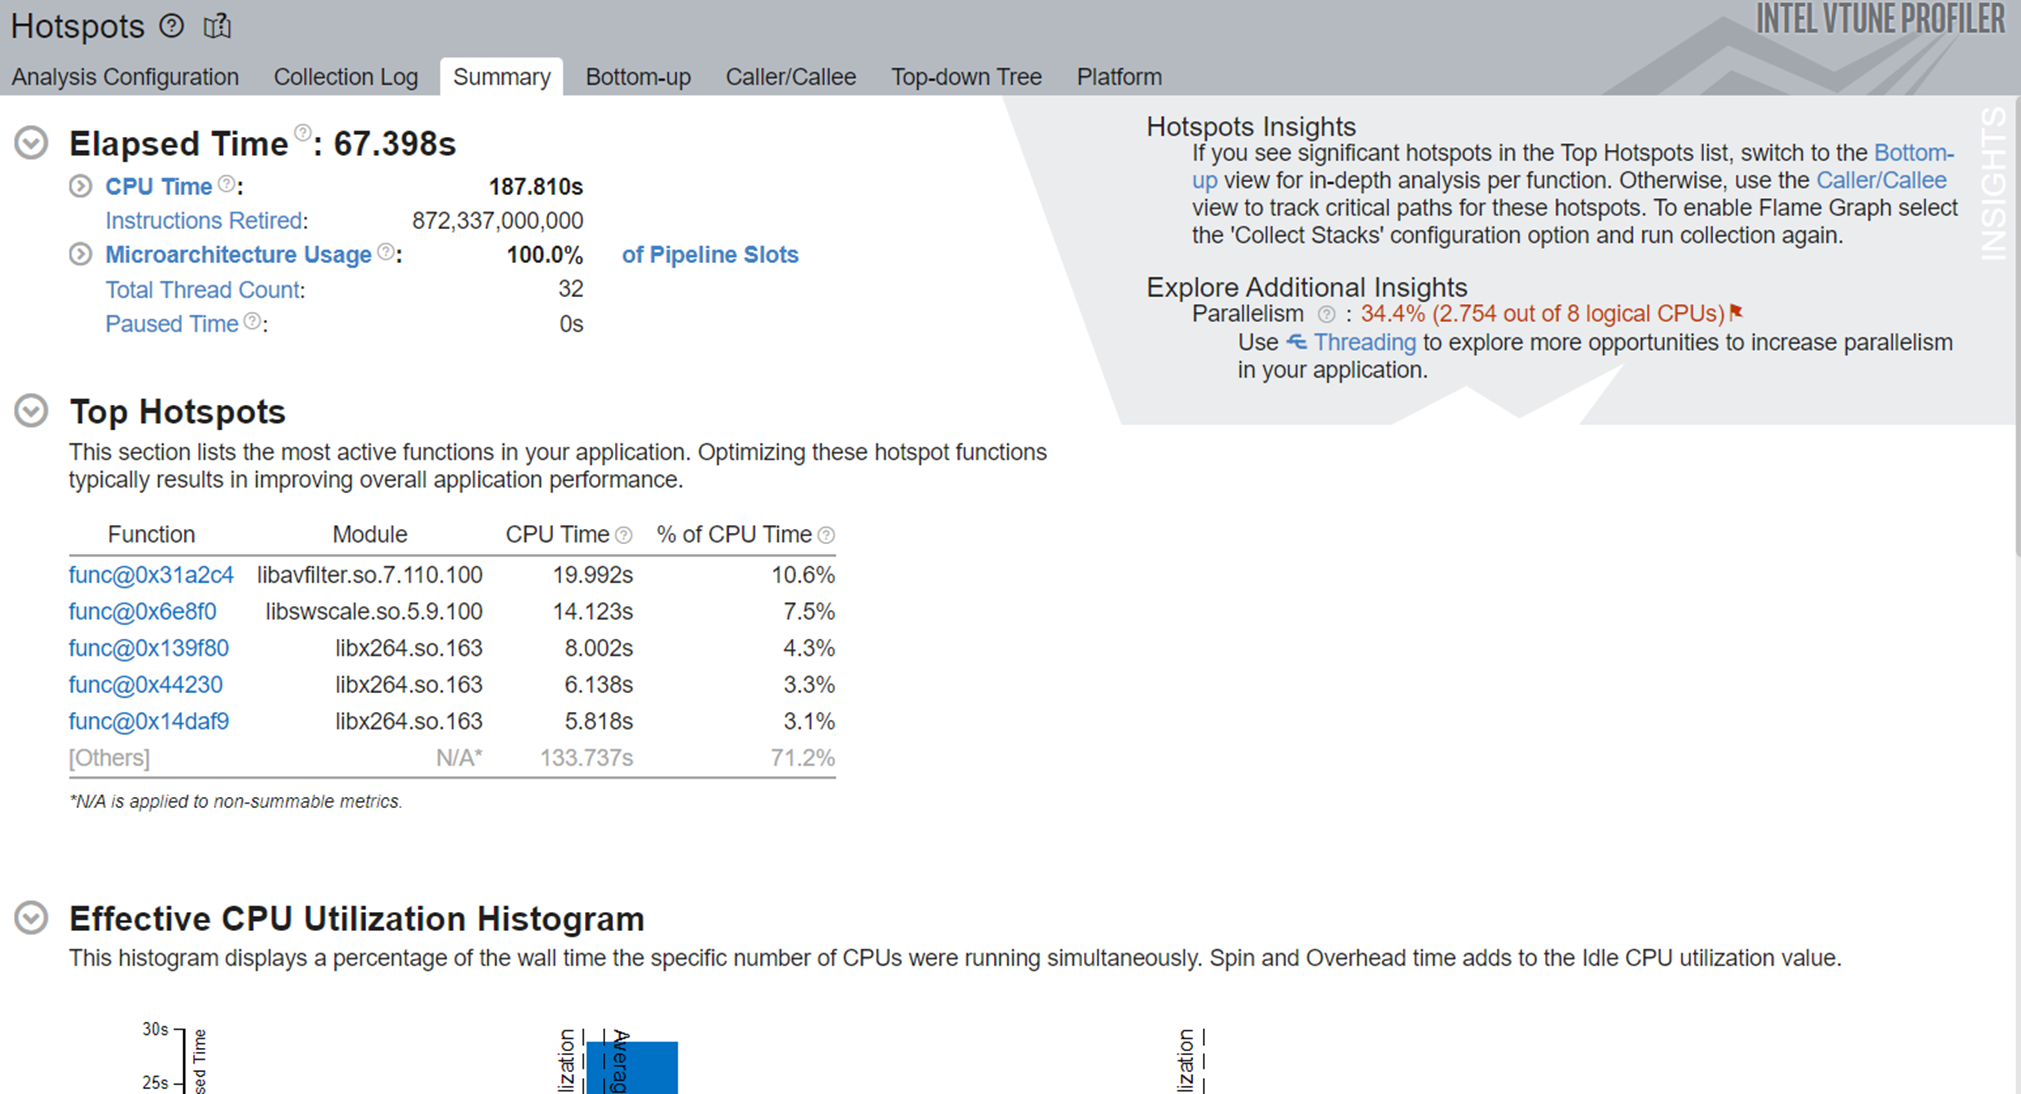
The Hotspots analysis is designed to identify the most time-consuming functions and lines of code in your application. After running the Hotspots analysis, we get information to identify performance bottlenecks in your application. The screenshot obtained after running the hotspot analysis is shown:
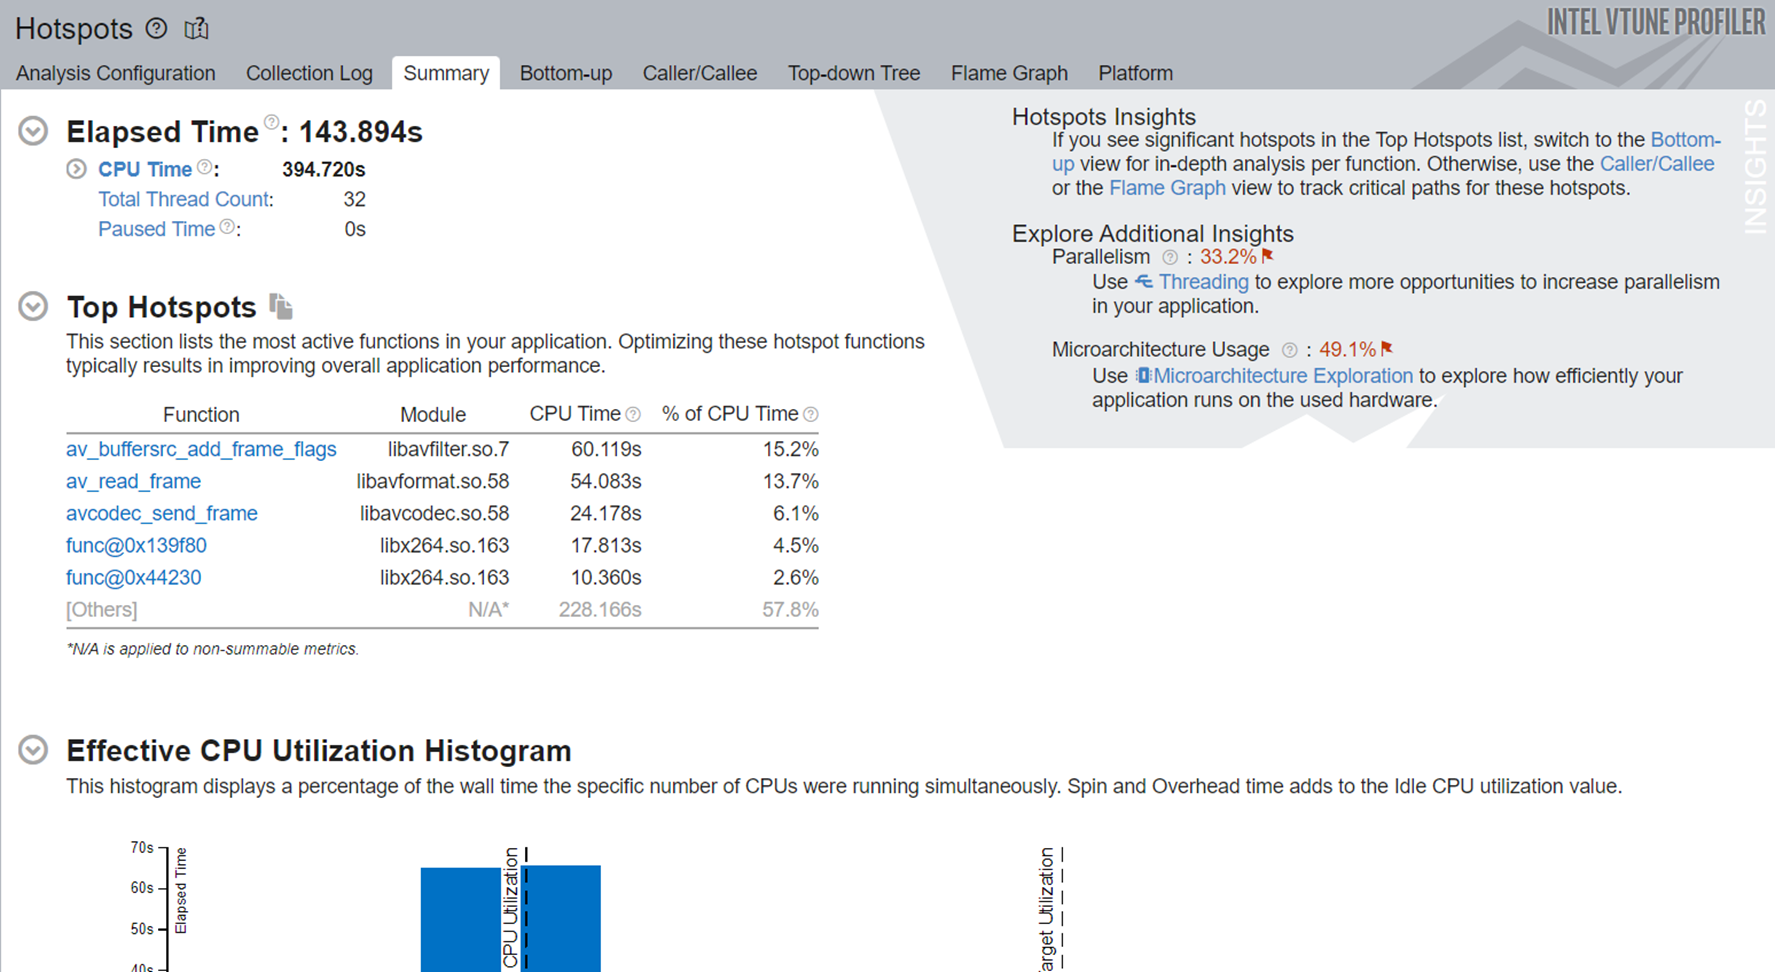
The tabs displayed at the top of the screenshot are used for performance analysis and are explained as follows:
- Summary: The summary view provides an overview of the most time-consuming functions or code regions in your application.
- Bottom-Up: It shows the total CPU time and the number of samples for each function, including the functions that call them.
- Caller/Callee: It displays the parent and child functions of the selected focus function.
- Top-Down Tree: The top-down tree view presents a hierarchical representation of the application's call tree, starting from the top-level functions down to the leaf functions.
- Flame Graph: A Flame Graph visually represents the stacks and stack frames within your application.
- Platform: It can be used to analyze CPU, GPU, and bandwidth usage with platform metrics.
Method 2: Steps to Use the Attach to Process Method
Use the Command Line Interface
- Run the sample command to generate an mp4 video (as previously mentioned):
ffmpeg -y -f lavfi -i testsrc=duration=600:size=1280x720:rate=30 testsrc.mp4 - When the command starts running, run the command top in another tab to acquire the PID for the FFmpeg application. The following is a sample screenshot:
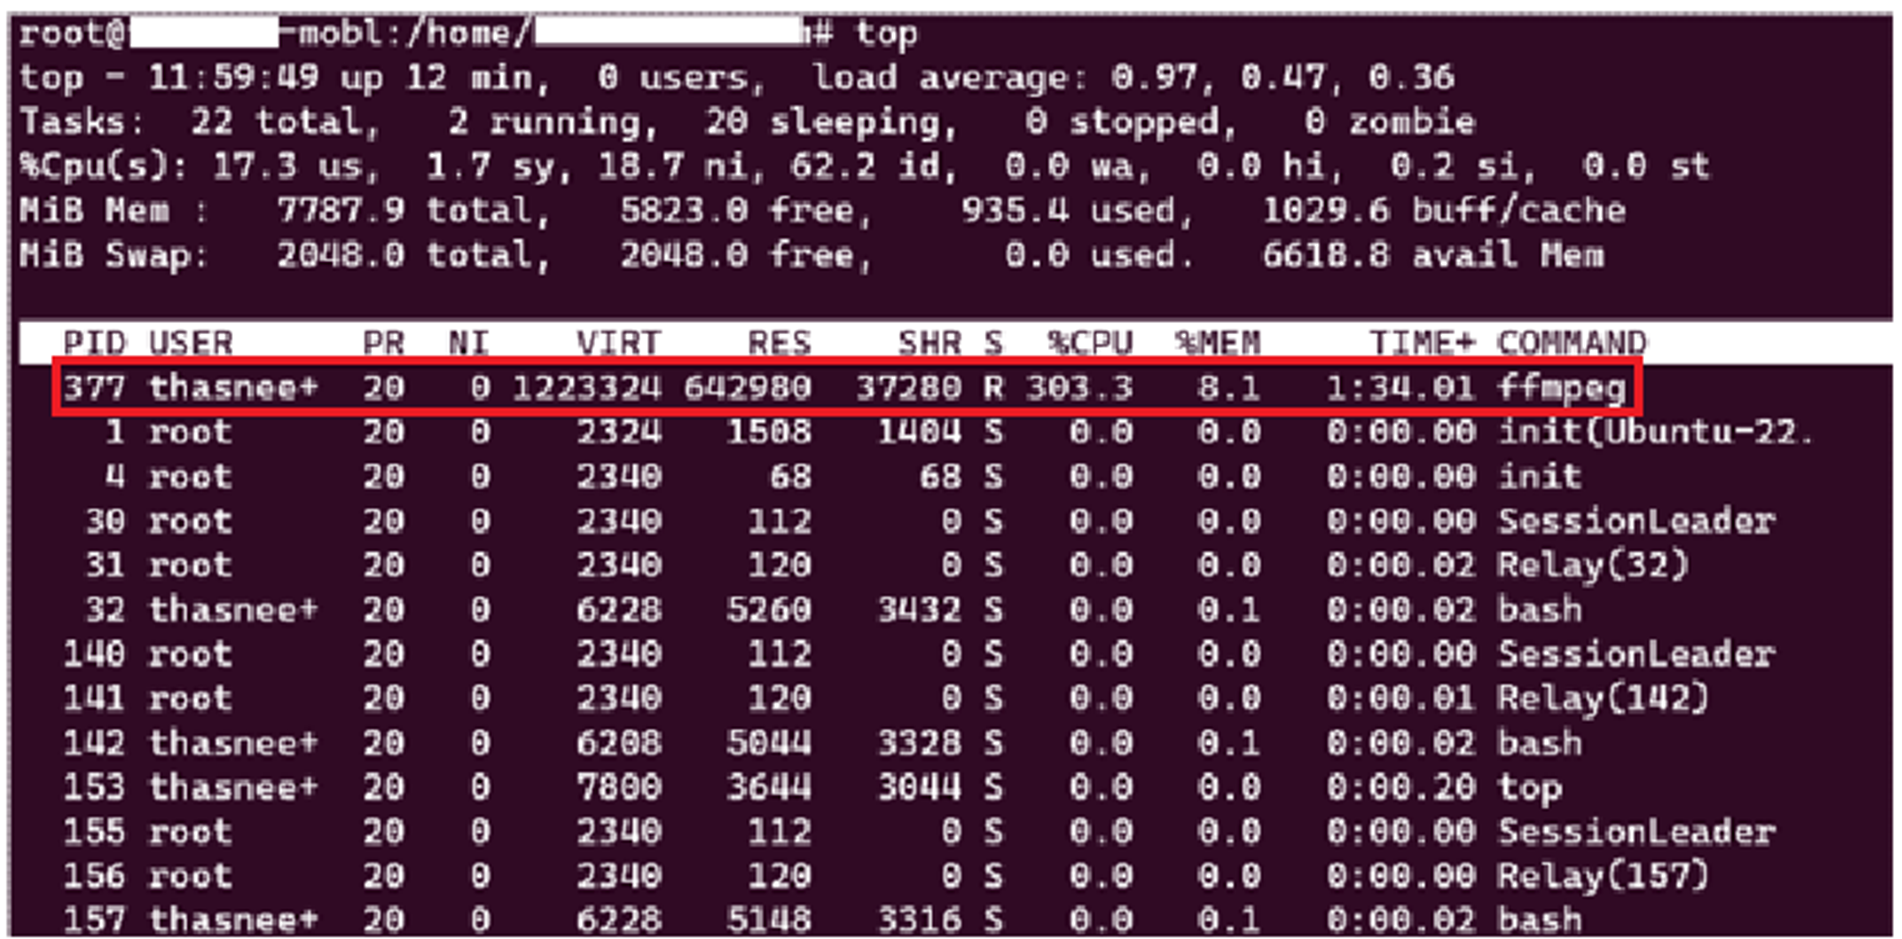
Note For Windows, the PID of the current application is obtained from task manager.
- The general syntax for the command to run the desired performance analysis is as follows:
Where:vtune -collect <analysis_type> [-target-system=<system>] [-knob <knobName=knobValue>] [--] -target-pid<pid>- <analysis_type>: The type of analysis to run. To see the list of available analysis types, enter: vtune -help collect.
- -target-system: An option targeted for remote analysis and specifies a remote Linux system or an Android device.
- -knob: A configuration option that modifies the analysis.
- [knobName=knobValue]: The name of the specified knob and its value.
- -target-pid: Denotes the process ID.
The sample command to run hotspot analysis is as follows:vtune -collect hotspots -knob sampling-mode=hw --target-pid 377
The output looks like this screenshot:

Use the Graphical User Interface
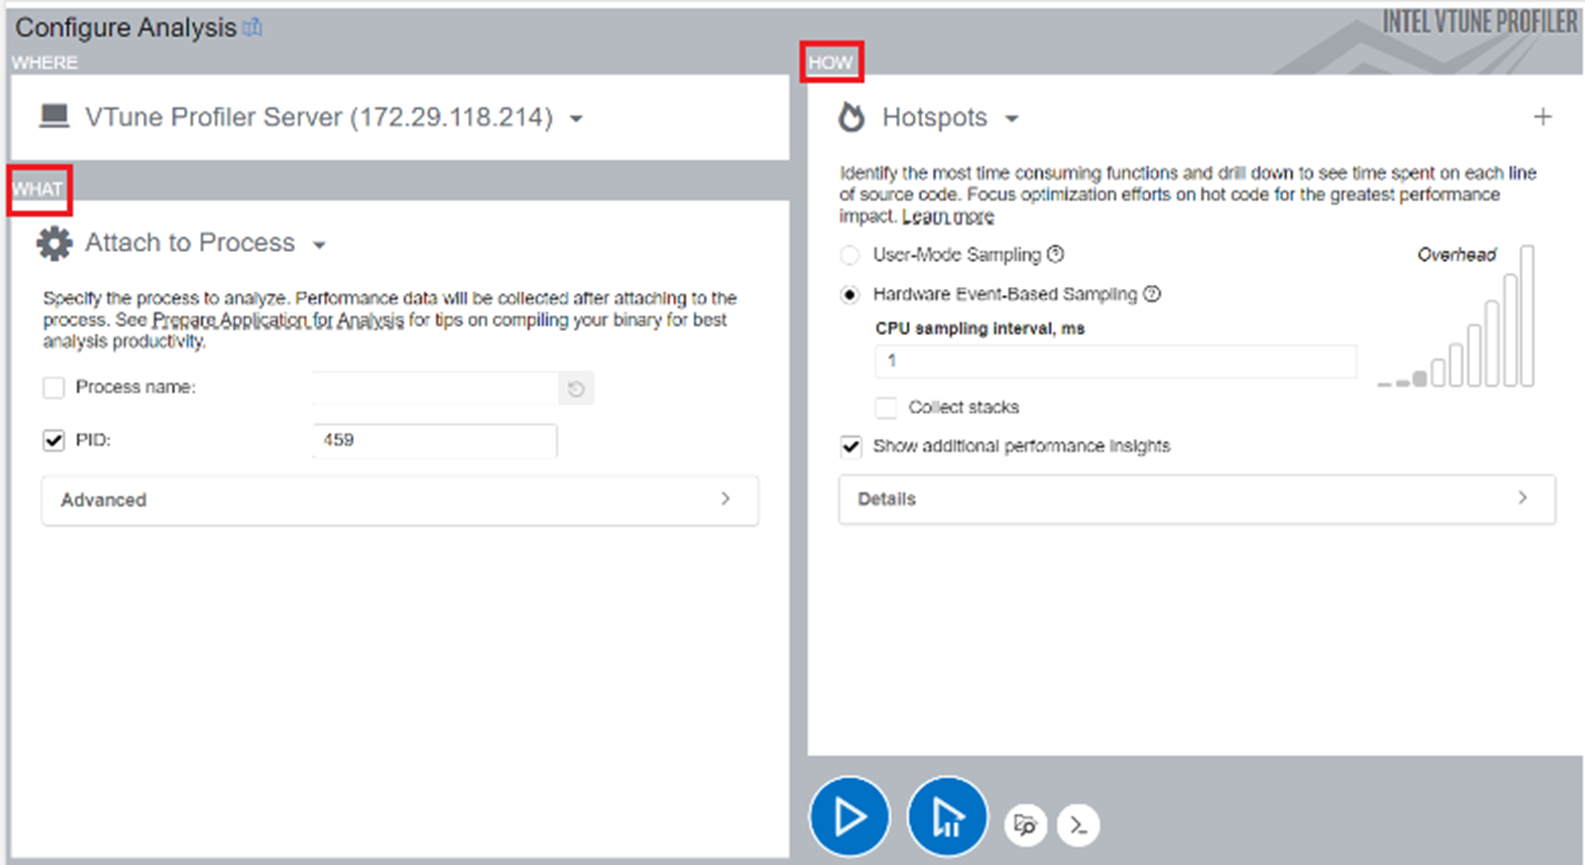
- In the Configure Analysis page, navigate to the WHAT section and select Attach to Process from the dropdown list. Within the Attach to Process section, you can either input the process name or its corresponding PID (Process ID) to profile an application.
- Proceed to the HOW section and choose Hotspots for analysis. Here, you have the option to choose either User-Mode Sampling or Hardware Event-Based Sampling. After making your selection, select the Play button to initiate the analysis.
You are redirected to the page as shown where different metrics related to hotspot analysis are available.
