Introduction
Intel® Graphics Performance Analyzers (GPA) offers a wide range of tools to analyze graphics applications across diverse workloads, platforms, and graphics APIs. Within Intel® GPA you can use Graphics Frame Analyzer to identify and analyze problem areas in your applications to resolve GPU performance regressions. This article will demonstrate how to open and explore a multi-frame stream file, while highlighting user interface features in the multi-frame view of Graphics Frame Analyzer. This will help you pinpoint performance regressions on a frame by frame basis, based on the captured platform and hardware metrics. Topics covered in this article can be visualized in video format in the Open and Explore Multiple Frames (Streams) Deep Dive video, by checking reference markers in the images associated with this article.
Pre-requisites
Before proceeding with this article, ensure you have the minimum system requirements to successfully analyze graphics applications using Intel® GPA. Also make sure you have downloaded and installed Intel® GPA on your host platform.
Open a Stream File
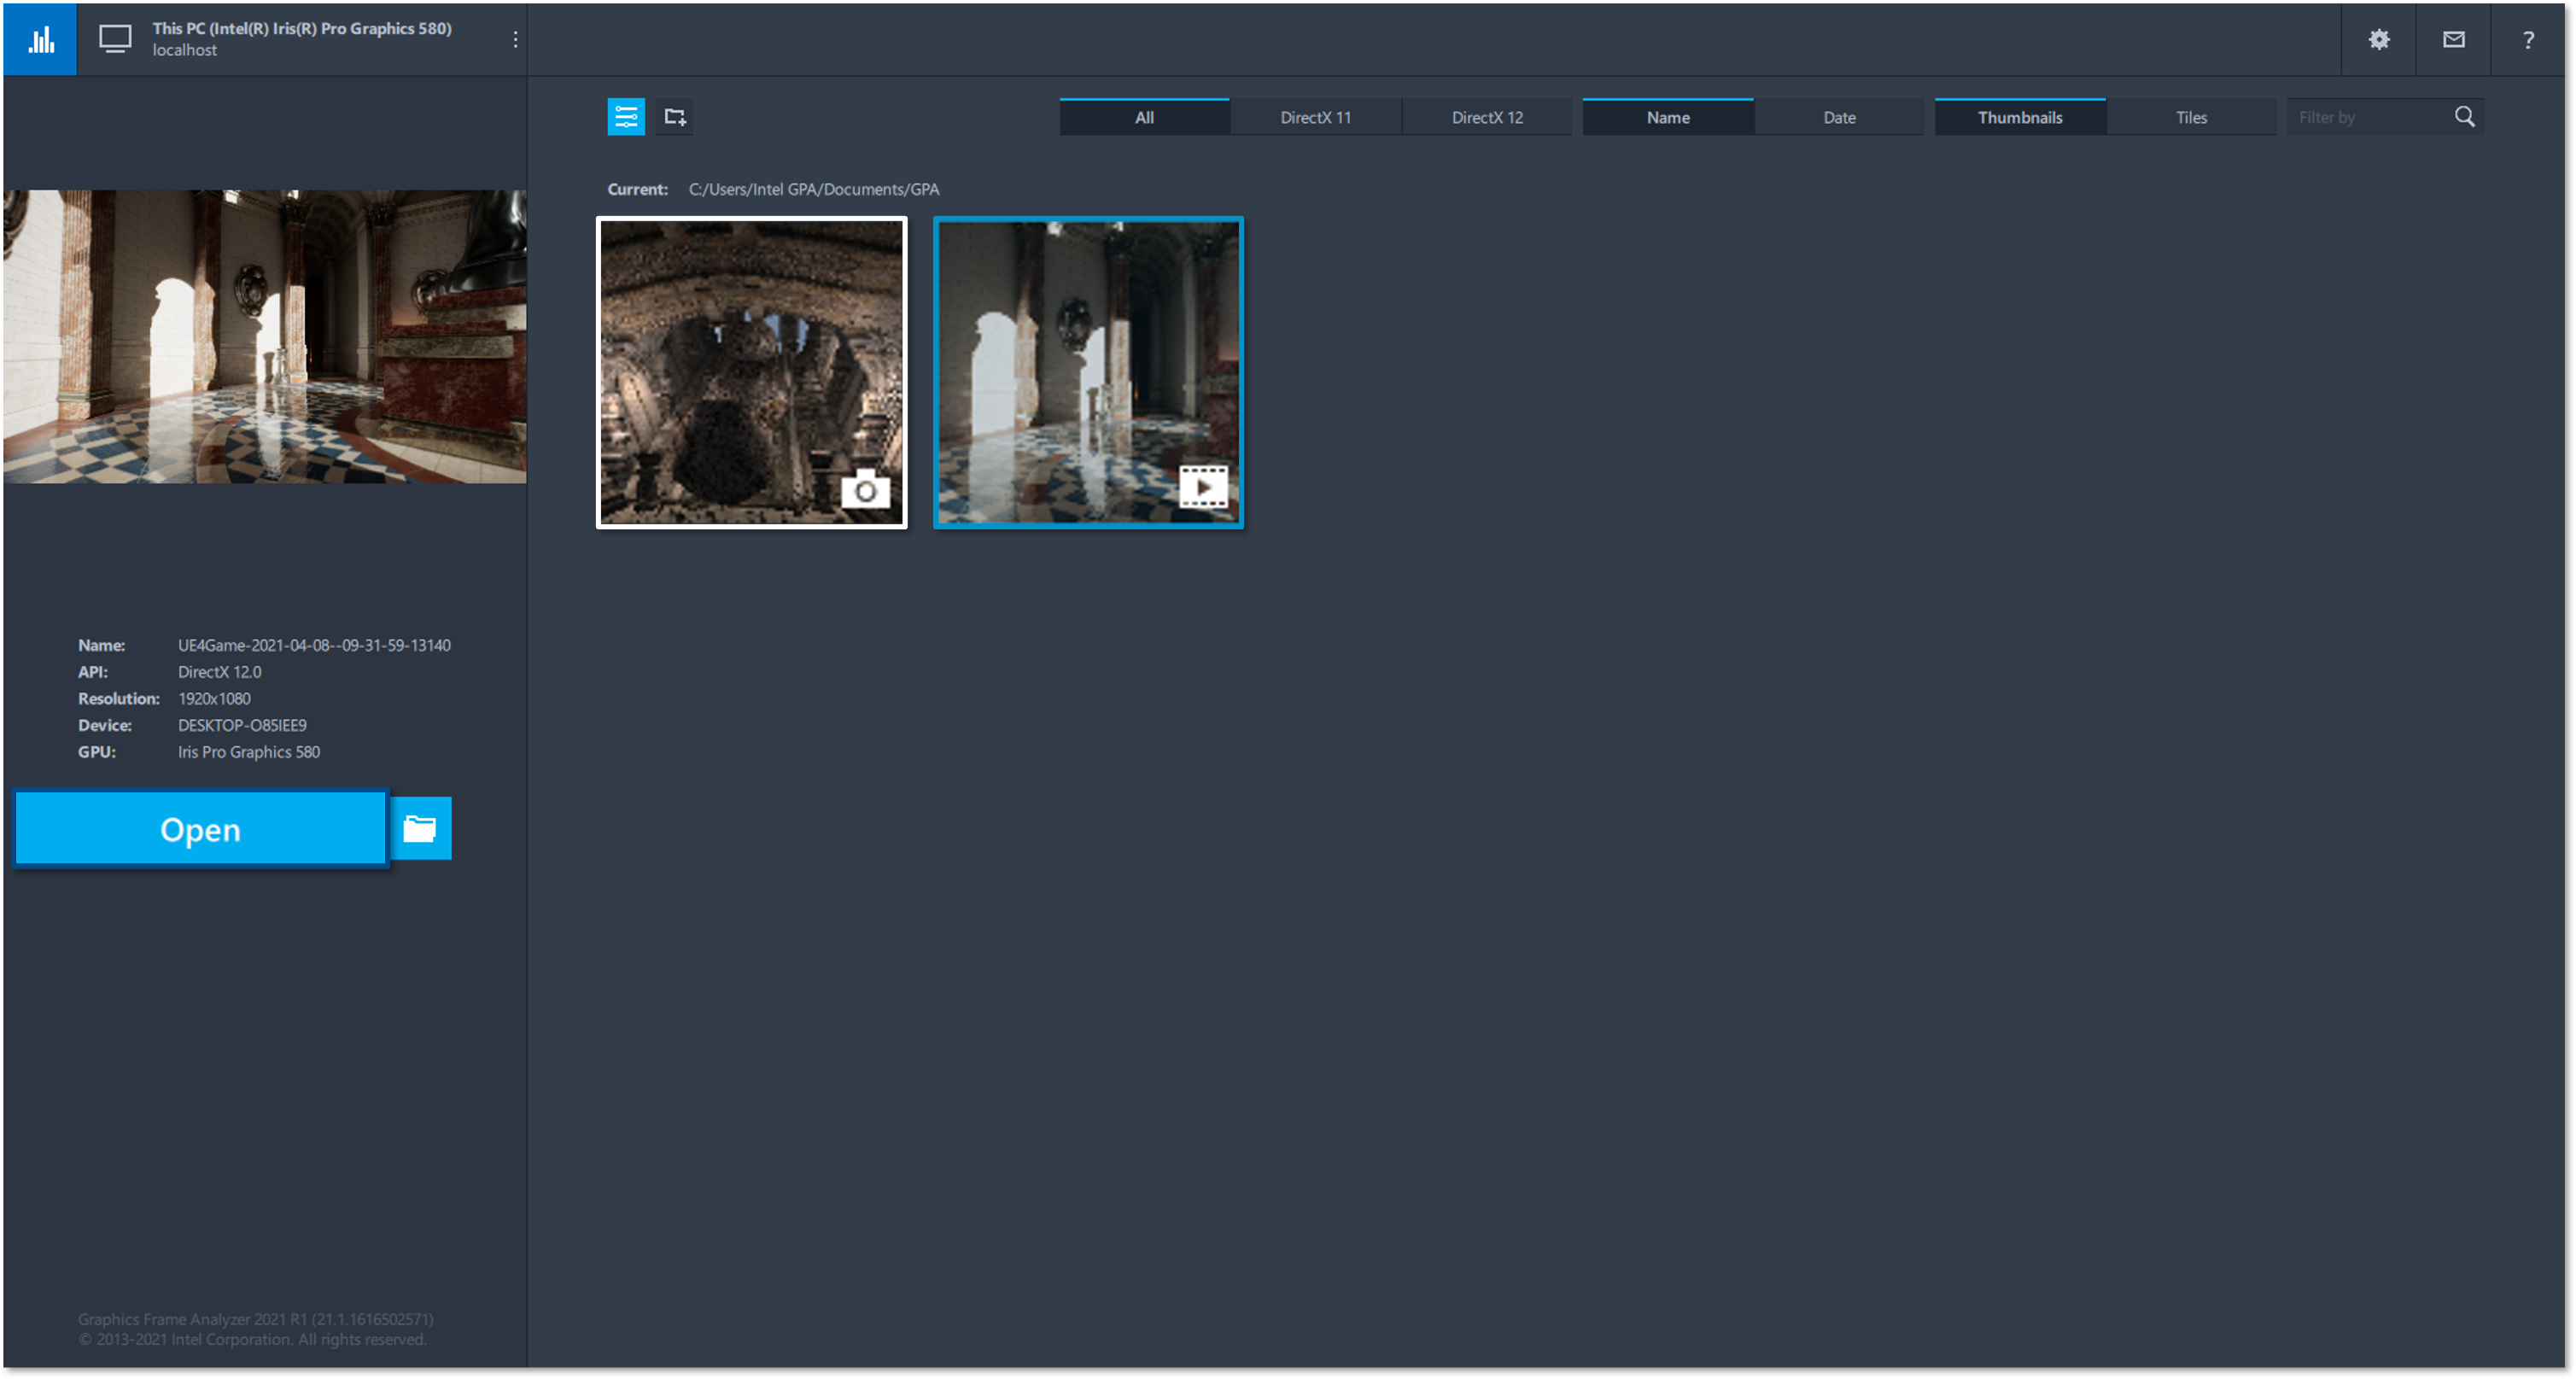
While in Graphics Frame Analyzer you can open a stream capture file by either double clicking on the image thumbnail or by pressing the open button once your stream file is selected.
NOTE: Multi-frame stream capture files can be distinguished from single frame capture files by viewing the icon to the bottom right of the image thumbnail. An icon that looks like film 🎞️ notates a multi-frame capture file, and the icon that looks like a camera 📷 notates a single frame capture file.
Left Panel
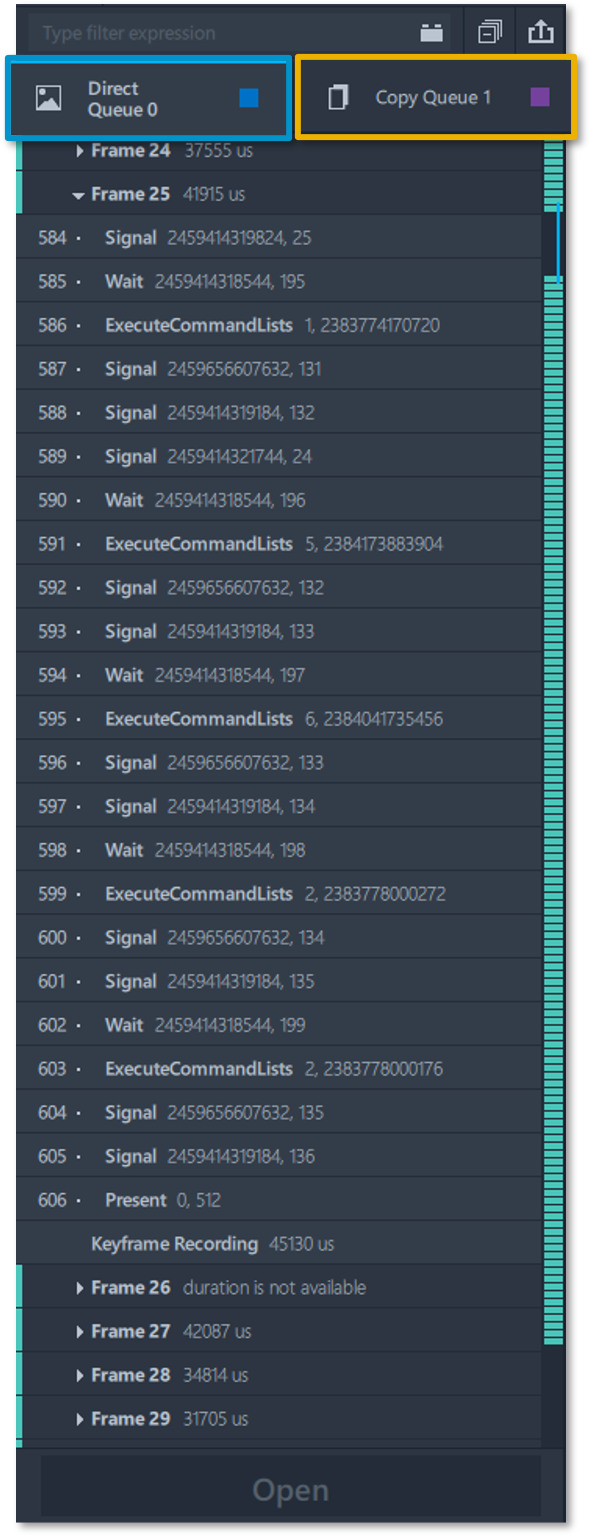
While in the multi-frame view of Graphics Frame Analyzer you can view the contents of your stream capture in the left panel of the tool. The left panel displays each frame captured throughout the stream, their durations as well as keyframe recordings if keyframing was enabled. If your application was captured using the Microsoft* DirectX 12 graphics API, you can view he different command queues and the respective data associated with those command queues in this panel. The multi-frame profiling view in Graphics Frame Analyzer supports three different types of command queues, notated by a different icon next to their names; these queues are the Direct Queue, the Compute Queue, and the Copy Queue.
NOTE: Only command queues that were created in your application will be displayed in this panel.
Middle Panel
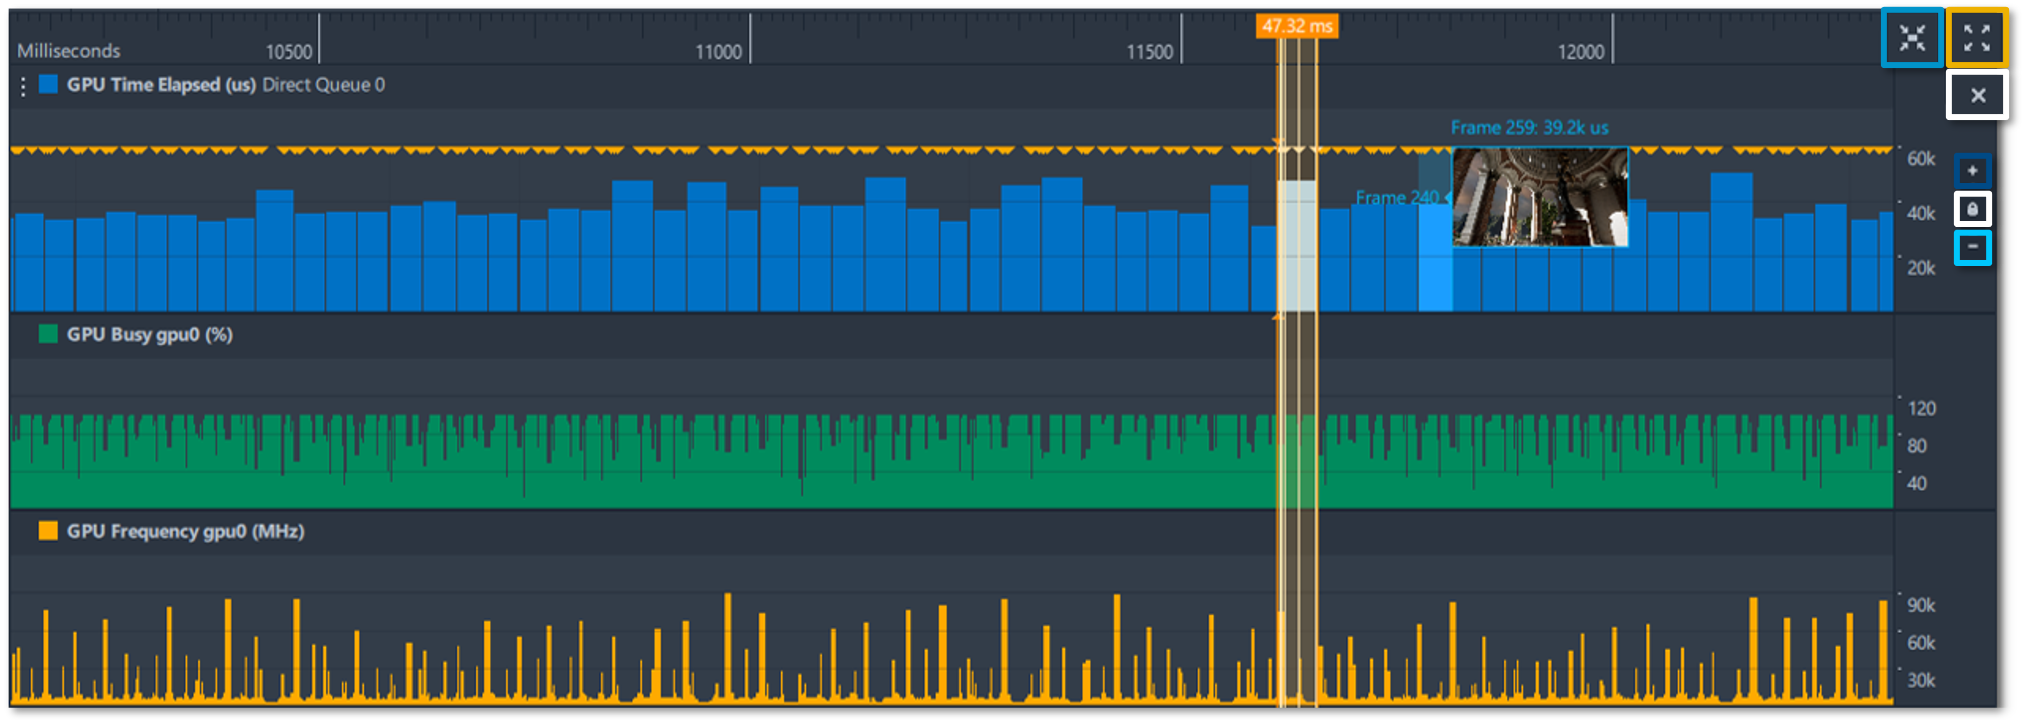
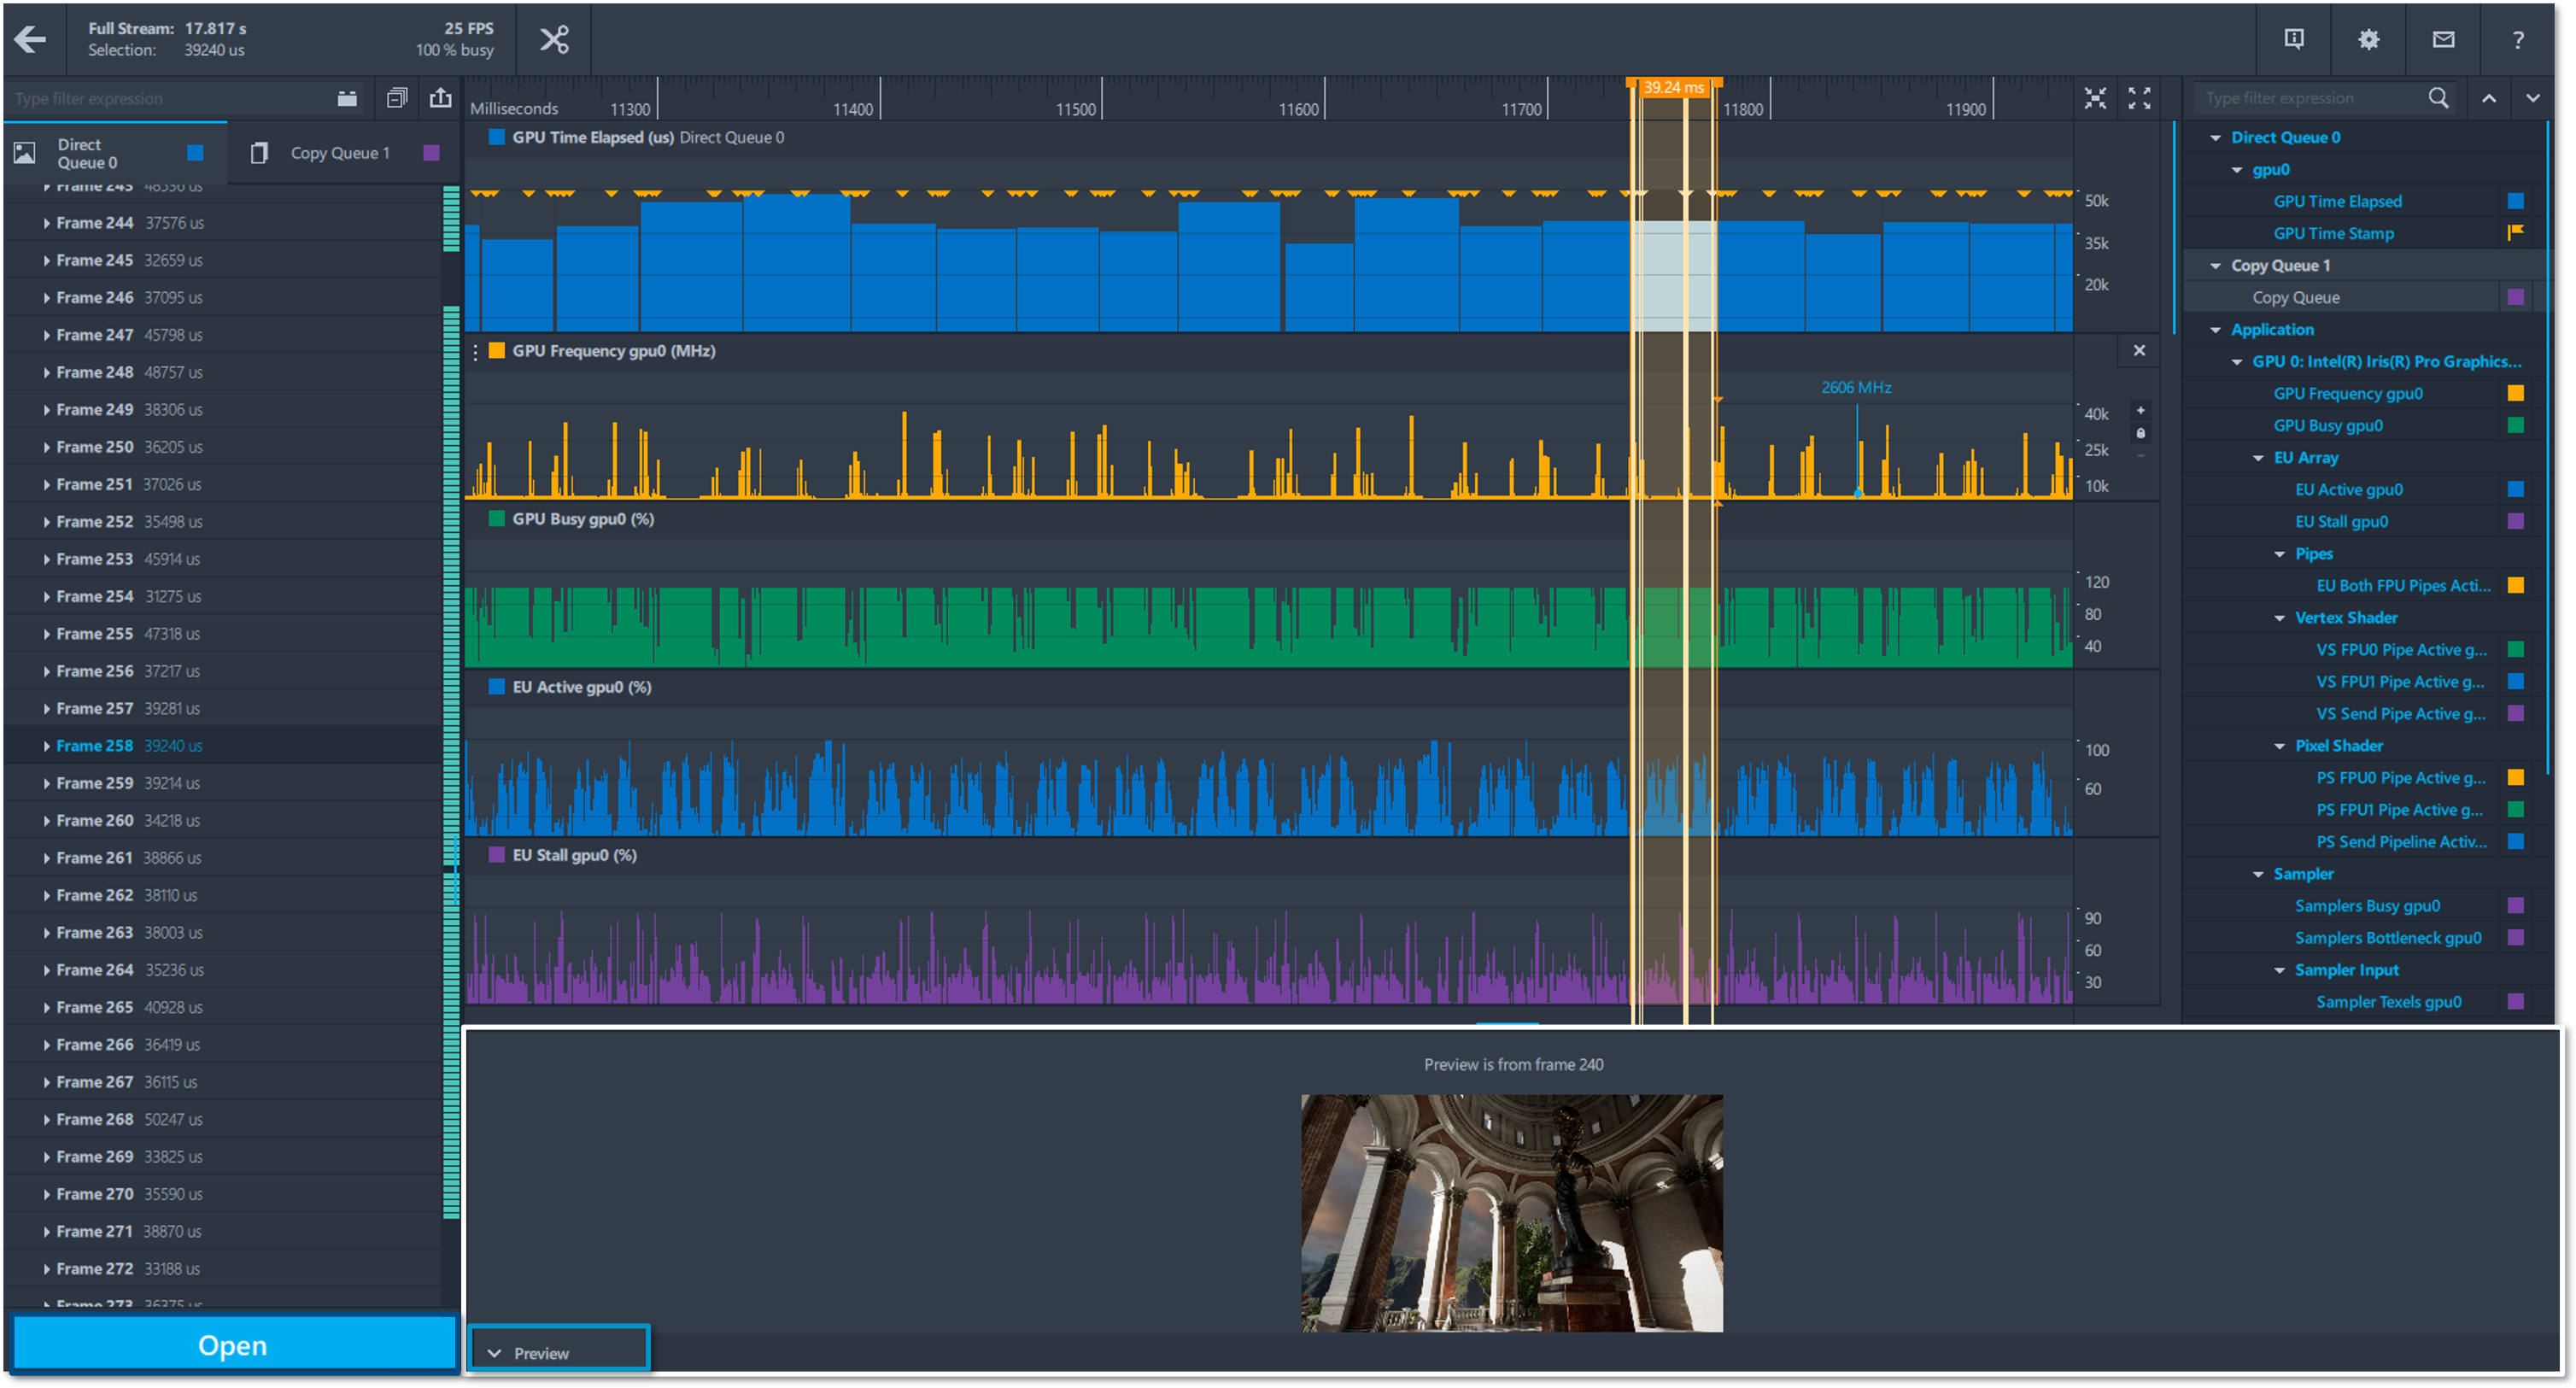
In the middle panel of the tool can you visualize each frame of your stream capture in the form of a bar graph based on the GPU time elapsed. You can also view metric data associated with each frame throughout the course of your stream capture. You can resize each track by clicking on the control boundary at the bottom of the track and then dragging it vertically until it is resized to your liking. You can reorganize your tracks by hovering over the track title, clicking on the triple dot button ⋮ that appears next to the track title and then moving it vertically until it’s rearranged to your liking.
To remove a track, hover over the track and press the X button on the top righthand side of that track. While hovering over a track you can scale the Y-axis of that track up or down by pressing the + or – buttons respectively. You can also enable or disable Y-axis auto scaling by pressing the lock 🔒 button in between the + and – buttons while hover over a specific track.
To zoom into portions of your stream capture you can press the Zoom to Selection button at the top right of the middle panel of the tool and to zoom all the way out you can press the Full Zoom Out button next to it.
To manually zoom in or out, hover your mouse over a desired position in the track then press and hold the CTRL button on your keyboard and then scroll up or down on your mouse wheel to either zoom in or out. To scroll through your capture, press the blue button at the bottom of the middle panel and horizontally drag that button left or right.
If you recorded screenshots throughout the duration of your stream capture you can view them by hovering over each frame in the GPU Time Elapsed track and a thumbnail will appear above the bar graph. To view a larger image of this thumbnail, select a frame and then press the Preview button at the bottom of the tool, then click the control boundary at the top of this panel to resize it, resizing the thumbnail additionally.
Right Panel
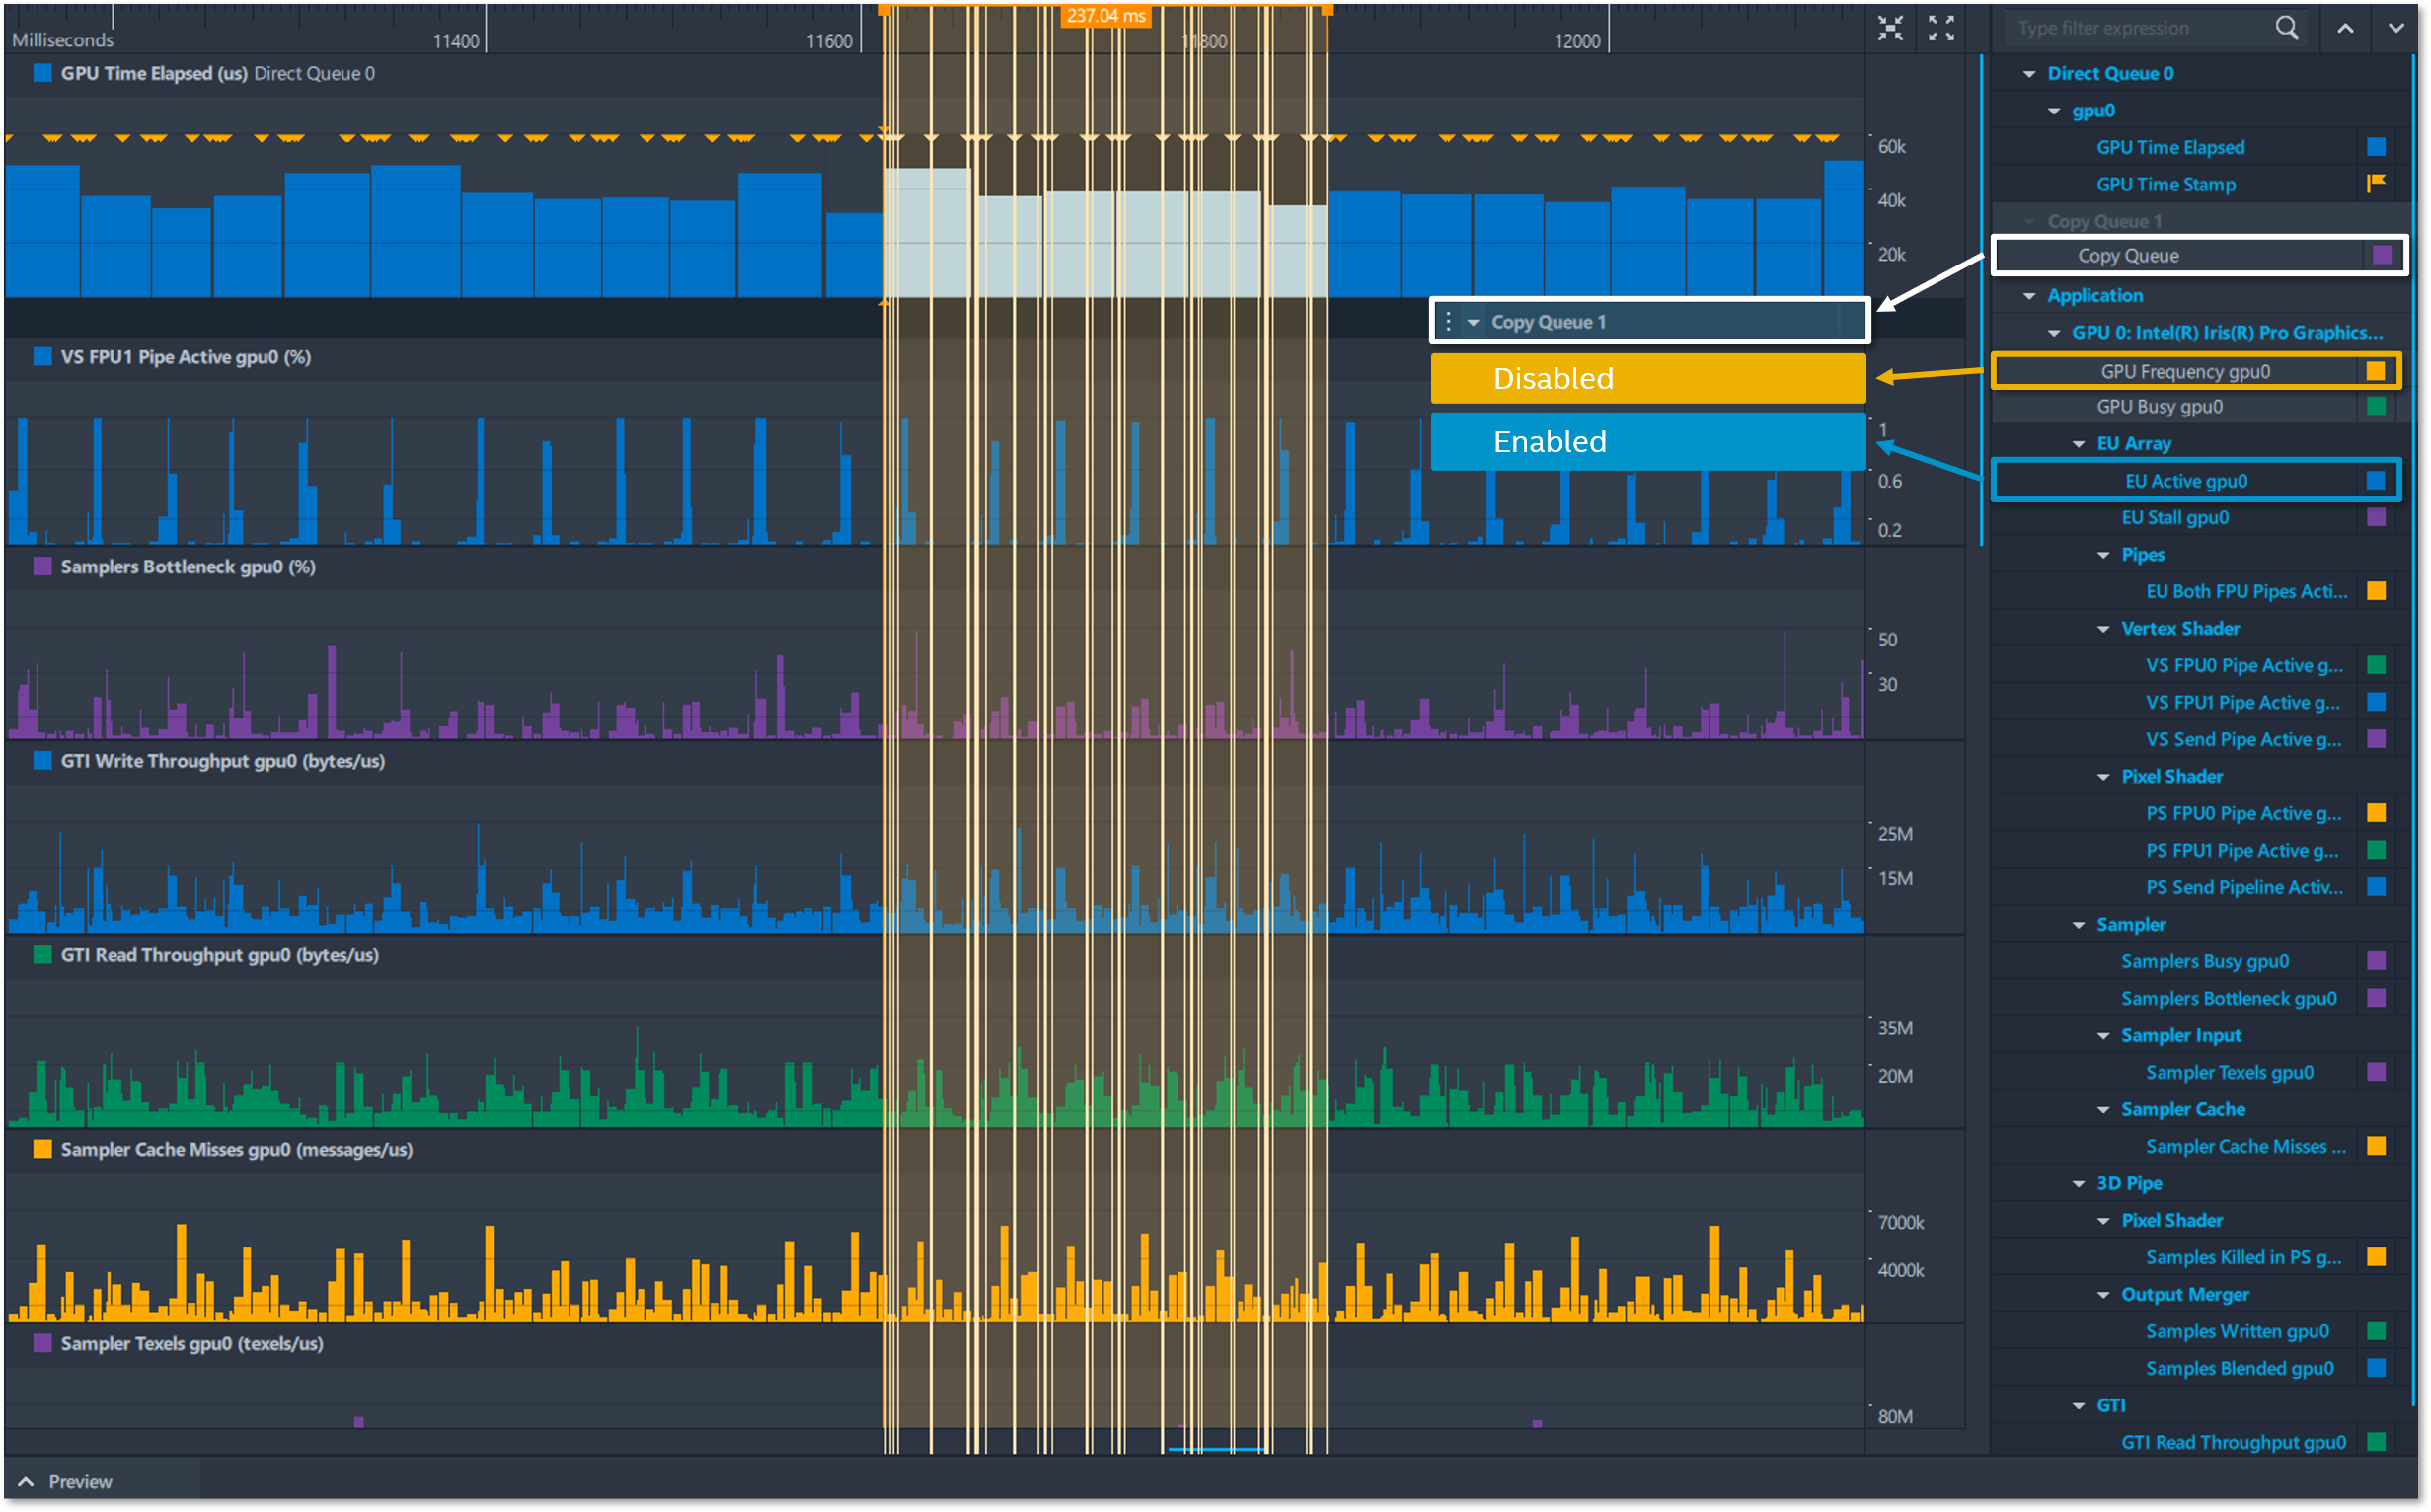
In the right panel in the multi-frame view of Graphics Frame Analyzer you can view the captured metrics associated with your stream capture file, which are dependent on your host systems hardware. You can filter your metrics by typing in the metrics name or parameter in the search bar at the top of this panel and only the metrics with your keyword in them will be displayed. To collapse all metric groups, click on the up arrow ▲ and to expand all metric groups click on the down arrow▼. You can toggle on and off visualization of these metrics by clicking on their names. Grey text indicates that visualization is disabled for that metric, and blue text indicates that visualization is enabled for that metric.
NOTE: Toggling off parent groups will disable visualization for all child metrics that follow it.
You can tailor the color of each of the metrics to best suit your use case by clicking on the colored square icon to the right of the metrics name and selecting a new color of that metric option which will then be visualized in the middle panel of the tool.
Selecting and Opening Frame(s)
Selecting a frame in the middle panel of the tool will also select a frame in the left panel. It’s also possible to select multiple frames for Vulkan and Microsoft* DirectX12 applications by default and for DirectX11 applications by clicking on the cogwheel ⚙️button to go into the settings of the tool then enabling the Multi-Frame Profiling View option. If multiple frames are selected, then the user will see multiple frame content in the single frame profiling view after opening. Once a frame is selected you can press the Open button at the bottom of the left panel to open that specific frame for single frame analysis in Graphics Frame Analyzer.
Conclusion
This article demonstrated how to open and explore a multi-frame stream file in the multi-frame view of Graphics Frame Analyzer while highlighting user interface features of the left, center, and right panels. For more information on how to identify and analyze problem areas in your applications to resolve GPU performance regressions continue reading the Graphics Frame Analyzer Deep Dive articles.
Additional Resources
Part 1: Configure and Capture Frames (Article)
Part 2: Configure and Capture Multiple Frames (Article)
Part 3: Open and Explore Multiple Frames (Video)
Part 4: Open and Explore a Single Frame (Article)
Part 5: Working with the Bar Chart and API Log (Article)
Part 6: Exploring the Metrics Viewer (Article)
Part 7: Inspecting a Draw Call (Article)