Optimize Hardware Usage with Platform Profiler Analysis
When you want to understand how well your software application leverages available hardware resources, use the Platform Profiler analysis type in Intel® VTune™ Profiler to optimize your hardware configuration.
This analysis type displays several metrics that you can use to improve hardware usage:
- High-level system configuration information: processor, memory, storage layout, PCIe* and network interfaces
- Performance metrics: CPU utilization, cycles per instruction (CPI), memory and disk input/output (I/O) utilization, memory and disk I/O throughput, power consumption, and more.
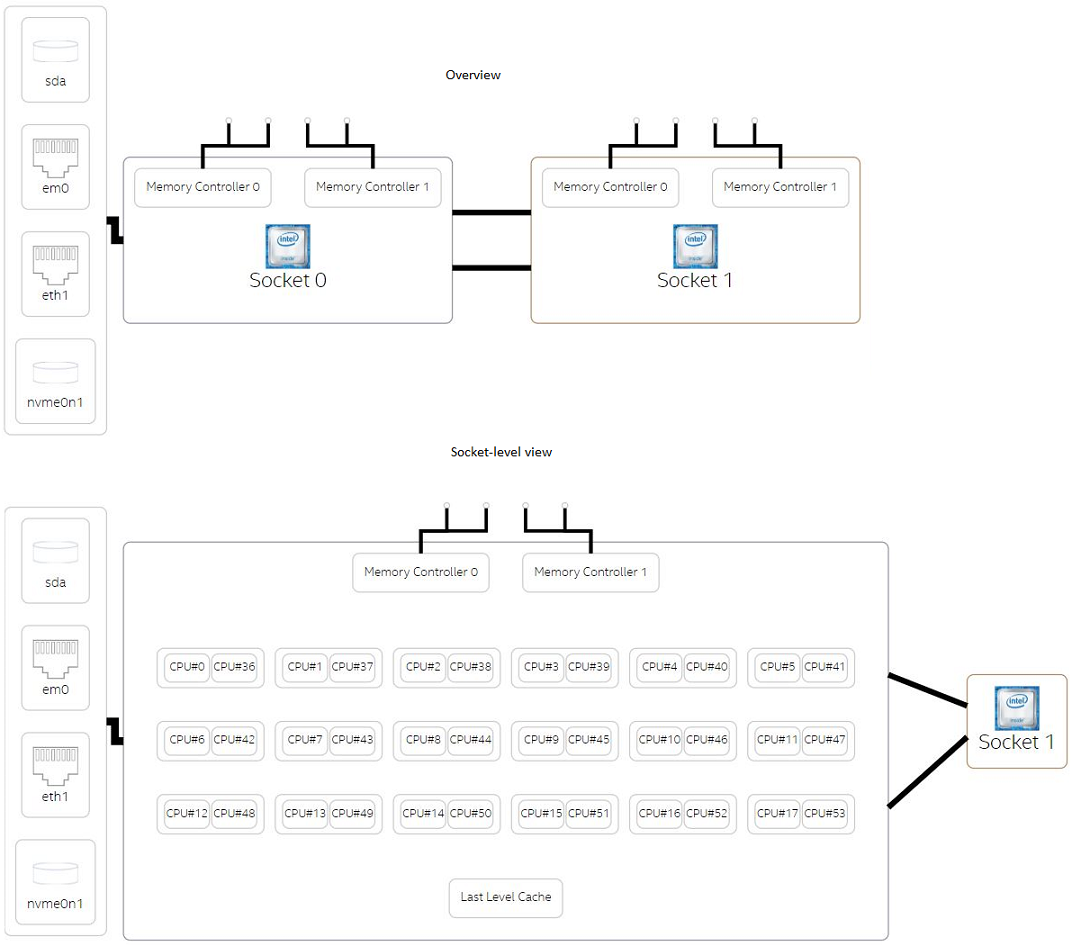
Figure 1. High-level system configuration view from Platform Profiler
Who Should Use Platform Profiler Analysis
You benefit from Platform Profiler analysis if:
-
You are a software developer and you want to understand the behavior of your workload. Use Platform Profiler analysis as a lightweight tool to triage and identify potential bottlenecks like CPU, memory, disk, and network devices.
-
You are a performance engineer and you want to analyze hardware behavior for long running workloads. Use Platform Profiler analysis to identify when your system exhibits low performance. Tune your hardware configuration based on analysis results
How Platform Profiler Analysis is Different
A unique feature of Platform Profiler is its ability to provide system-level performance data over long periods of execution. While other analysis types in VTune Profiler are better suited for smaller workloads and shorter runtimes (~few minutes), you can run Platform Profiler analysis for several hours.
Running Platform Profiler analysis does not prevent you from using your system for other purposes simultaneously. This analysis type runs in the background and you can stop data collection at any time to view results.
Run Platform Profiler Analysis
Get the Tool
Platform Profiler is available as an integrated analysis type in VTune Profiler (versions 2021.5.0 and newer).
Download VTune Profiler:
- As a standalone tool
- With the Intel® oneAPI Base Toolkit
- With the Intel® System Bring-Up Toolkit
Configure and Run the Analysis
Interpret Analysis Results
Let us look at an analysis results from a sample application. We use a movie recommendation system application from the Spark* Training GitHub* website.
The underlying platform uses
- A two-socket Haswell server (Intel® Xeon® CPU E5-2699 v3) with Intel® Hyper-Threading Technology enabled
- 72 logical cores
- 64 GB of memory
The server runs the Ubuntu* 14.04 operating system.
The code is run in Spark on a single node:
spark-submit --driver-memory 2g --class MovieLensALS --master local[4] movielens-als_2.10-0.1.jar movies movies/test.dat
When you run the command above, Spark runs in local mode with four threads specified with the --master local[4] option.
In local mode, there is only one driver, which acts as an executor. The executor spawns the threads to execute tasks. There are two arguments that you can change before launching the application - the driver memory (--driver-memory 2g) and the number of threads to run with (local[4]).
Our goal is to see how we stress the system by changing these arguments. We also want to use data from Platform Profiler analysis to identify patterns during execution, if any.
Here are four test cases along with their corresponding runtimes:
-
spark-submit --driver-memory 2g --class MovieLensALS --master local[4] movielens-als_2.10-0.1.jar movies movies/test.dat (16 minutes 11 seconds) -
spark-submit --driver-memory 2g --class MovieLensALS --master local[36] movielens-als_2.10-0.1.jar movies movies/test.dat (11 minutes 35 seconds) -
spark-submit --driver-memory 8g --class MovieLensALS --master local[36] movielens-als_2.10-0.1.jar movies movies/test.dat (7 minutes 40 seconds) -
spark-submit --driver-memory 16g --class MovieLensALS --master local[36] movielens-als_2.10-0.1.jar movies movies/test.dat (8 minutes 14 seconds)
Figures 2 and 3 show the observed CPU metrics during the first and second tests, respectively.
Figure 2 shows that the CPU is underutilized. We can add more work if the rest of the system is underutilized as well. The CPU frequency often slows down. This behavior tells us that the CPU is not a performance limiter.
Figure 3 shows that the test uses the CPU more due to an increase in number of threads, but there is still significant headroom. Moreover, by increasing the number of threads we also decrease the CPI rate. We see this in the CPI chart of Figure 3.
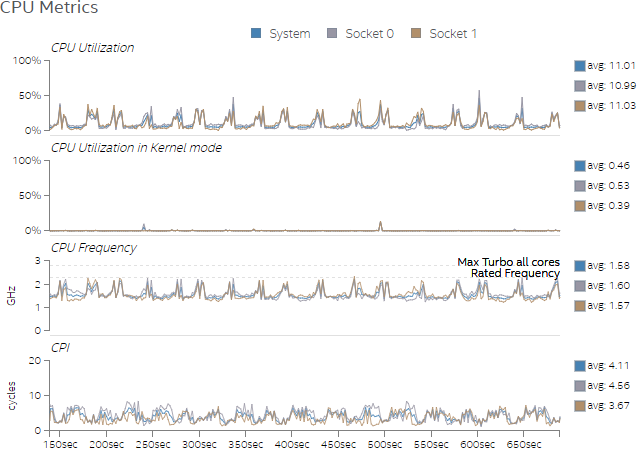
Figure 2. Overview of CPU usage in Test 1.
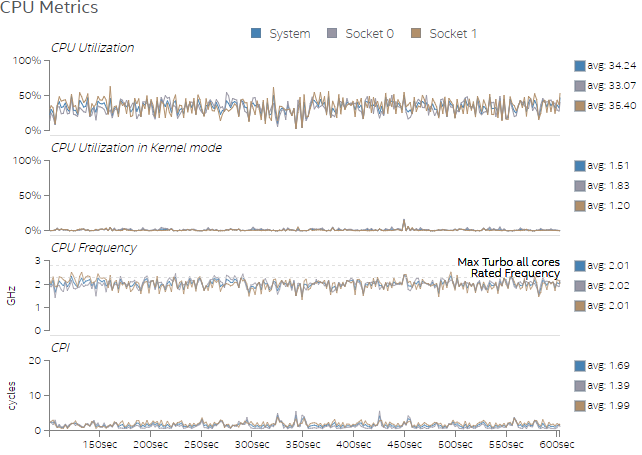
Figure 3. Overview of CPU usage in Test 2.
The increase in number of threads also increases the number of memory accesses, when we compare Figures 4 and 5. This is expected behavior and the profiled data verifies it.
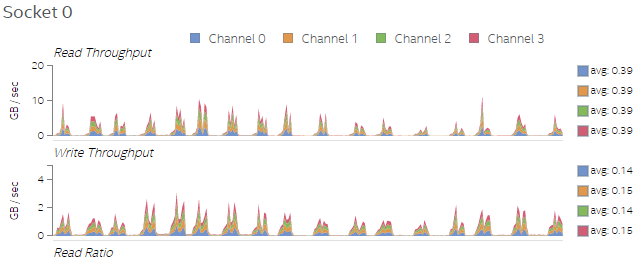
Figure 4. Memory read/write throughput on Socket 0 for Test 1.
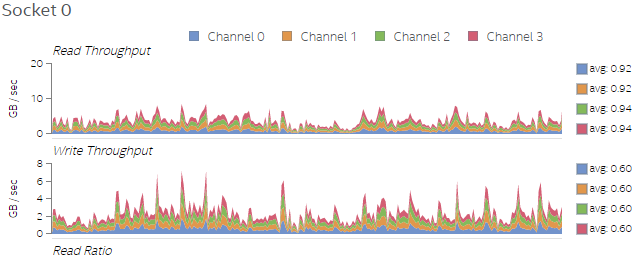
Figure 5. Memory read/write throughput on Socket 0 for Test 2.
Figures 6 and 7 show L1 and L2 miss rates per instructions for Tests 1 and 2, respectively. Increasing the number of threads in Test 2 drastically decreases L1 and L2 miss rates, as shown in Figure 7.
We find that the application incurs less CPI rate and less L1 and L2 miss rates when we run the code with more threads. This observation informs us that once data is loaded from the memory to the CPU caches, there is sufficient data reuse, which benefits the overall performance.
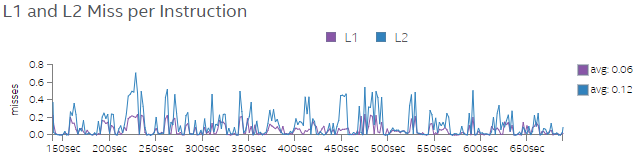
Figure 6. L1 and L2 miss rate per instruction for Test 1.
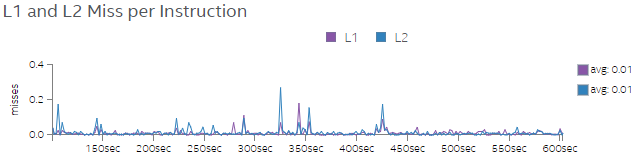
Figure 7. L1 and L2 miss rate per instruction for Test 2.
Figure 8 shows the memory usage chart for Test 3. We can observe similar memory usage patterns for all other tests as well. The memory used is between 15-25%, whereas cached memory is between 45-60%. Spark caches its intermediate results in the memory to process later. Hence, we see high utilization of cached memory.
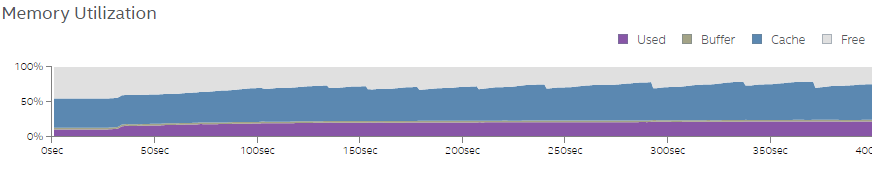
Figure 8. Memory utilization overview for Test 3.
Finally, Figures 9-12 show the disk utilization overview for all four test runs. As the amount of work increases across the four test runs, the number of I/O operations per second (IOPS) and the write latency increase as well. We can also see an increase in Queue Depth, which indicates that the disk write queue is saturated. We can potentially improve the workload performance by replacing the sda disk with a Solid State Drive (SSD) that supports the increase in IOPS. If we cannot replace the disk, adding more threads could help tolerate the access latencies.
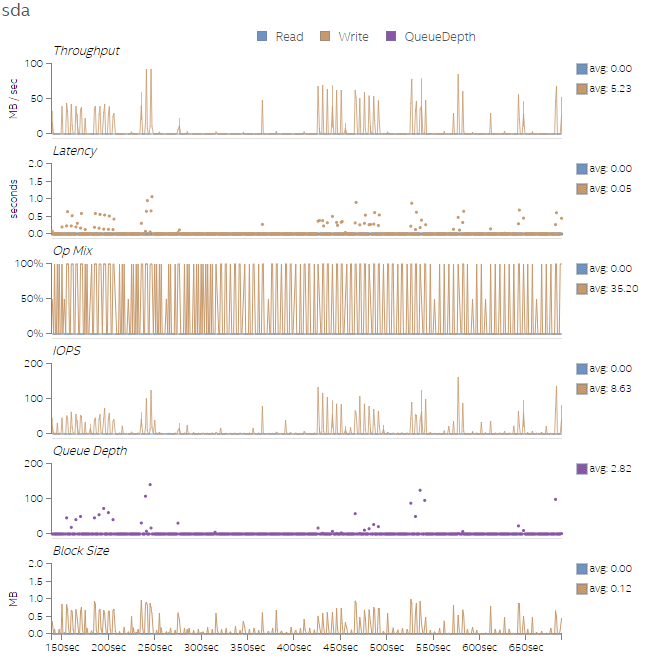
Figure 9. Disk utilization overview for Test 1.
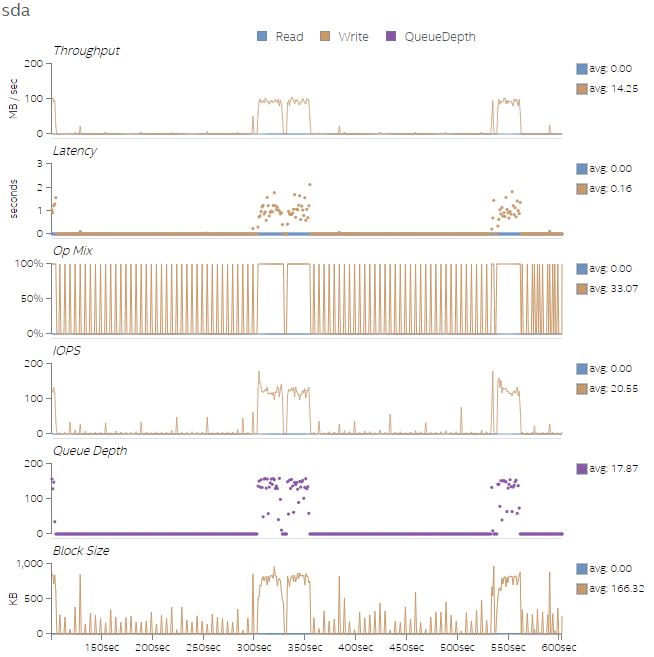
Figure 10. Disk utilization overview for Test 2.
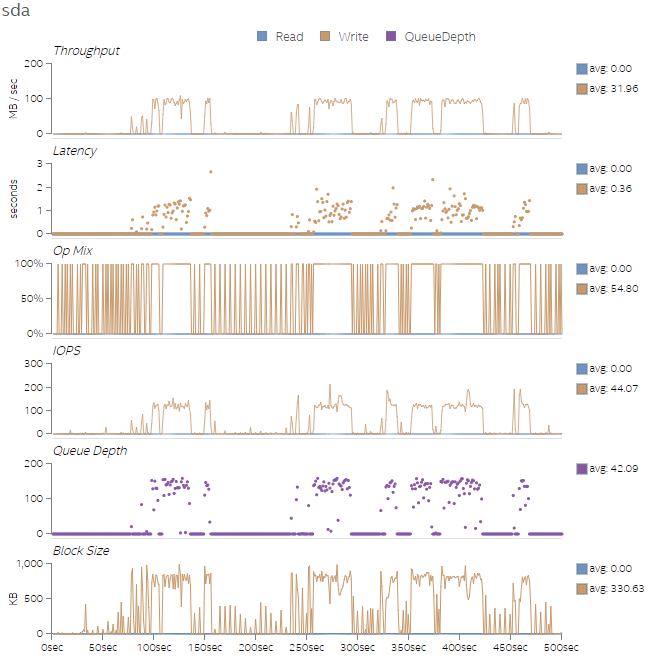
Figure 11. Disk utilization overview for Test 3.
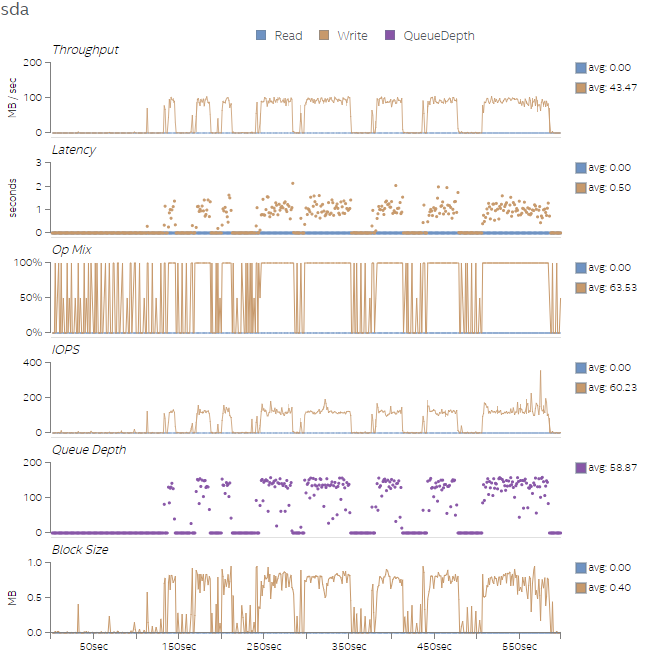
Figure 12. Disk utilization overview for Test 4.
Summary
This example demonstrates how data from Platform Profiler analysis can help us understand execution behavior of a sample application. We can also see how certain performance metrics change as a result of using different number of threads and memory settings.
What's Next
Our analysis revealed that a lot of disk write operations happened during the execution of the workload, since Spark applications are designed to run in memory. To further investigate the code, a good recommendation is to run the Input and Output analysis (Linux OS only) in VTune Profiler next. This analysis type can help us uncover details about disk I/O performance.