Introduction
Intel® Advisor helps achieve maximum performance for modern Intel processors, coprocessors, and compatibles. Intel Advisor incorporates two tools: Vectorization Advisor to help realize maximum potential of SIMD capabilities of each core of the processor, and Threading Advisor to help maximize usage of all the cores of the processor.
This article focuses on the Vectorization Advisor tool that supports analysis of both scalar and vectorized codes generated by Intel, Microsoft, or GNU compilers. While usage of the latest Intel® Compiler is highly recommended to extract the best possible vectorization-related advices using the tool, applications built with GNU and Microsoft compilers can also benefit from the information gathered.
This article further focuses on how to use Vectorization Advisor for optimizing the applications built using Microsoft compiler, and highlights major supported features of the tool. Where applicable, the article will compare and contrast against features and advice available only when using Intel compiler. For complete details on all the features and how to interpret the gathered data, please refer to the documentation.
While we use a Windows* based application here as an example, the process and principles remain the same for Linux* based applications using GNU compilers.
We will be using a simple application that calculates stock option pricing using the Black Scholes formula. The purpose of using this compute intensive sample application is to demonstrate how Intel Advisor can be useful in optimizing for SIMD (single instruction multiple data) opportunities. Please note that the sample application code is derived from the code published by Bernt Arne Odegaard.
Environment details: Intel Core i5-6440HQ CPU, Windows 10 64-bit, Intel Advisor 2018, Visual Studio 2017.
Application project details: C++, Win32 console application, solution platform = x64, solution configuration = Release.
We will be following the Vectorization Workflow and use the Vectorization Workflow tab of the tool:
1. Prepare the application in release mode
cl /O2 /Zi /DEBUG /GL- /EHsc *.cpp /Fe:BlackScholes-CL-O2-AVX2.exe
2. Launch Intel Advisor
We will be using the Intel Advisor in a standalone fashion for this article but the exact same features are available for use from within the Visual Studio IDE by clicking on the Intel Advisor icon or by right-clicking the project and selecting "Intel Advisor -> Start Survey Analysis."
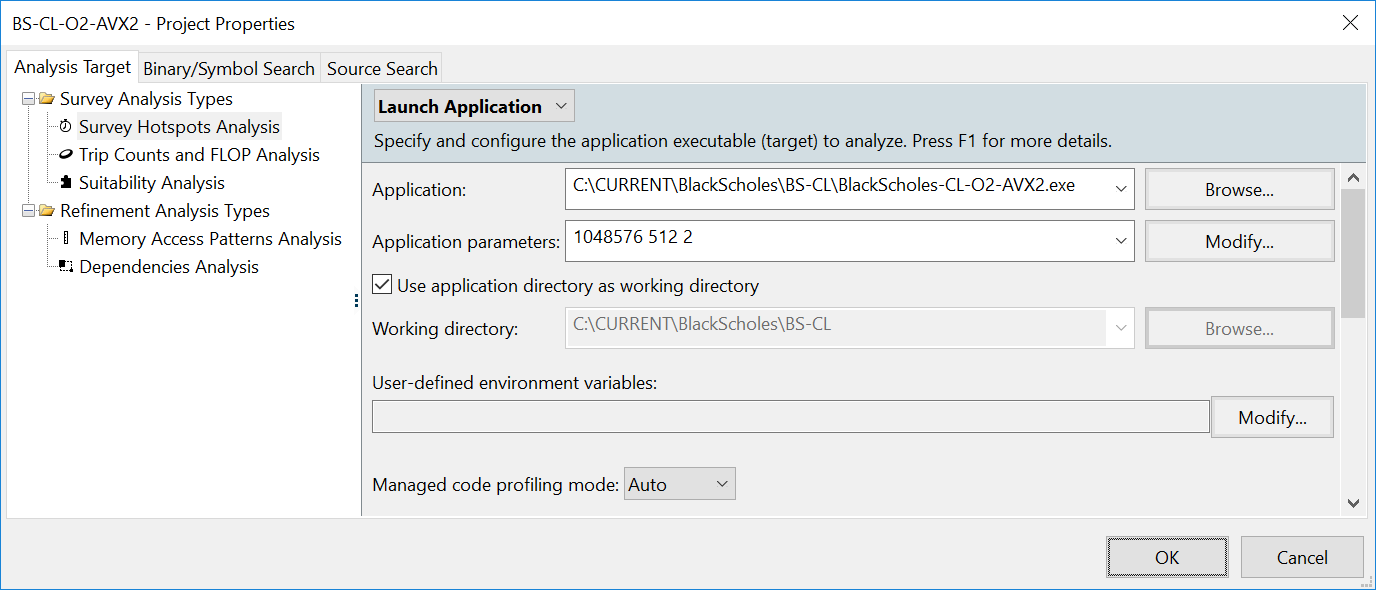
3. Prepare Intel Advisor project
Create a project => BS-CL-O2-AVX2
Application => BlackScholes-CL-O2-AVX2.exe
Application parameters => 1048576 512 2
4. Run Survey Target Analysis
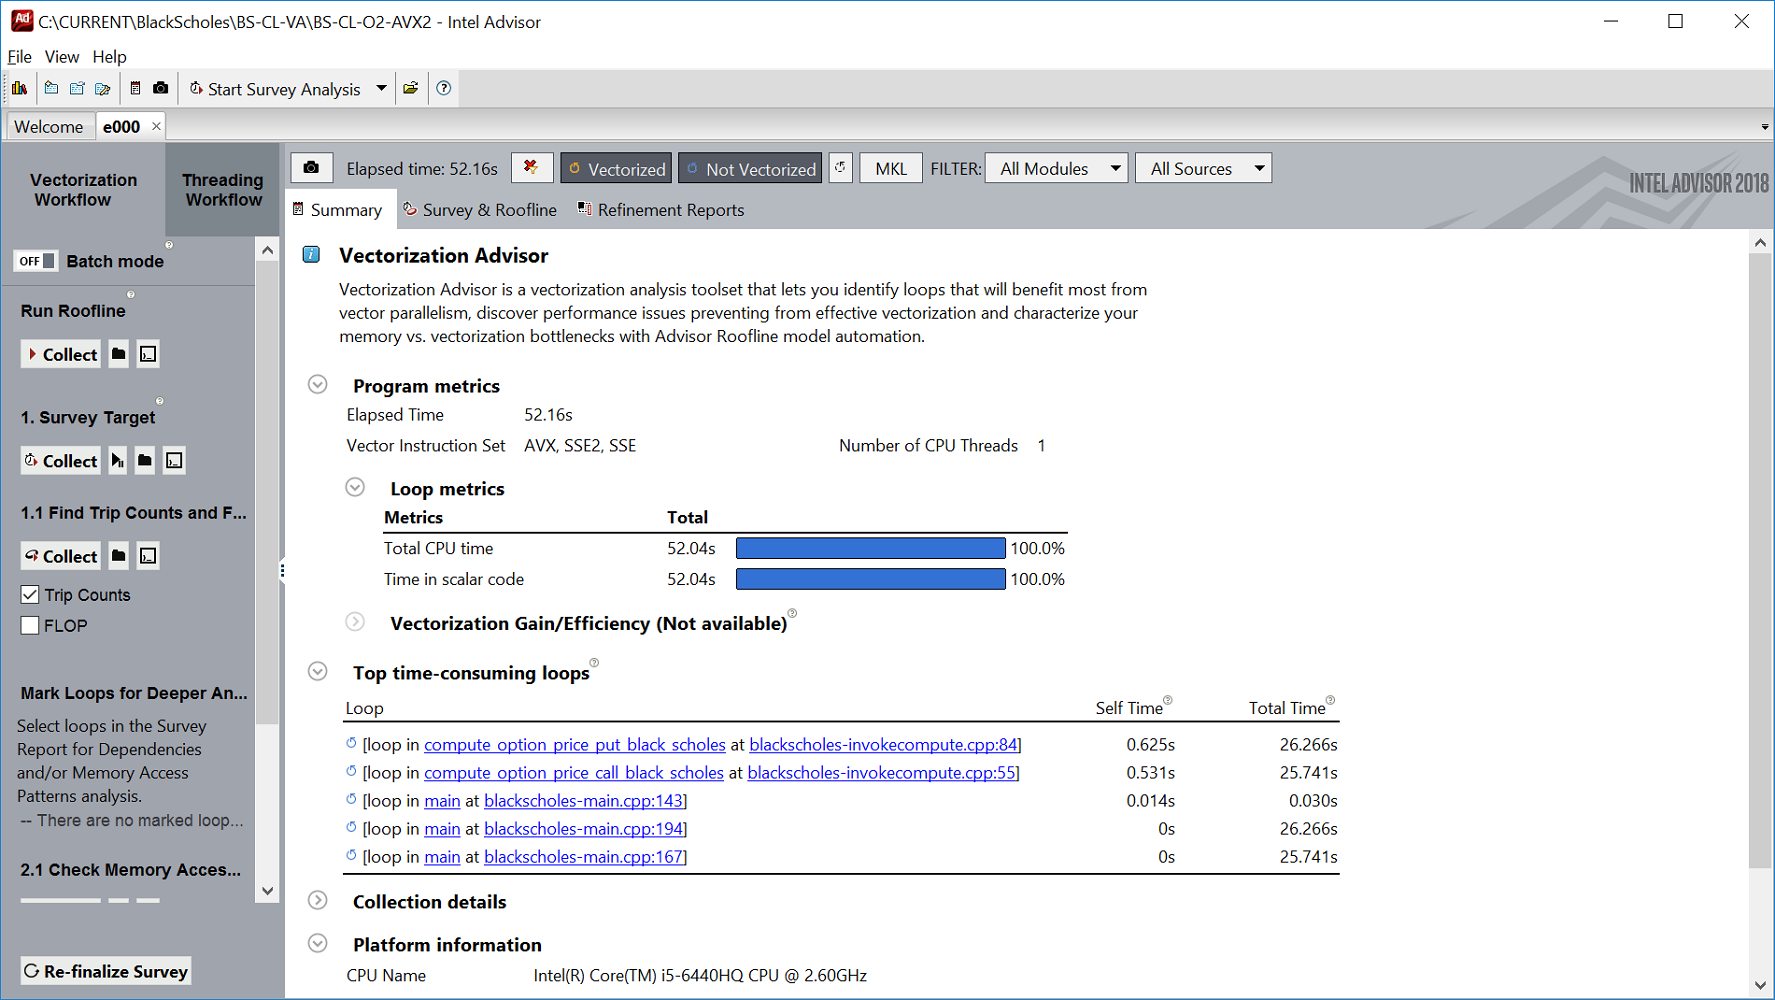
Summary tab highlights:
Program metrics reports valuable high-level information about the application run, such as that the vector instruction set used by the application was SSE2 (more on this topic later). GFLOP count, GFLOPS, and Arithmetic Intensity are also made available, which will help in the next step of Roofline Analysis mentioned below. Program metrics -> Loop metrics suggests that almost all of the execution/CPU time was spent in running the scalar code. Note that the Vectorization Gain/Efficiency information is unavailable because Intel compiler is not used.
Survey & Roofline tab highlights:
The first important advice the tool gives is to use Intel compiler. However, we will skip this advice for the purpose of this article, and continue using Microsoft compiler. The rest of the advice is take care of already as we built the application using /Zi, /DEBUG, and /O2.

5. Run Trip Count and FLOPS Analysis:
GFLOPS and Arithmetic Intensity for functions is available now.
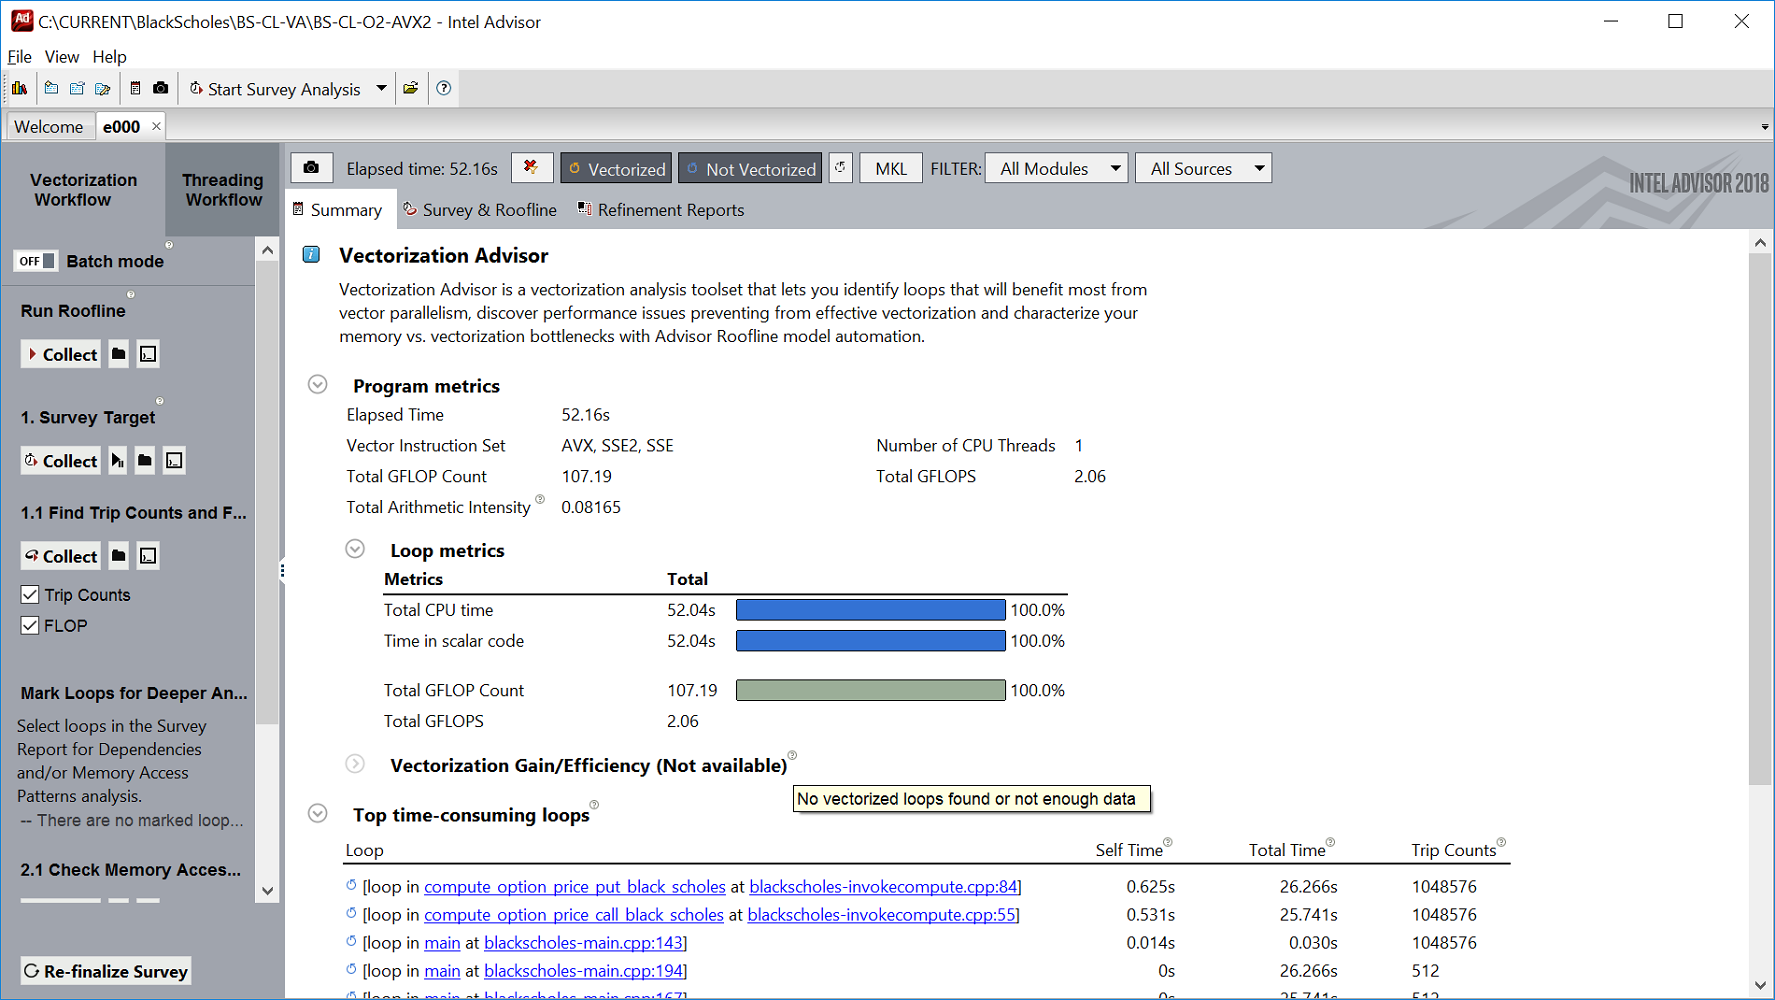
Trip counts for loops and call counts for functions are also available now.

Note that Advisor performs both static and dynamic analysis of the binary to uncover many different information. Using static binary analysis, even for non-Intel compiler built application, Instruction set architecture (ISA), Vector length (VL) for the SIMD instructions, traits such as scatter/gather/inserts/divisons, etc. are detected and reported by Advisor. Using dynamic binary analysis, Advisor further reports timings, FLOPS, and trip-counts. All these metrics are reported even when application is not built using Intel compiler.
If Intel compiler is used to build the application, additional details and advice may be available. Vectorization efficiency and details on peel/remainder loops are also made available. Here is the screenshot of how this application would get recommendations from Advisor when it is built with Intel compiler:

When Intel compiler is used to build application, "Why no vectorization" column will now report reason for lack of vectorization for scalar loops. For example, here the loop is not vectorized because there is a user-function present in the loop that is not inlined. "Performance issues" points out vectorization related performance issues. Both columns have clickable link that elaborates on the issue with recommendation(s) as seen in the bottom pane.
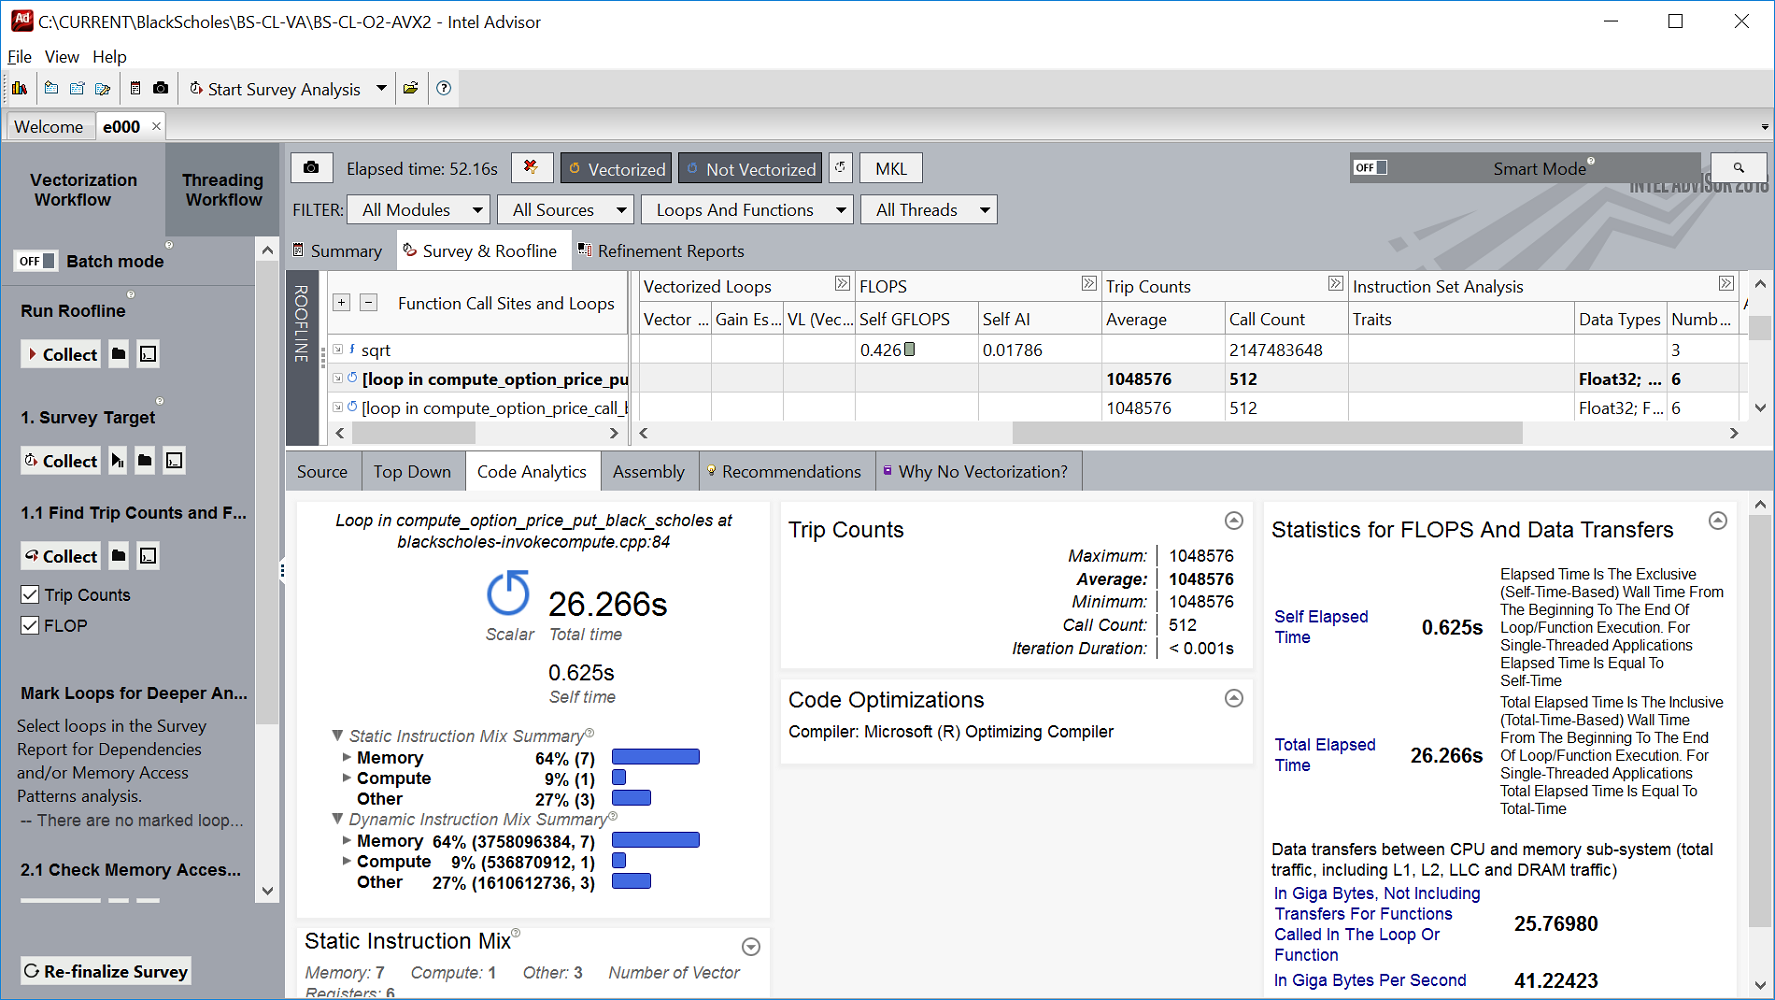
6. Investigate loops/functions
Code Analytics for a selected loop can be viewed by clicking the "Code Analytics" tab to know more details such as the static and dynamic instruction mix, statistics about the FLOPS and data transfers, etc.:
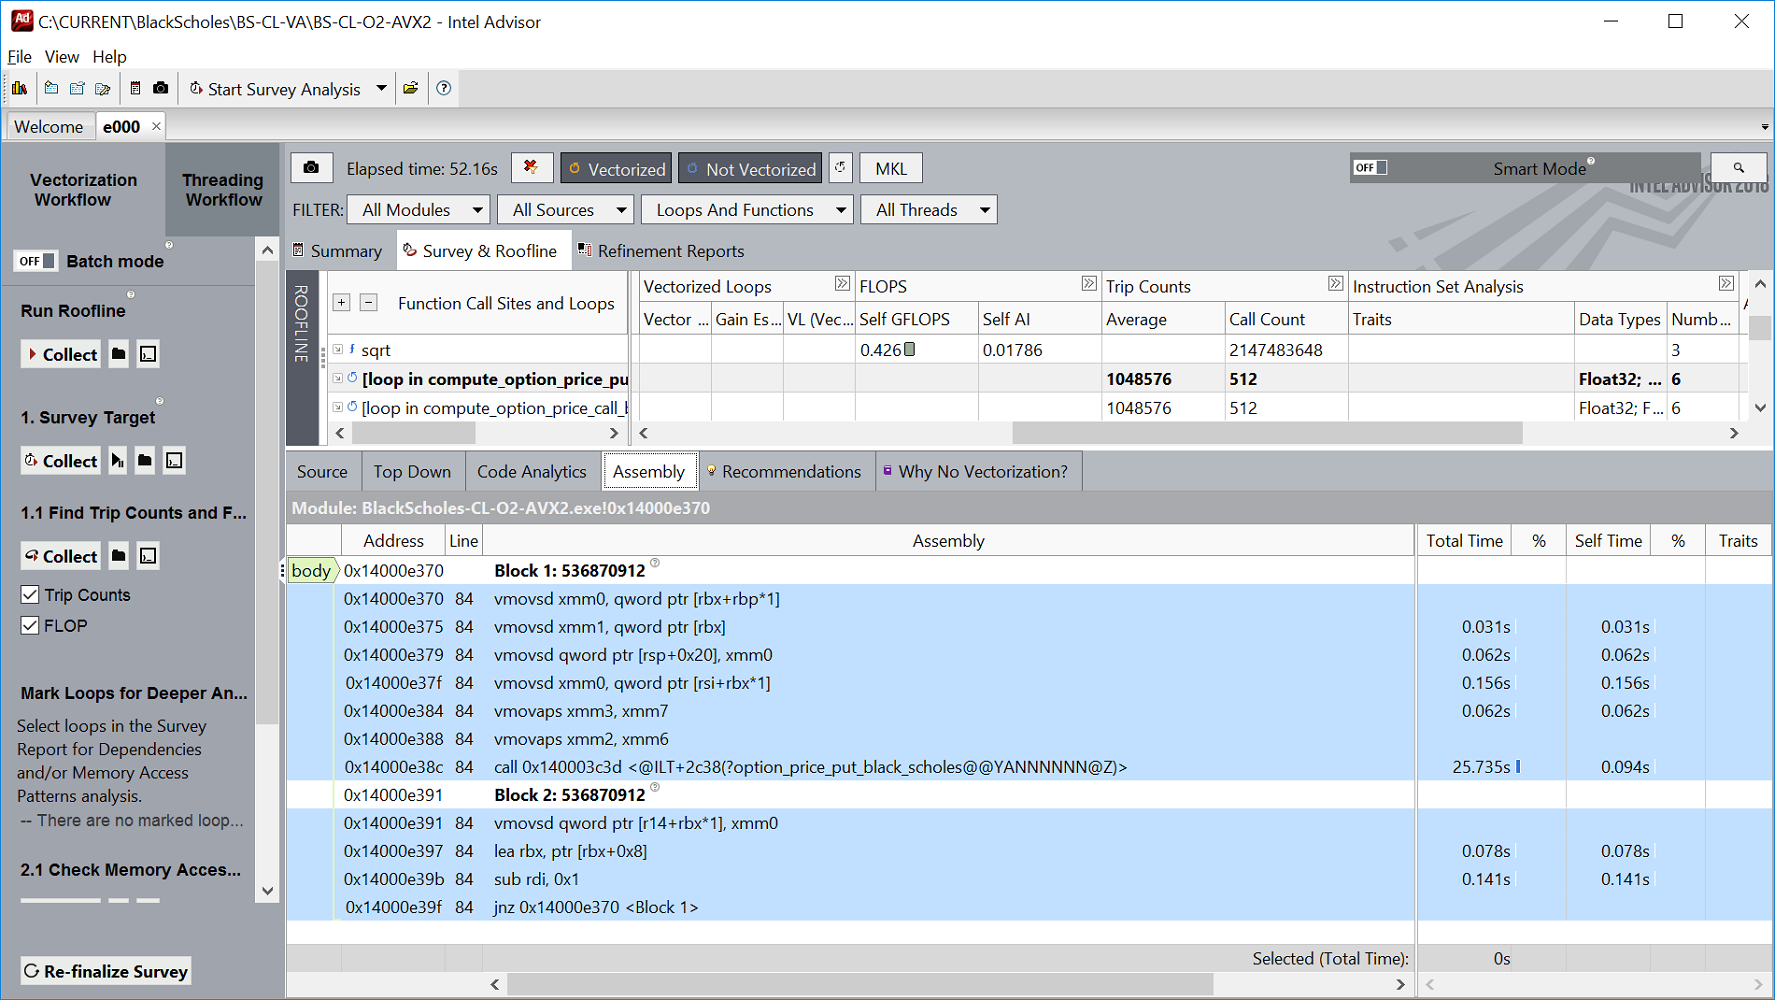
Assembly view for a selected loop (or function) can be viewed by clicking the "Assembly" tab:
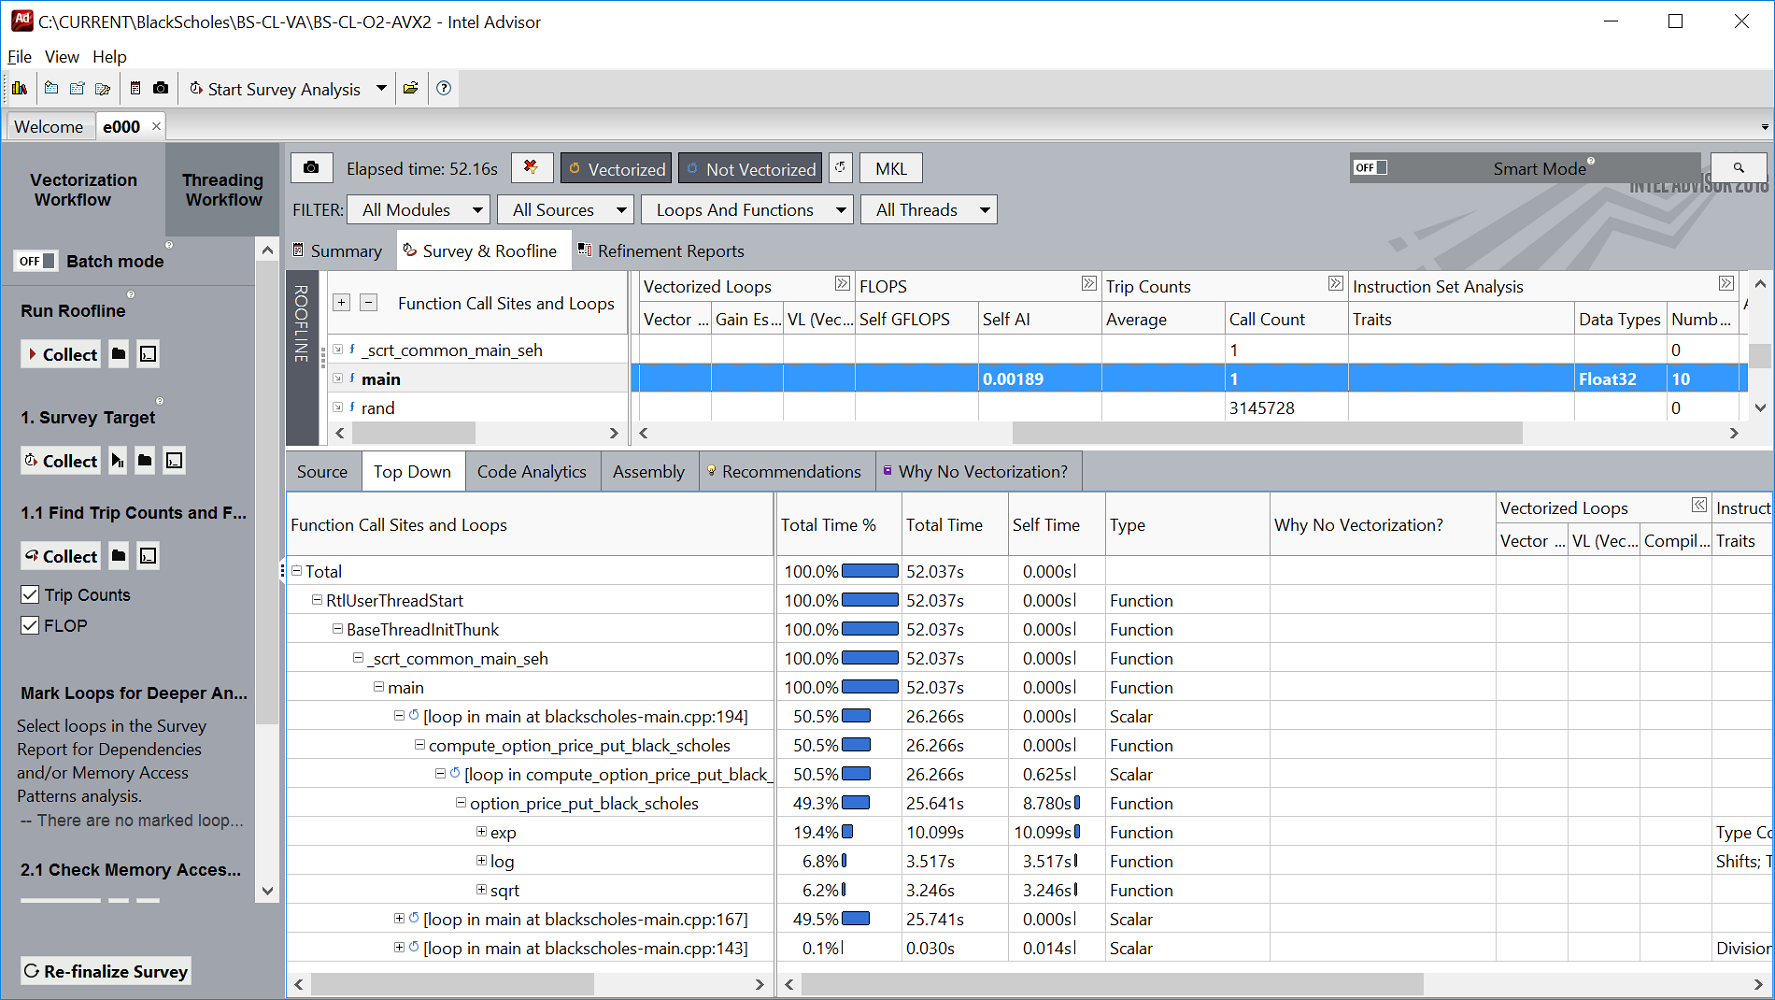
Top Down view for a selected loop (or function) can be viewed by clicking the "Top Down" tab for getting idea on caller/callee flow with self and total timings details:
Roofline chart is also available to help visualize actual performance against the hardware-imposed performance ceilings (rooflines) such as memory bandwidth and compute capacity:

8. Mark loops for deeper analysis
Since deep analysis can take much longer time to complete, it is important to choose a small representative dataset to cut down on runtime by reducing workload: Refinement Analysis => Dependencies and MAP analysis => Application parameters => 1048576 1 2 Instead of calculating options for 512 iterations, just one iteration is sufficient enough for these two analysis.
9. Check Dependencies Analysis
Advisor's Dependencies tool watches for its memory access operations during application execution and predicts possible data sharing problems:

10. Check Memory Access Patterns (MAP) Analysis
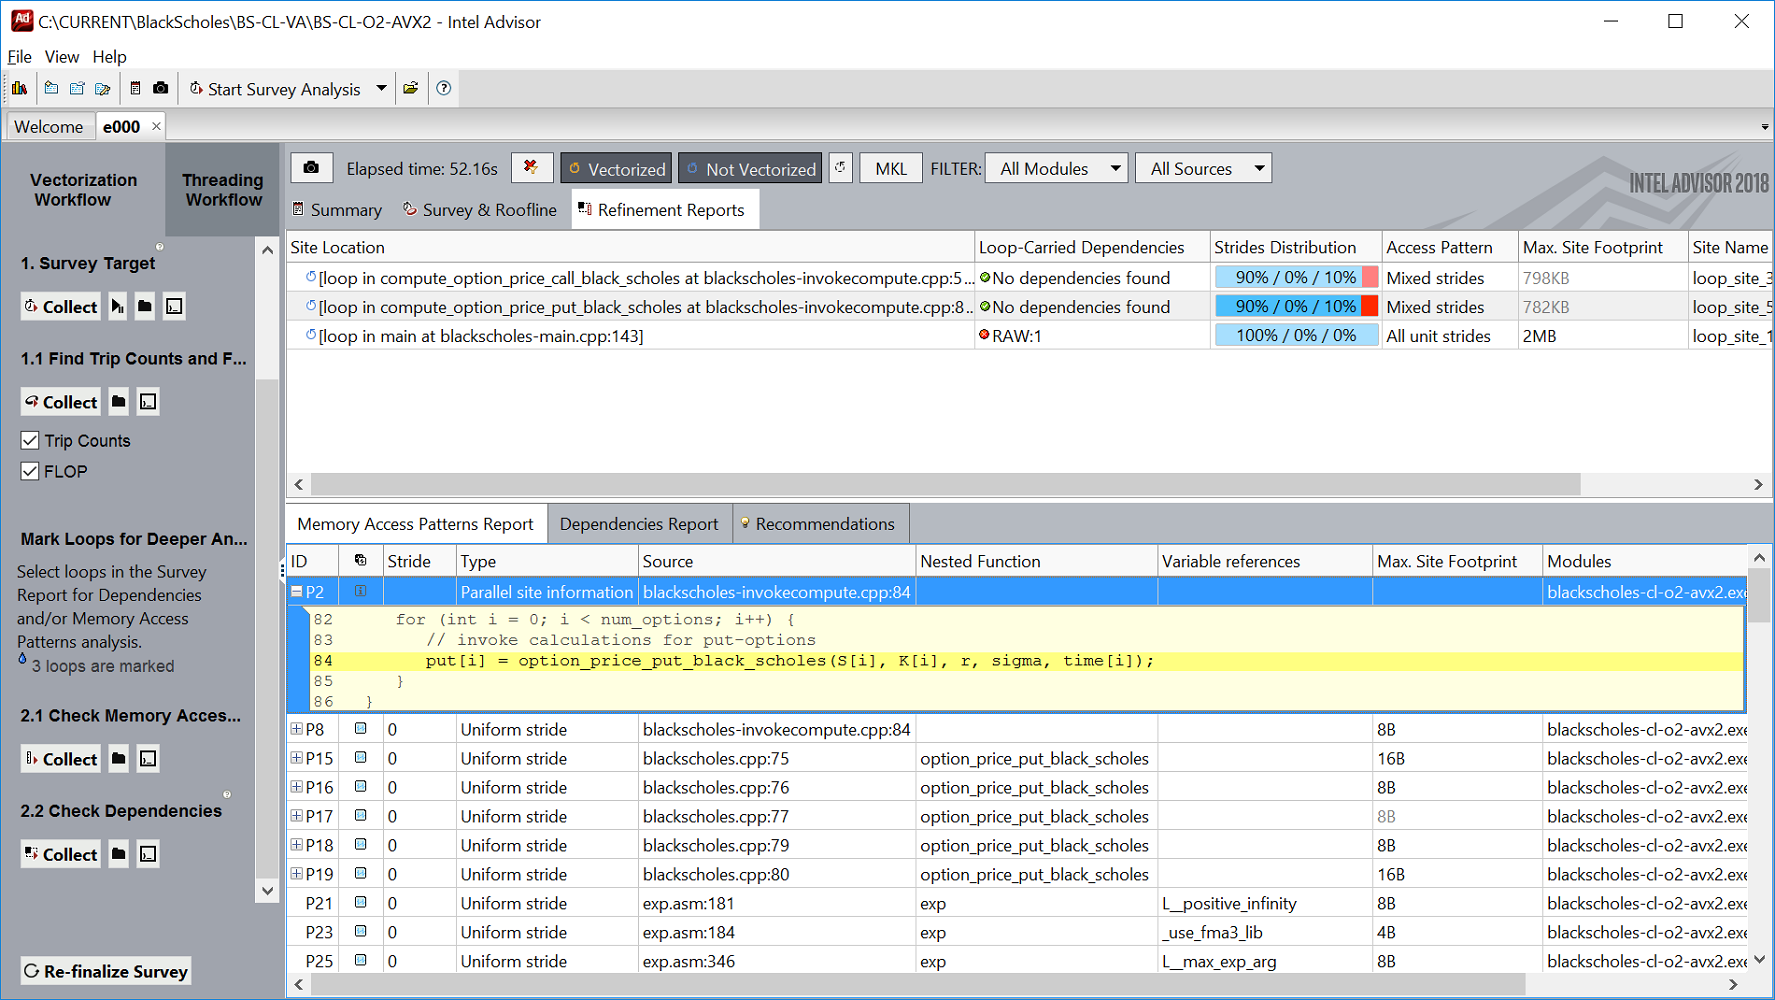
Advisor's MAP tool observes data accesses during application's execution, spots the tasks that contain memory accesses, and the collected/analyzed data appears in the "Memory Access Pattern Report" tab of the "Refinement Reports" window:
11. Improve application performance by making necessary optimizations based on recommendations so far.
12. Rerun relevant analysis and verify performance gained as a result of the optimizations made.
Conclusion
As mentioned at the beginning of the article, Intel Advisor can be most useful when it has all possible advice available: when the target application is built using the Intel compiler. However, a wealth of information metrics can be obtained even for the binaries built using Microsoft or GNU compilers. Here is a quick comparison of feature/metrics availability for different compilers used to build application binaries:
| Advisor features/metrics | MSVC / GCC | Intel Compiler |
|---|---|---|
| Survey ISA analysis: VL, traits, ISA, etc. | X | X |
| Trip counts / call counts | X | X |
| FLOPS | X | X |
| MAP | X | X |
| Dependencies | X | X |
| Roofline | X | X |
| Some recommendations | X | X |
| Why no vectorization? | X | |
| Full set of recommendations | X |