Overview
Run time-series data collection, storage, and visualization pipeline with Edge Insights for Industrial (EII), Telegraf*, TDengine, and Grafana*.
Follow the steps in Get Started to run the use case.
- Time to Complete: 20 minutes
- Programming Language: SQL*
Target System Requirements
Minimum System Requirements:
- 6th generation and up Intel® Core™ processors.
- 6th generation and up Intel® Xeon® processors.
- At least 4 GB RAM.
- At least 20 GB hard drive.
- An Internet connection.
- Ubuntu* 18.04 / Ubuntu 20.04
How It Works
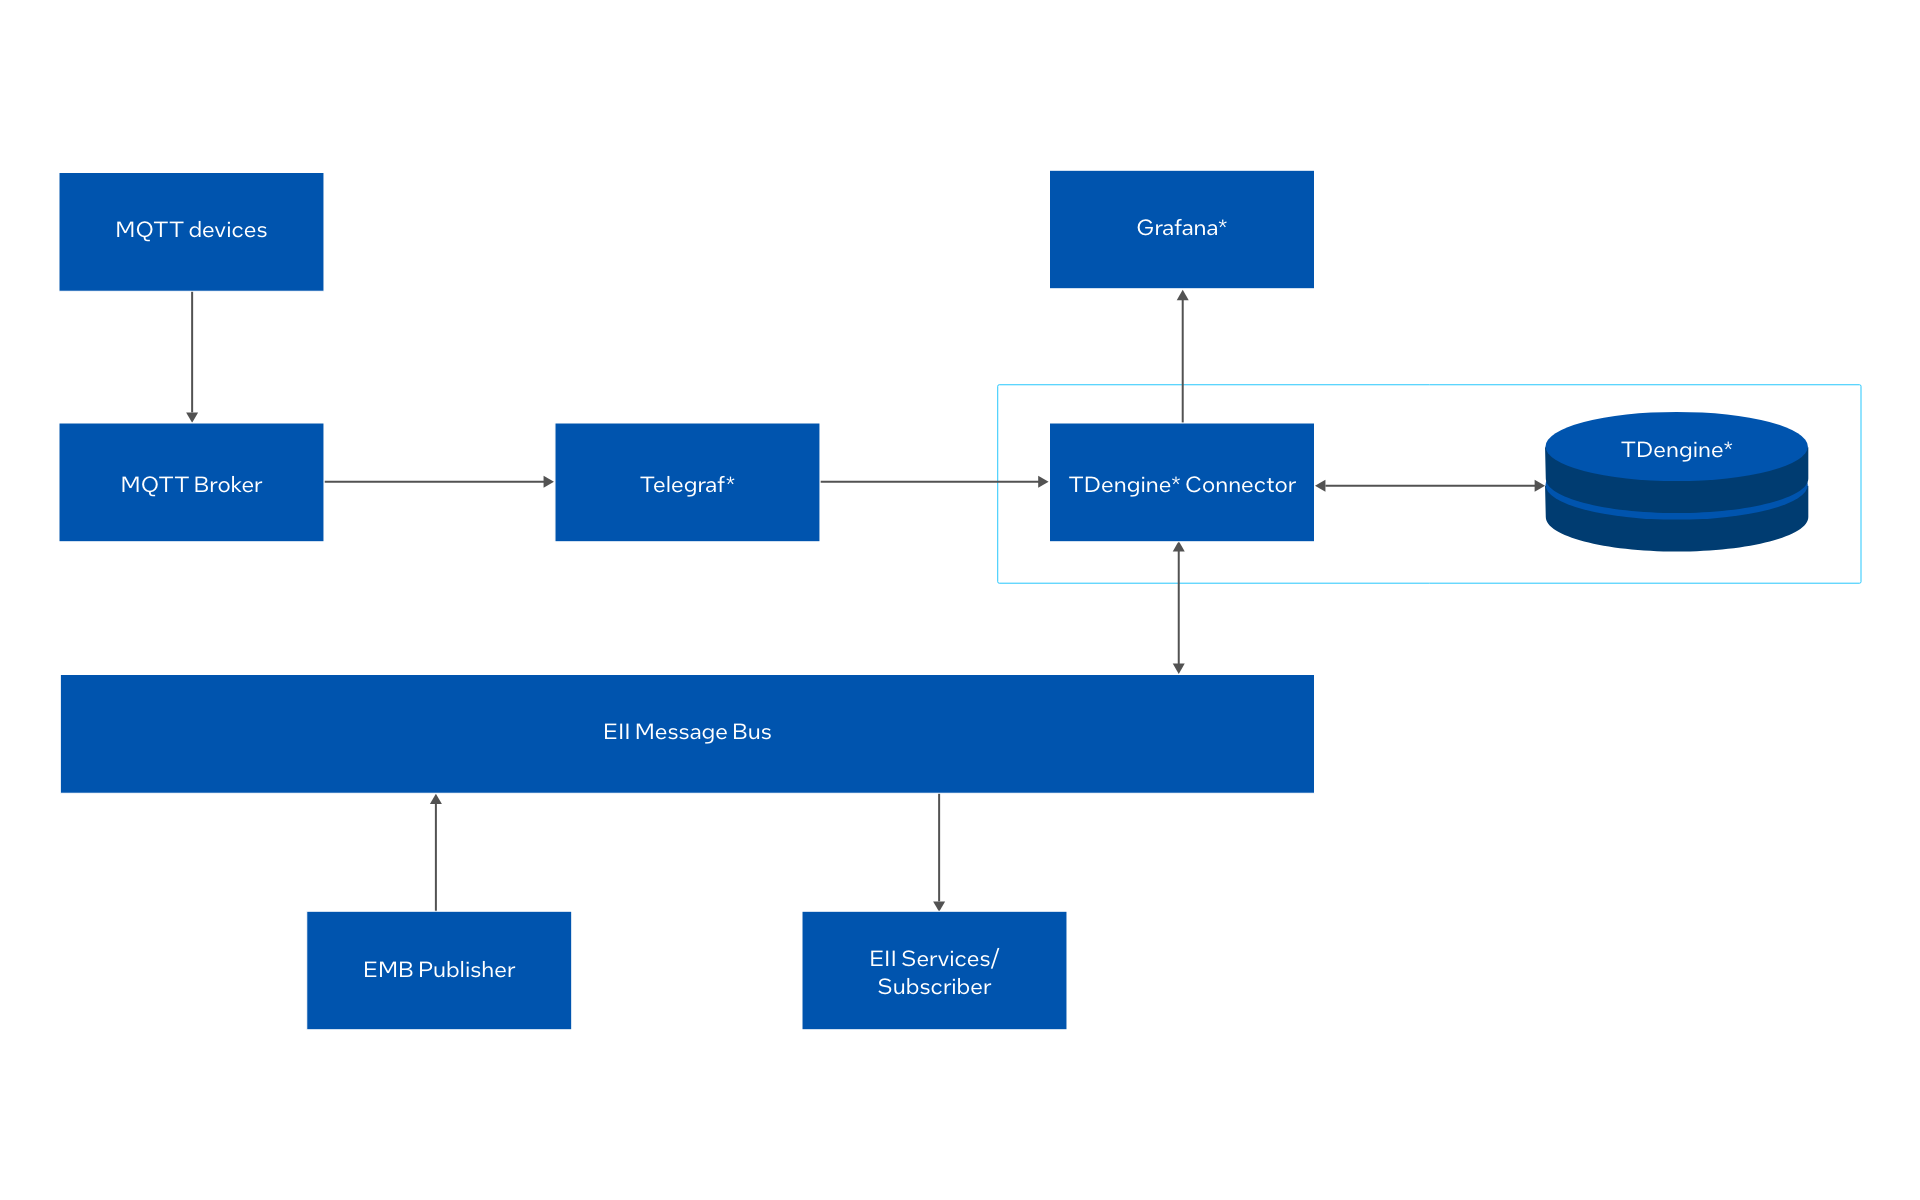
Run time-series data collection, storage, and visualization pipeline with Edge Insights for Industrial.
Collect data from MQTT compatible devices through Telegraf, store it in TDengine, and visualize it with Grafana.
TDengine is an open-source big data platform designed and optimized for Internet of Things (IoT), Connected Vehicles, and Industrial IoT.
Get Started
Step 1: Download Docker* Compose Files and Configuration Files from eii-tdengine-connector Repo
Step 2: Run EII Provision
cd eii-tdengine-connector/eii-stack/provision
sudo -E ./provision.sh ../docker-compose.yml
Step 3: Download Containers
cd eii-tdengine-connector/eii-stack
docker-compose pull
Step 4: Start Containers
Run the following command:
docker-compose up -d
Use docker-compose ps command to check if all containers were created properly.
docker-compose ps
The following 6 containers should be ready:
- emb_publisher
- Ia_etcd_ui
- Ia_grafana
- Ia_tdengineconnector
- Ia_telegraf
- Ia_zmq_broker
Step 5: Check Grafana Dashboard
- Open http://localhost:3000 in browser to check Grafana. The default username is admin and password admin.
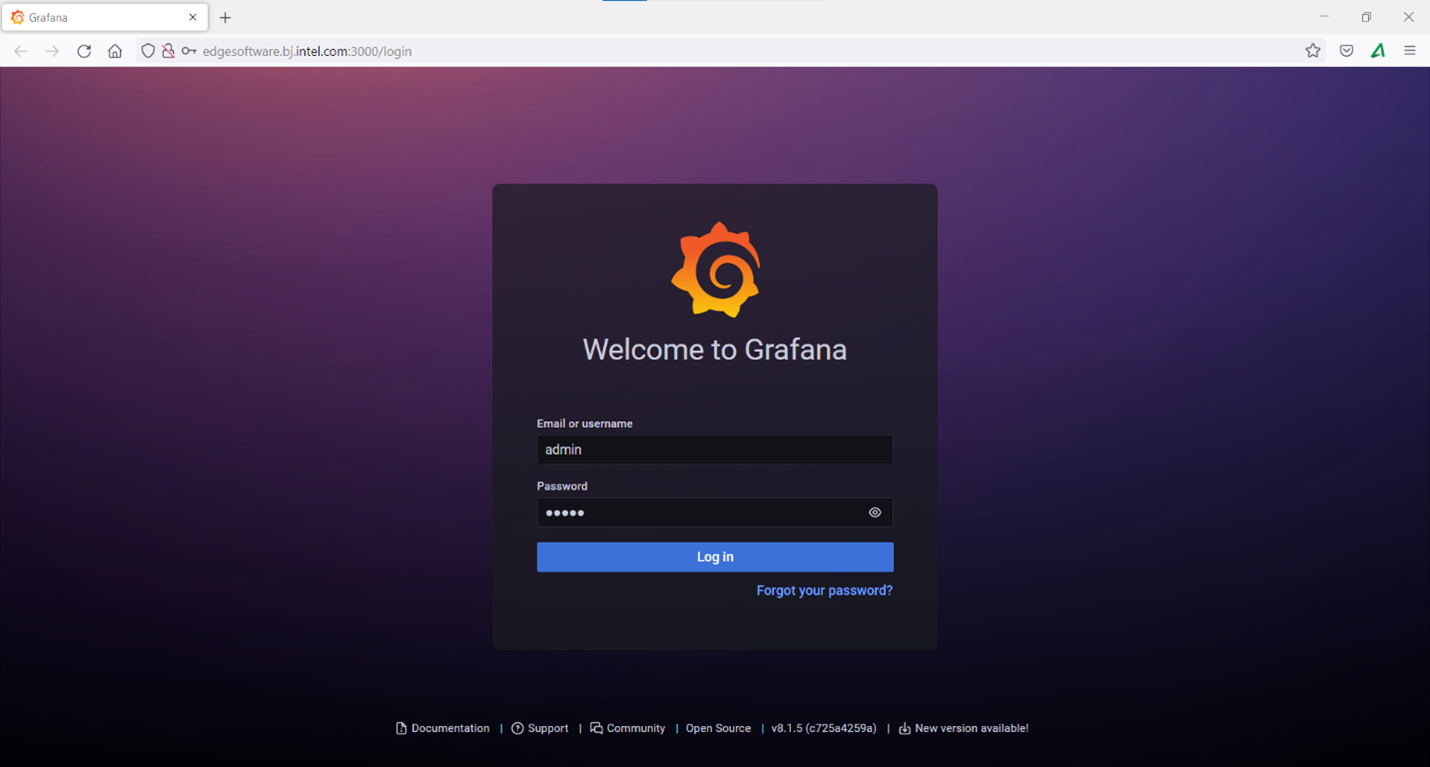
Figure 1: Grafana Login - After login, import Grafana dashboard.json from eii-tdengine-connector/eii-stack/grafana/dashboard.
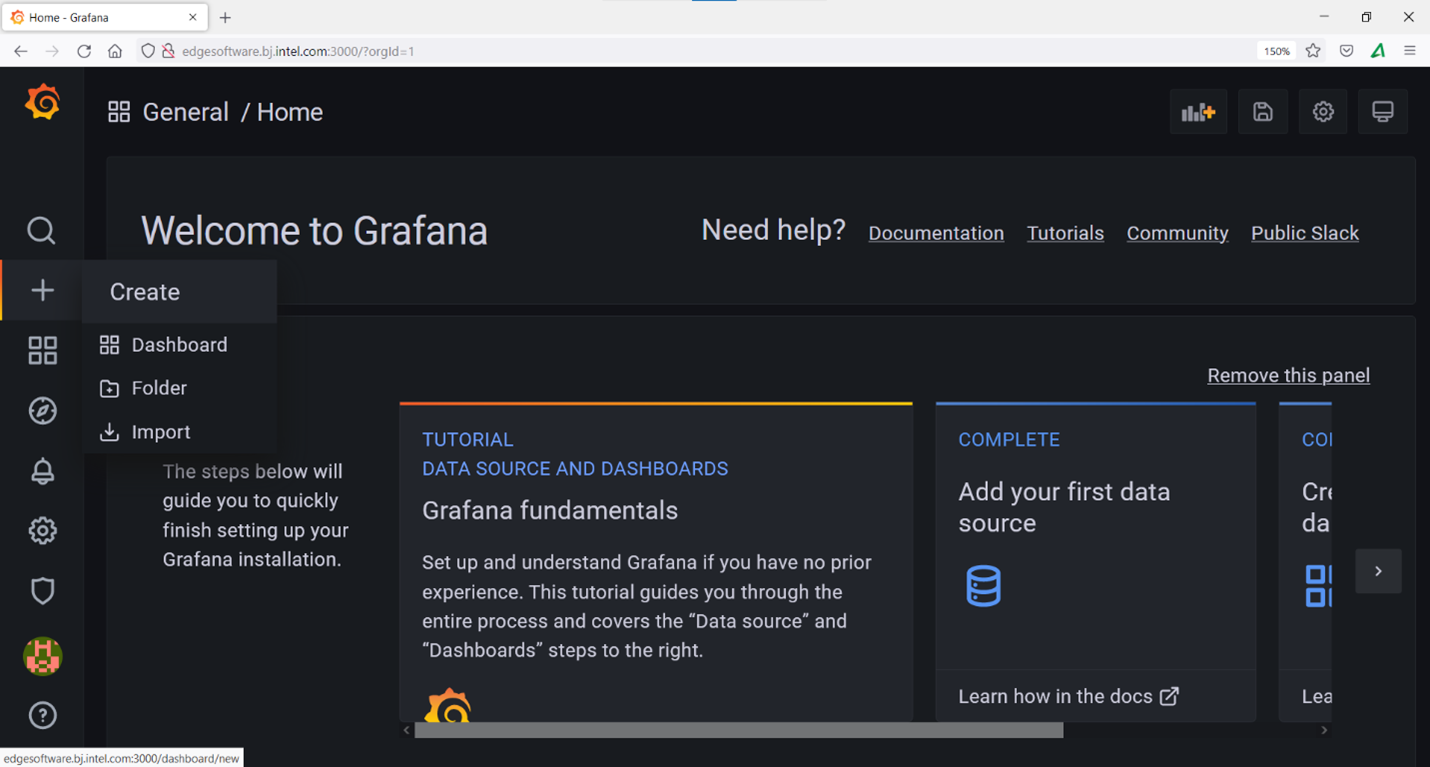
Figure 2: Select Import 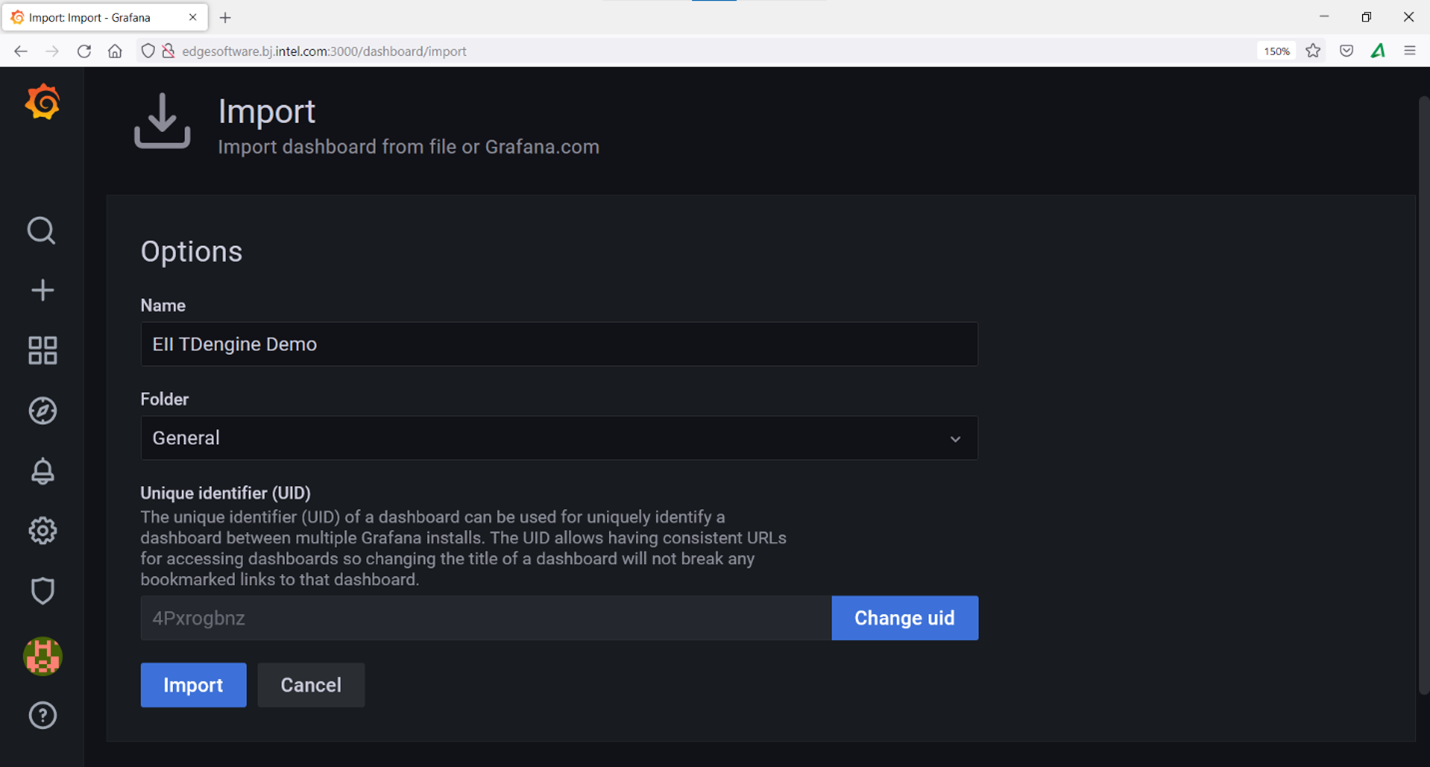
Figure 3: Import Dashboard - A few minutes after importing the dashboard, you should see something the EII TDengine Demo showing temperature, humidity, pressure, and voltage graphs.
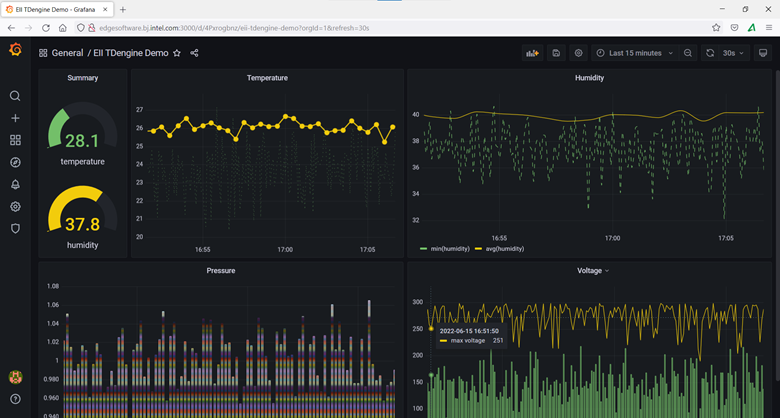
Figure 4: Dashboard of EII TDEngine Demo
Summary and Next Steps
With this use case, you set up a pipeline of collecting, storing and visualizing time-series data.
As a next step, try building your own time-series data pipeline with EII.
Learn More
To continue learning, see the following guides and software resources:
Support Forum
If you're unable to resolve your issues, contact the Support Forum.