Use this article as a guidance resource to tune and optimize applications that target Intel GPUs for computation, media client, and server applications. This article highlights some customized GPU-profiling capabilities in Intel® VTune™ Profiler.
Benefit from GPU Computation Resources
A graphic processing unit (GPU) is a powerful hardware component that can significantly enhance application and system performance when used with a CPU. Although GPUs were originally designed to accelerate the rendering of 3D graphics, they deliver two important benefits that make them a versatile choice for high-performance computational tasks in several industries:
- GPUs are programmable. They can accelerate applications beyond rendering 3D graphics, like gaming, creative production, and AI.
- GPUs perform parallel processing with large blocks of data to deliver enormous computational capability in areas like machine learning.
Intel graphics performance leverages the advantages of GPU functionality to use them as ‘performance accelerators’ without reducing the role of the CPU. Therefore, what tasks you choose to offload to the GPU vs retain on the CPU can have a significant impact on the performance of your system.
Once you offload onto the GPU, examine its performance and efficiency with Intel VTune Profiler. This is a versatile performance analysis tool that can help you determine how best your application can benefit from available hardware resources.
While GPUs are extremely popular devices to render graphics (in video or gaming applications) and to perform heavy computation in many other fields, this article focuses on profiling GPU applications primarily for computation.
Choose:
- Intel VTune Profiler for GPU compute and media analysis on Intel Graphics
- Intel Graphics Performance Analyzers (GPA) for graphics profiling of gaming applications
Learn More about GPU Compute Profiling:
- GPU Optimization Methodology with VTune Profiler
- A description of optimization tools in the oneAPI GPU Optimization Guide
- Offload Modeling Resources in Intel® Advisor
- GPU Roofline Analysis feature in Intel Advisor
Learn More about Graphics Profiling:
- A cookbook recipe on Performance Optimization for Intel Processor Graphics with Intel® Graphics Performance Analyzers
- Guidance on developing and optimizing 3D rendering applications for Intel® Processor Graphics Gen11
Learn More about GPU Optimization with Intel Software Tools:
VTune Profiler Workflow for GPU Profiling and Optimization
- Prepare your system for GPU profiling.
- Get a performance summary.
- Profile, analyze and optimize on the CPU side. Run GPU Offload Analysis. Use analysis results and data transfer metrics to identify:
- Whether your application is CPU or GPU-bound. If your application is CPU-bound, follow guidance from the analysis to improve GPU offload and make your application GPU-bound.
- Whether your offload onto the GPU is optimal.
- GPU kernels that are critical for performance and require optimization.
- Profile, analyze and optimize on the GPU side. Run GPU Compute/Media Hotspots Analysis.
- Characterize the most time-consuming GPU kernels: get the Dynamic Instruction Count breakdown by instruction type, or check efficiency of GPU utilization based on GPU hardware metrics (Characterization mode).
- Identify performance-critical basic blocks and issues caused by memory accesses in the GPU kernels (Source Analysis mode).
Prepare your System for GPU Profiling
Ensure you have relevant permissions and drivers installed on your system to run GPU analyses using VTune Profiler.
Learn More:
- Instructions on how to set up your system for GPU analysis
- Information on installing, deploying, and updating Intel software to enable general-purpose GPU (GPGPU) capabilities for Linux* OS distributions
Get a Performance Summary
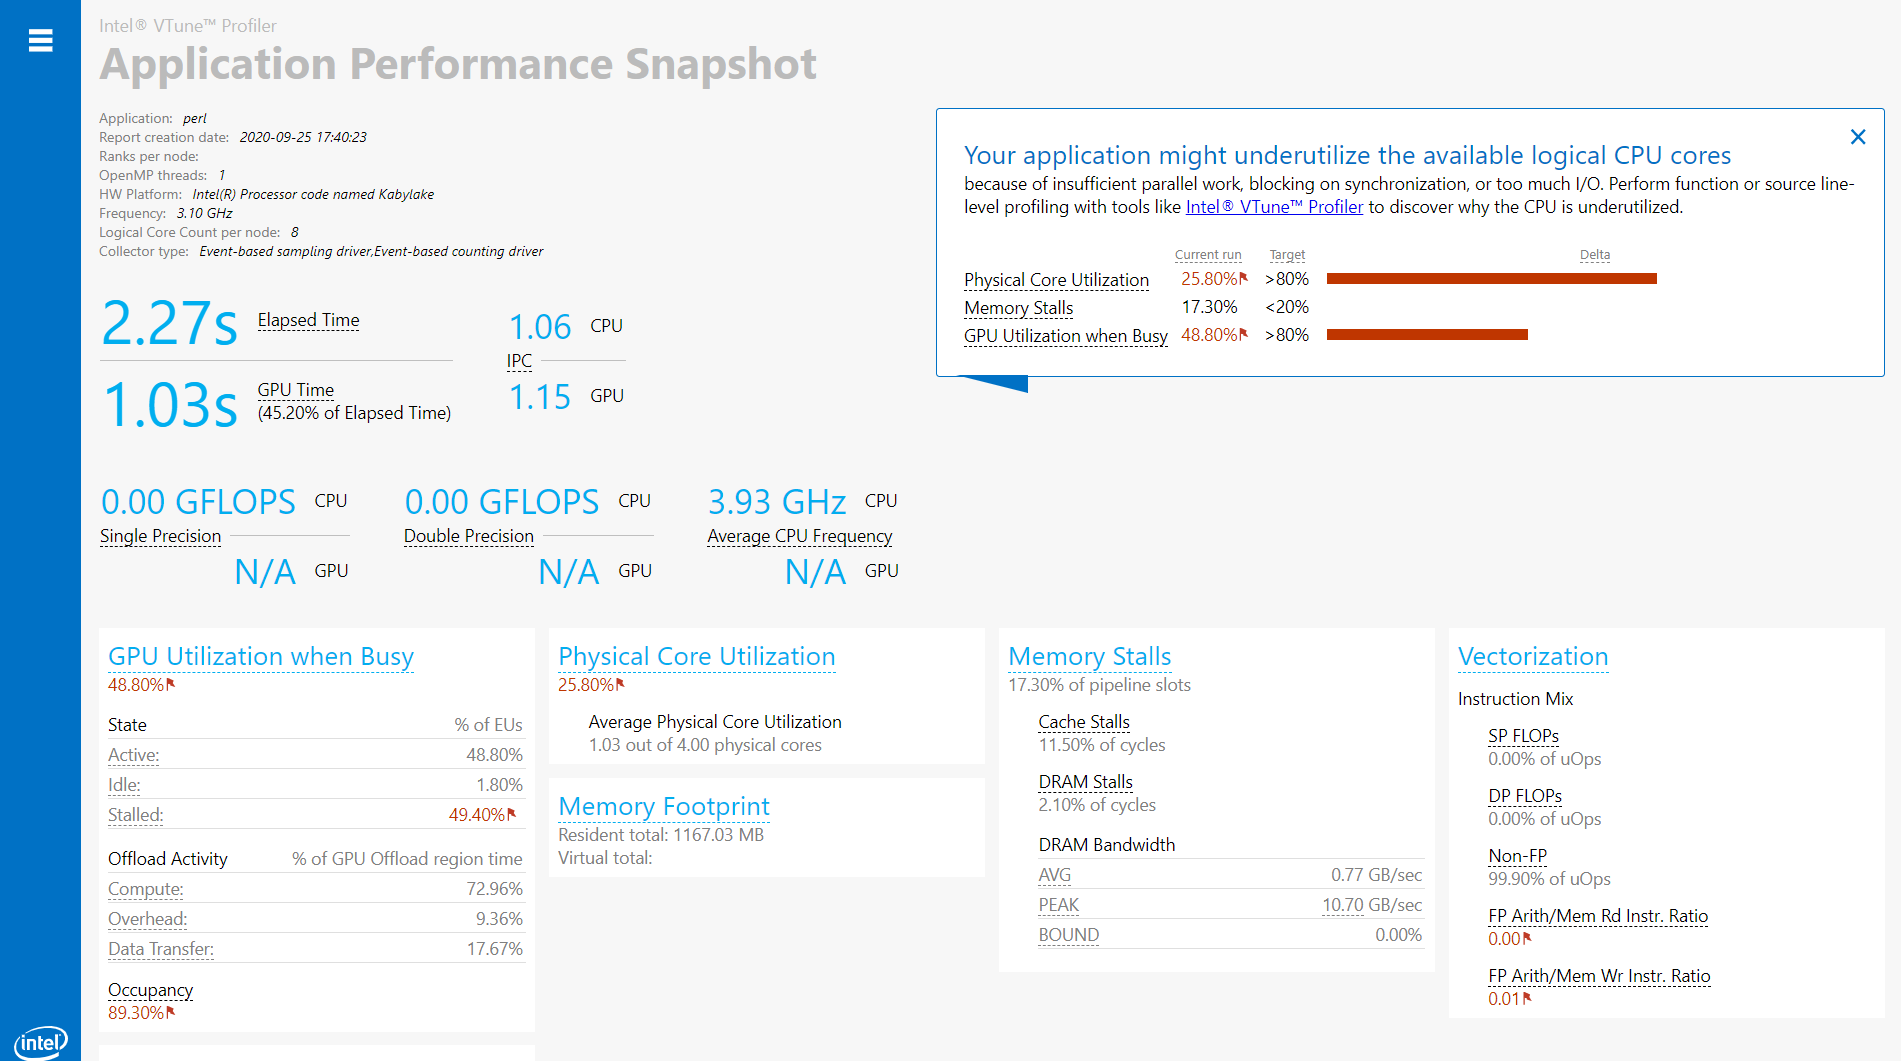
Use Application Performance Snapshot (Linux) and/or Performance Snapshot analysis in Intel® VTuneTM Profiler to get a quick summary of performance issues that affect your application.
Choose:
- Application Performance Snapshot (Linux systems only) if you are optimizing an MPI application on a Linux system. Use the lightweight GUI or run it from the command line.
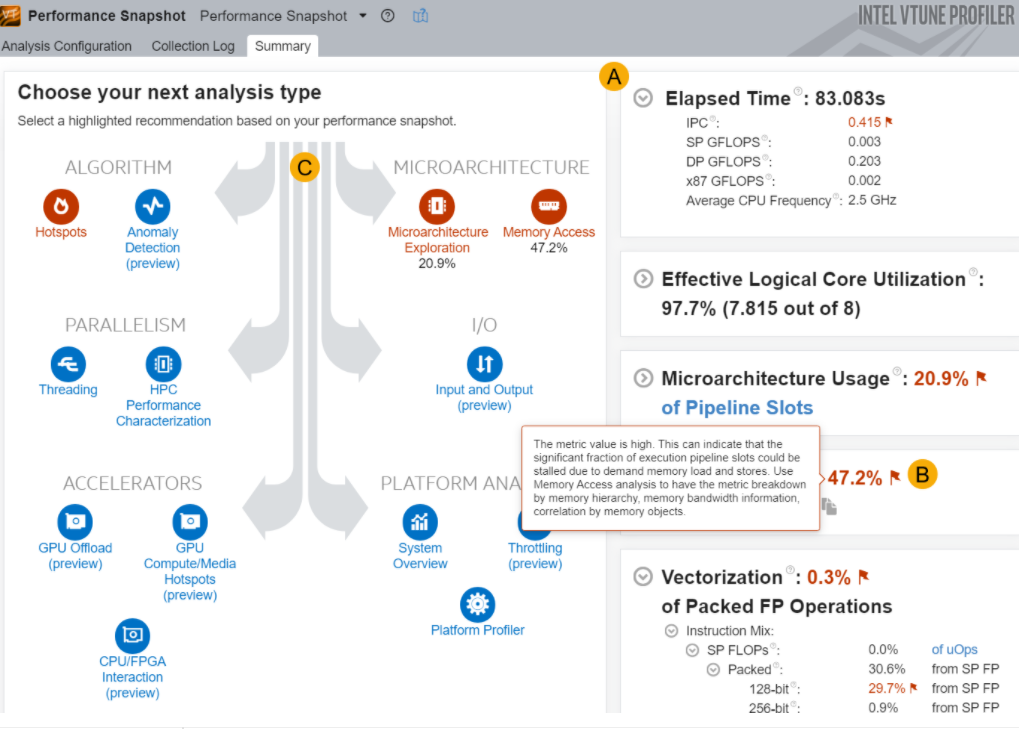
- Performance Snapshot for all other applications. Run this analysis from the Analysis Tree in VTune Profiler.
Learn More:
Profile and Analyze on the CPU side
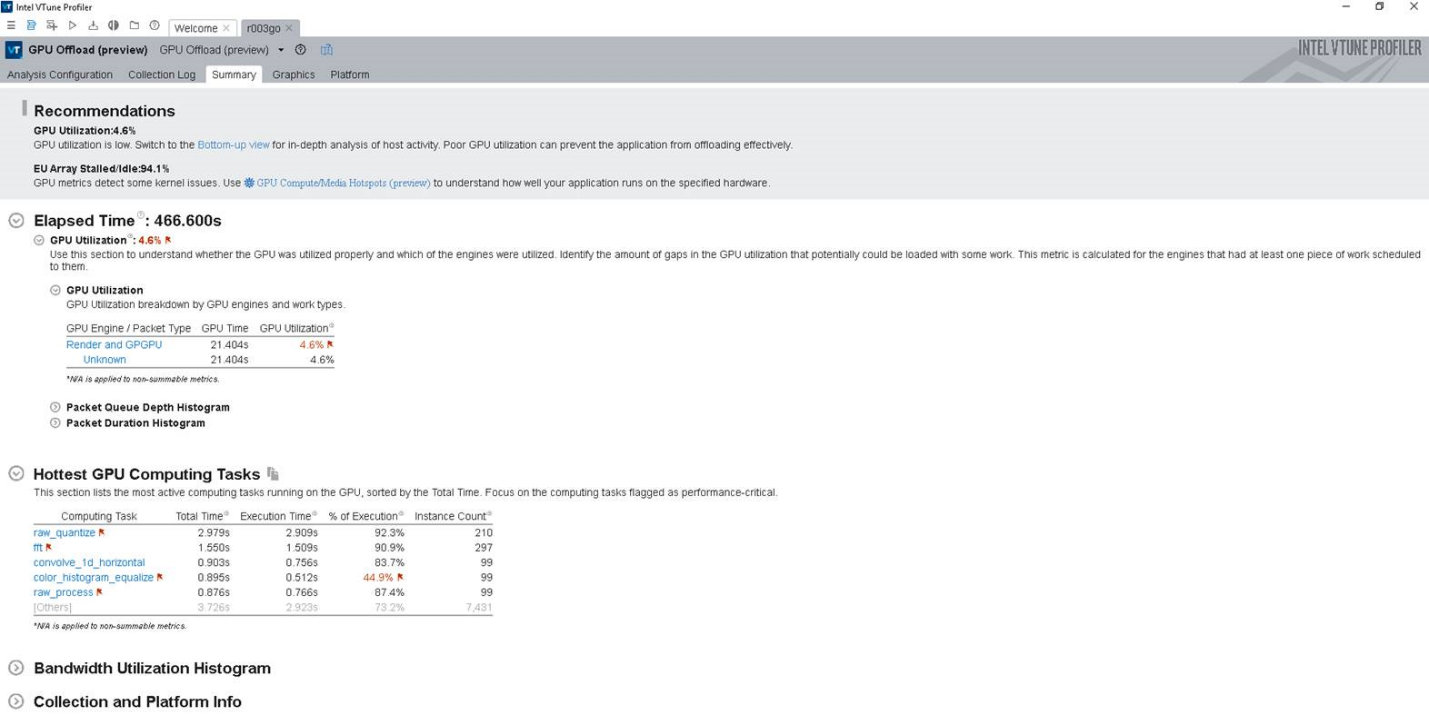
Run the GPU Offload Analysis in VTune Profiler to identify if your application is CPU or GPU-bound. You can also see how effectively the application offloads code to the GPU. Use analysis results and data transfer metrics to identify:
- Whether your application is CPU or GPU-bound. If your application is CPU-bound, follow guidance from the analysis to improve GPU offload and make your application GPU-bound.
- Whether your offload onto the GPU is optimal.
- GPU kernels that are critical for performance and require optimization.
If you have multiple Intel GPUs connected to your system, use the Target GPU option when configuring the GPU Offload analysis to select a GPU for profiling.
Optimize on the CPU side
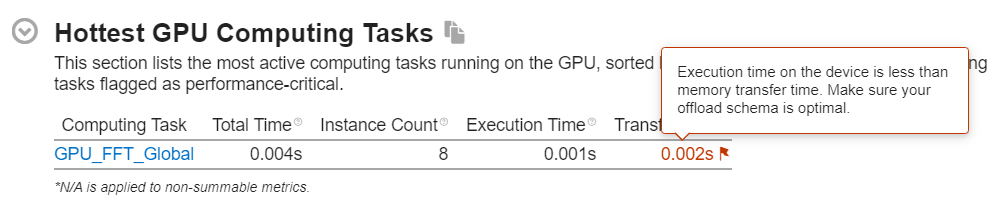
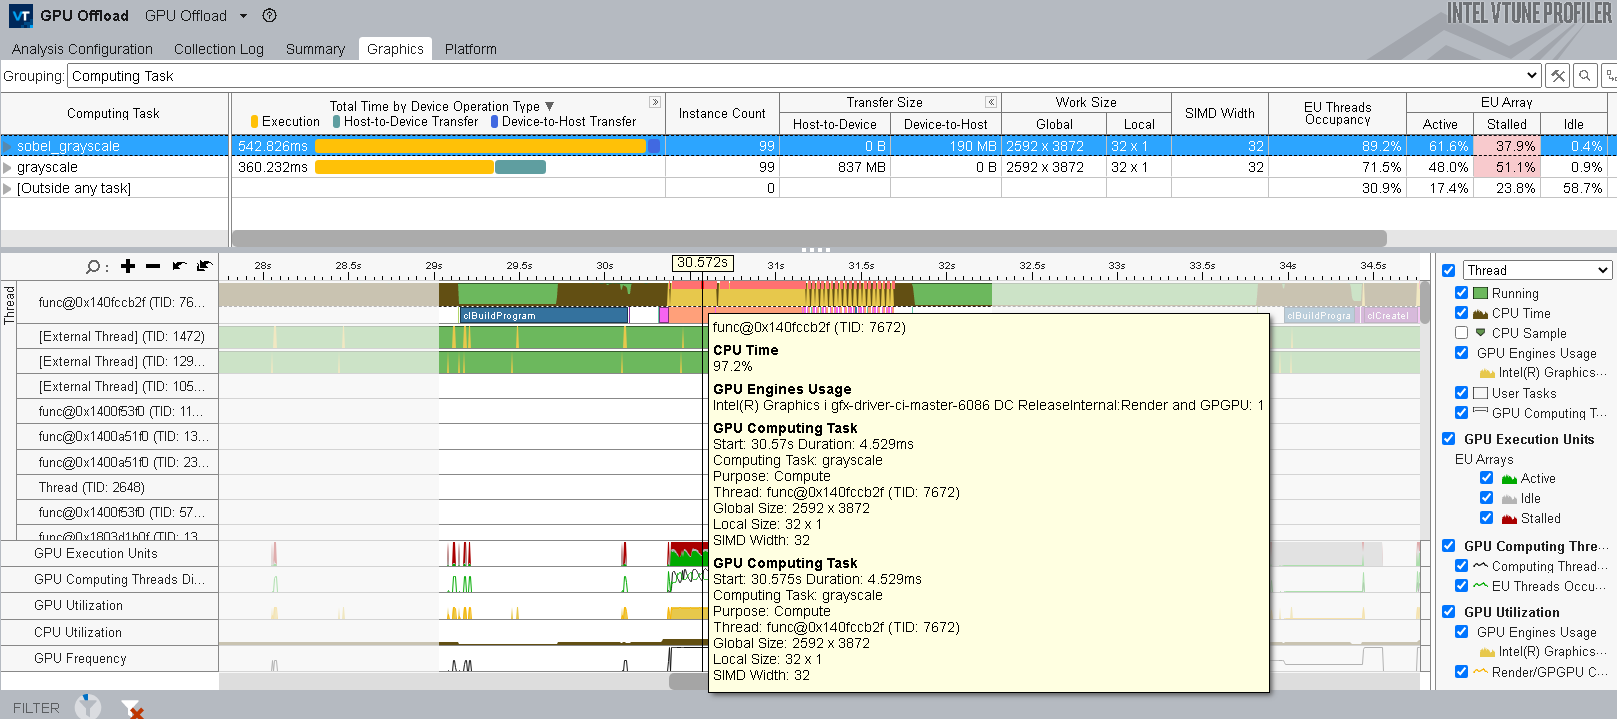
Use data transfer metrics in the GPU Offload Analysis results to see how much time was spent in transfer operations between host and device.
- The analysis summary displays execution time and data transfer time. If the execution time is lower, this indicates a sub-optimal offload schema for your application.
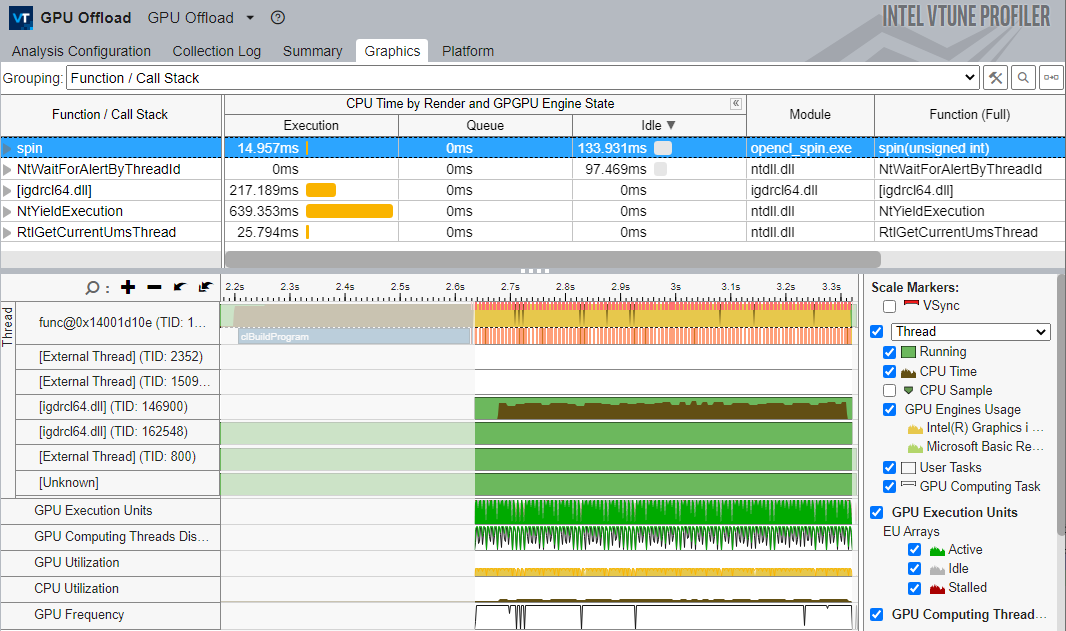
- Depending on the grouping level that you select, the Graphics tab presents the collected data in different views:
- The Function/Call Stack grouping level displaysthe hottest functions that executed on the CPU when the GPU was idle.
- The Computing Task grouping level displays a breakdown of total processing time for computing task per kernel as well as the size of data transfer.
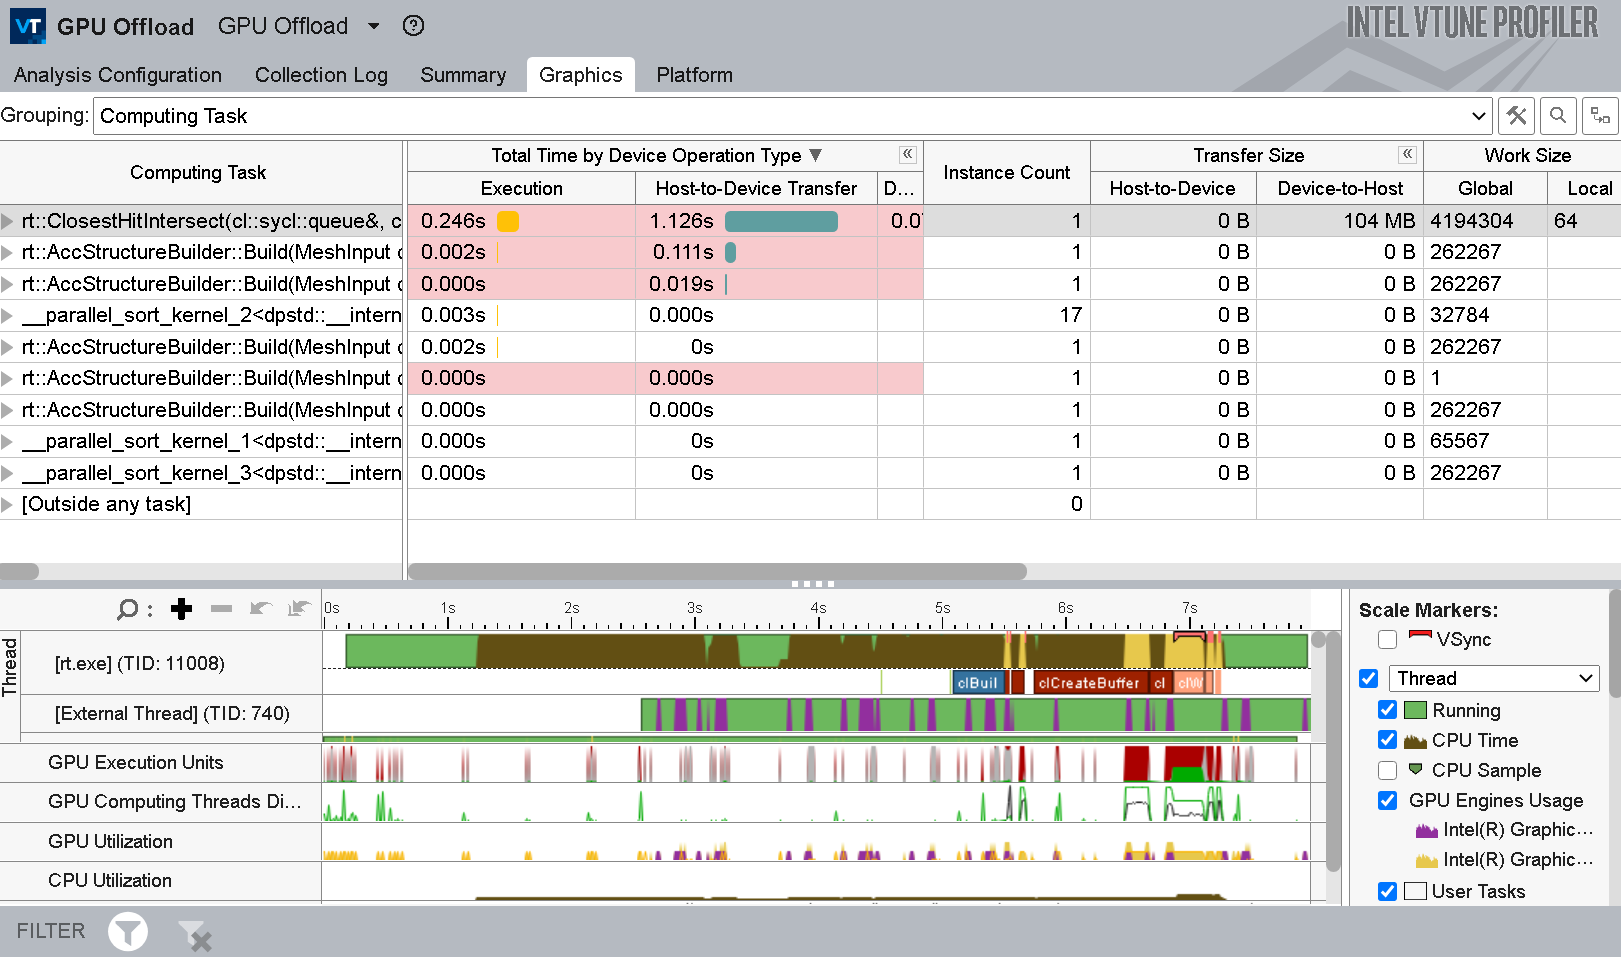
The guidance provided in the analysis can help you to identify unnecessary memory transfers that hamper performance. Finish the analysis by identifying those kernels in your GPU that are critical for application performance.
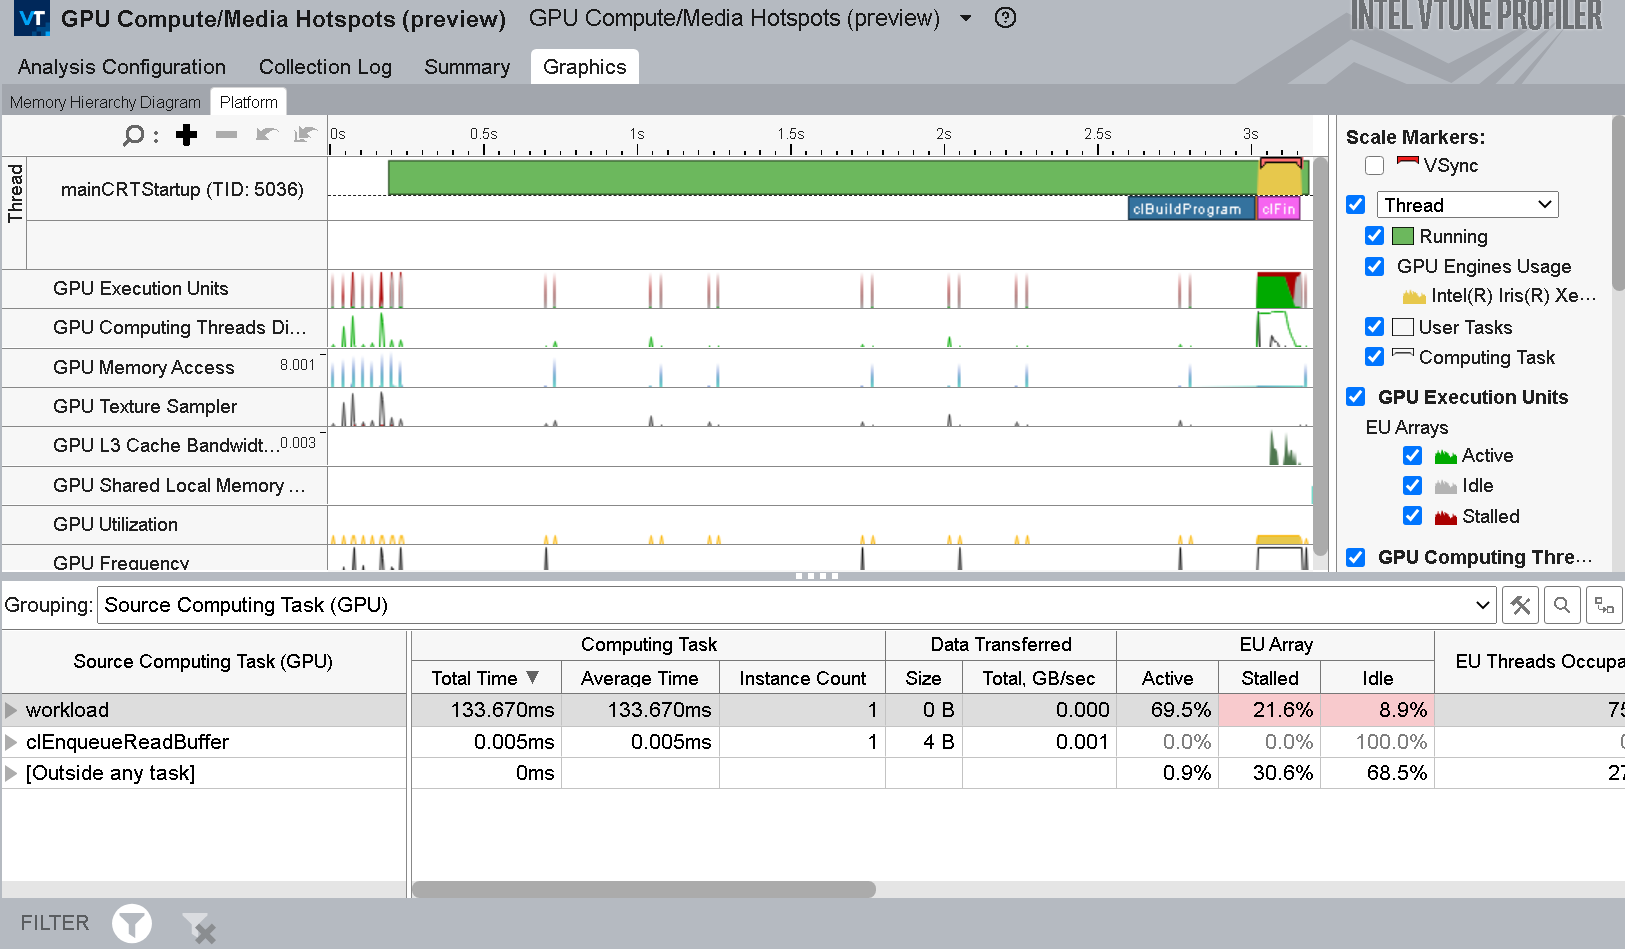
To focus on the offloading stage, see the GPU Utilization metric. The context summary displays this metric in the Platform tab when you filter data by time.
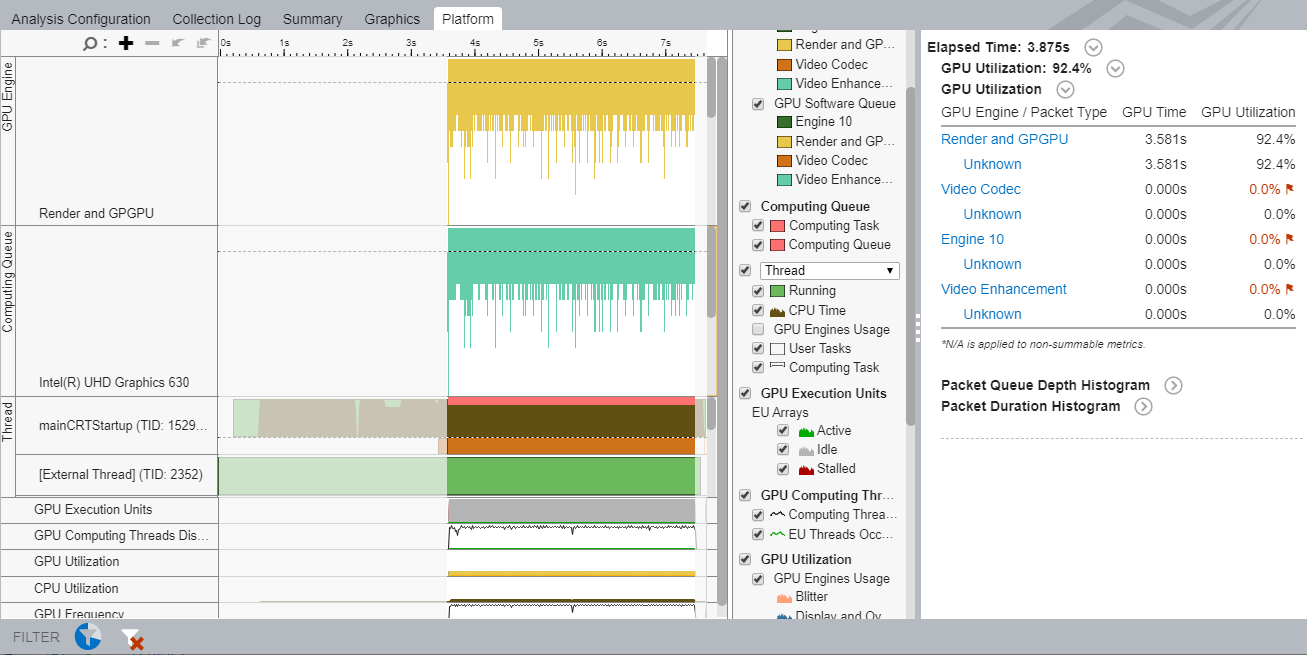
- Check to see if this metric is high.
- Also check to see if the EUs are active/idle for the most part. Idle EUs could indicate significant overhead in scheduling smaller kernels. You can establish this by comparing the duration of kernel instance to the duration of a command buffer for the kernel.
- You may want to consider increasing the size of data processed by each kernel instance to decrease the scheduling overhead associated with every invocation of a kernel.
Learn More:
Profile and Analyze on the GPU side
A good starting point for your analysis on the GPU side is informed by an affirmative answer to one of these questions:
- Have you sufficiently optimized your application on the CPU side?
- Do CPU-GPU interactions look reasonable?
- Is your GPU busy for a significant period of time?
- Is your application GPU-bound?
When you are finished on the CPU side, run GPU Compute/Media Hotspots analysis. Examine the performance-critical kernels you already identified with the GPU Offload analysis. GPU kernels with high utilization may not necessarily get utilized in the most efficient way. The GPU Compute/Media Hotspots analysis helps you characterize GPU usage and identify reasons for inefficient use.
- Characterize the most time-consuming GPU kernels: get the Dynamic Instruction Count breakdown by instruction type, or check efficiency of GPU utilization based on GPU hardware metrics (Characterization mode).
- Identify performance-critical basic blocks and issues caused by memory accesses in the GPU kernels (Source Analysis mode).
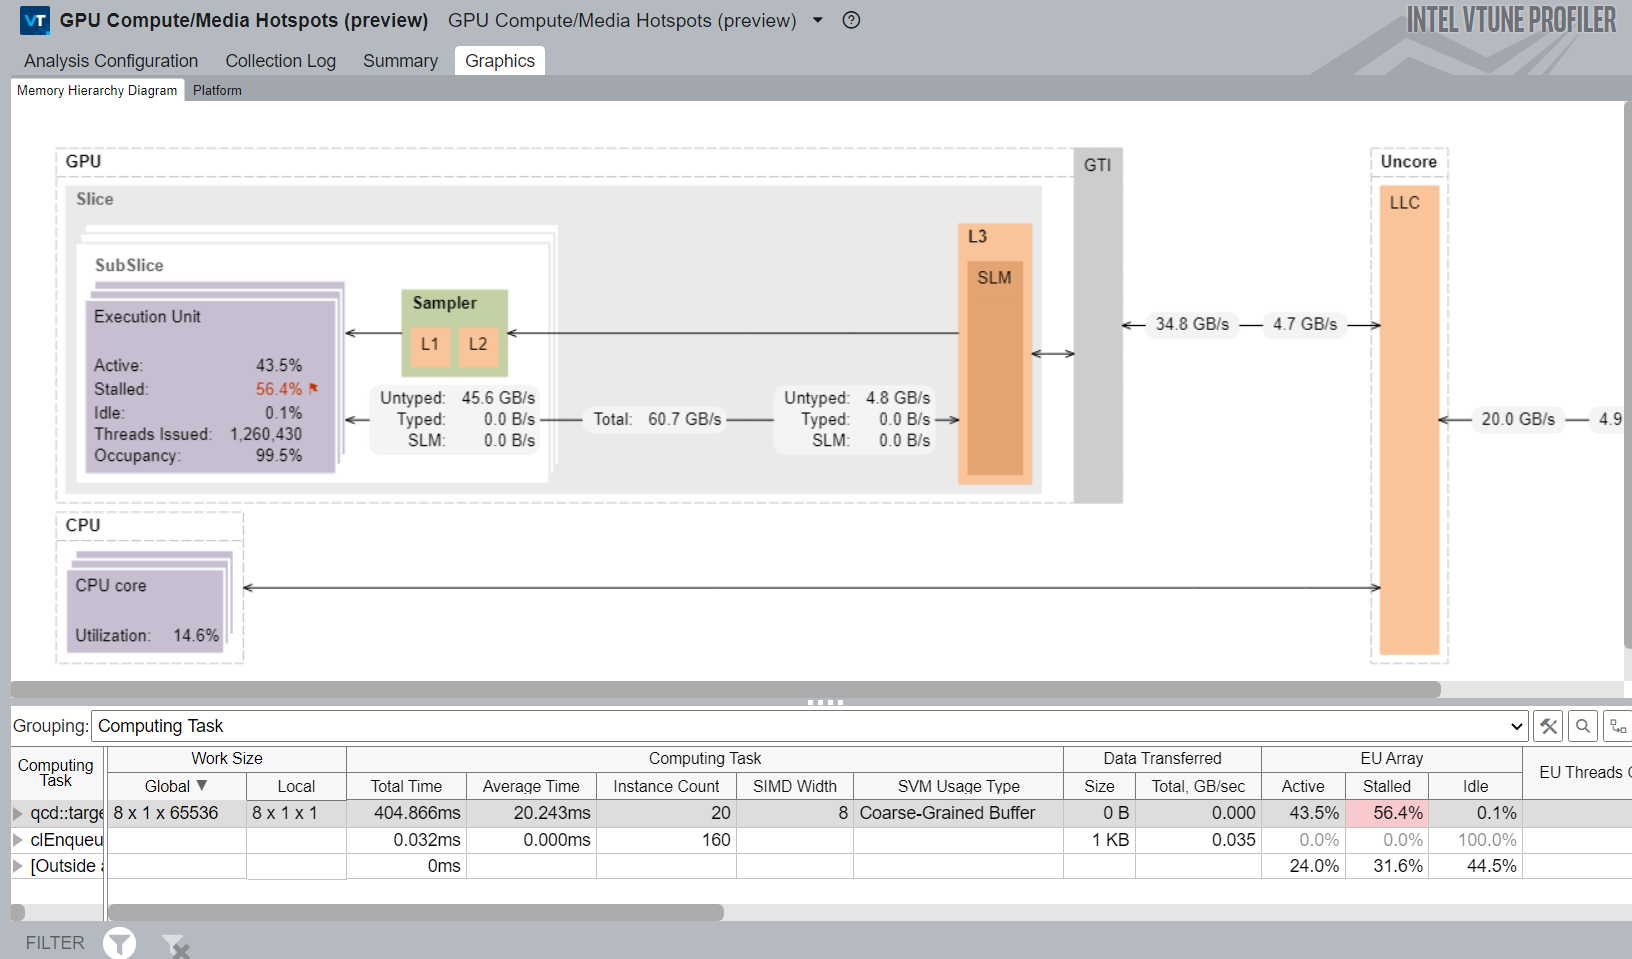
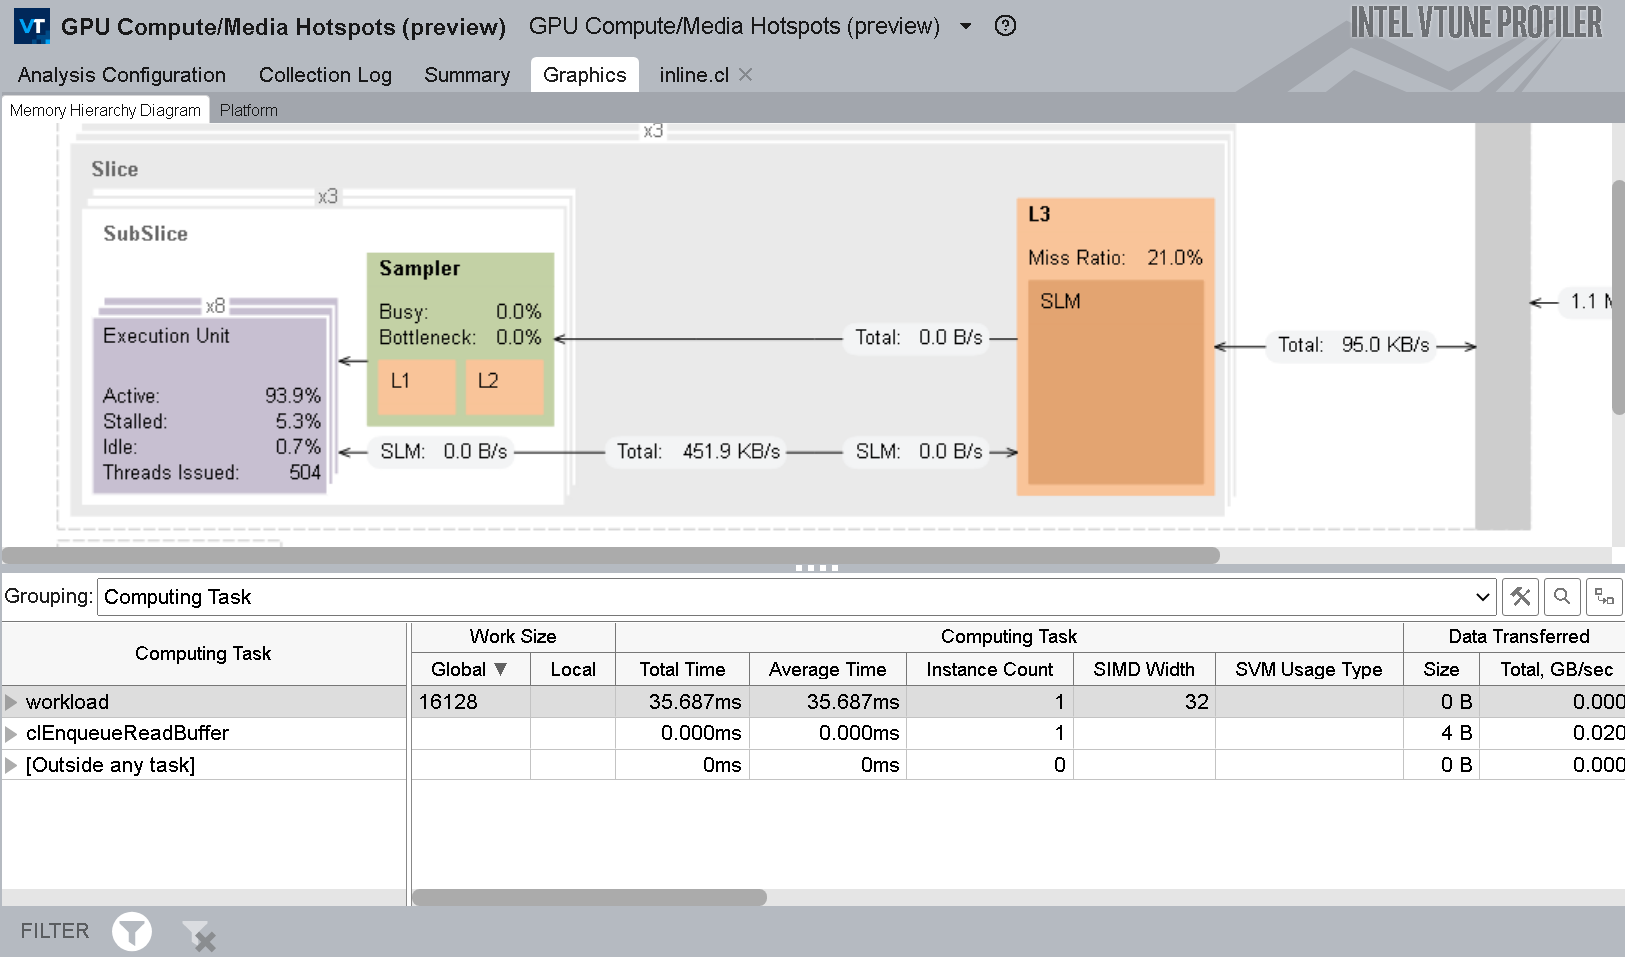
- Examine the Memory Hierarchy diagram to identify significant data traffic between GTI, caches, and GPU. This can cause performance issues due to a stalled EU array.
Learn More:
- Configure GPU Analysis from the Command Line
- Understand the mapping between available Intel Processor series and Processor Graphics
Optimize on the GPU side
You can employ several techniques to optimize the performance of the code portions you offload on the GPU. First, understand and navigate through potential bottlenecks in the Summary window of the GPU Compute/Media Hotspots analysis. Here, you can also see metrics related to computing tasks.
Next, switch to the Graphics tab and explore these views:
- The Computing Task grouping level presents a breakdown of total processing time for computing tasks per kernel and the size of data transfer.
- The Source Computing Task grouping level presents similar information for source-level kernels that were written for the program.
In the GPU Compute/Media Hotspots analysis, use Dynamic Instruction Count analysis to examine your code and see the number of each type of instruction.
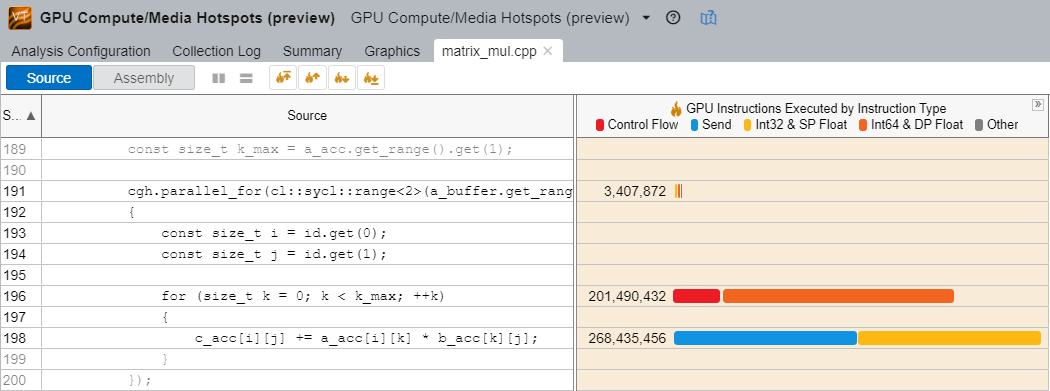
In this example, the int64 instructions are 4x slower than int32 instructions. See if they are actually required in the location under scrutiny. A simple rewrite of code can reduce the number of executed instructions and deliver potential performance gains.
You can also run this analysis with the Compute Basic preset, which presents additional information about L3 traffic in the Memory Hierarchy diagram (introduced in the previous section).
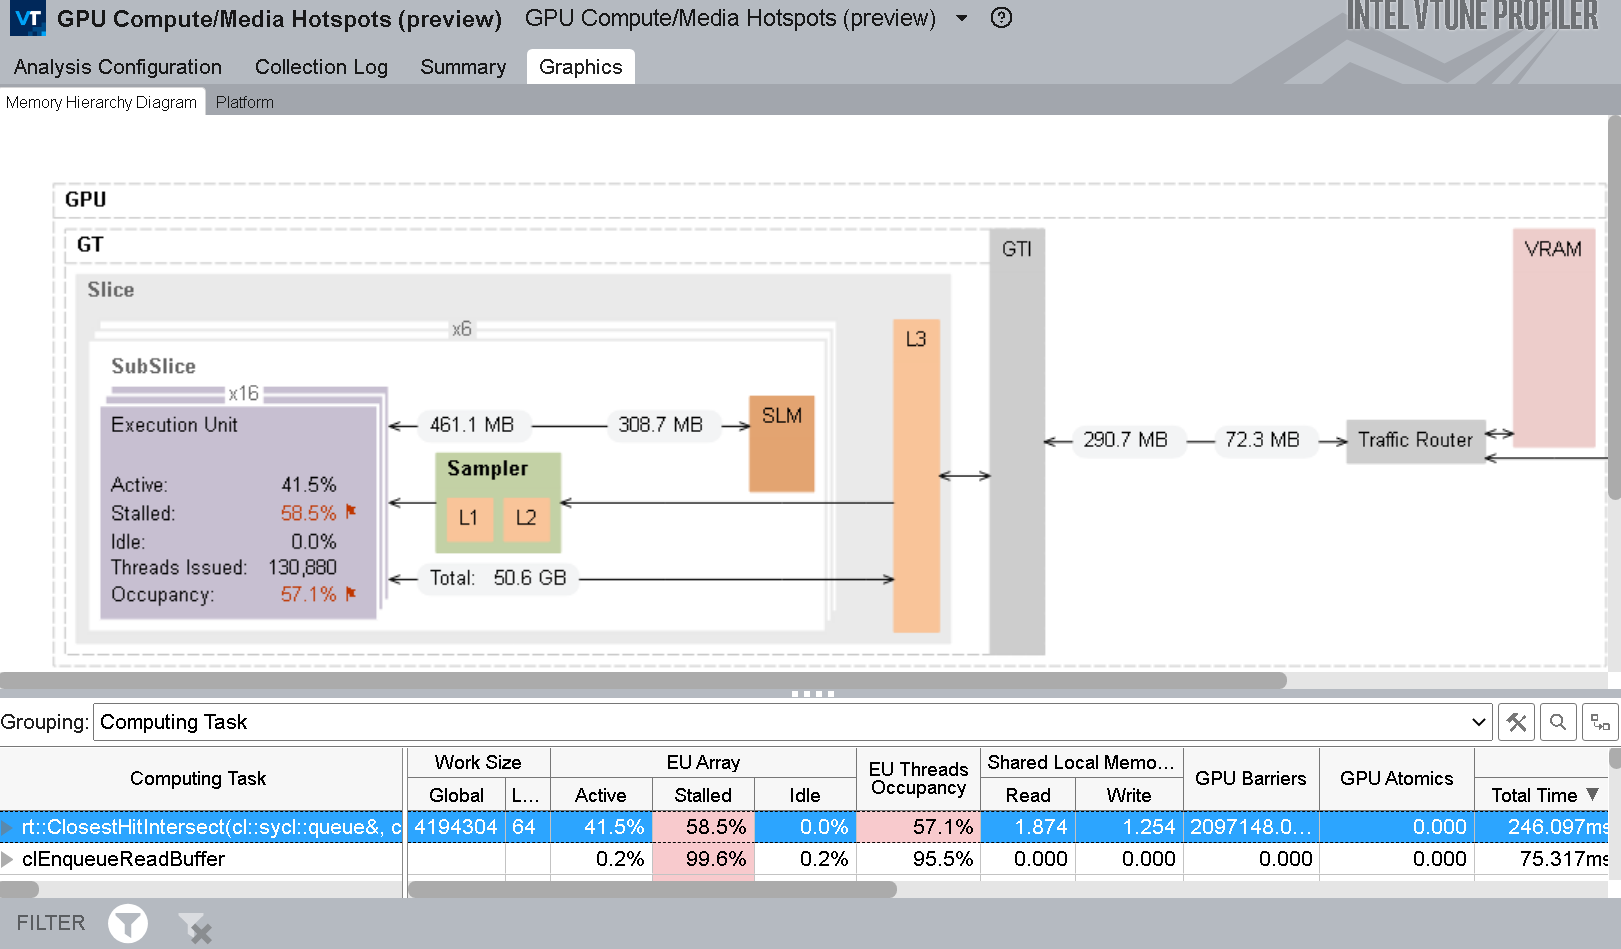
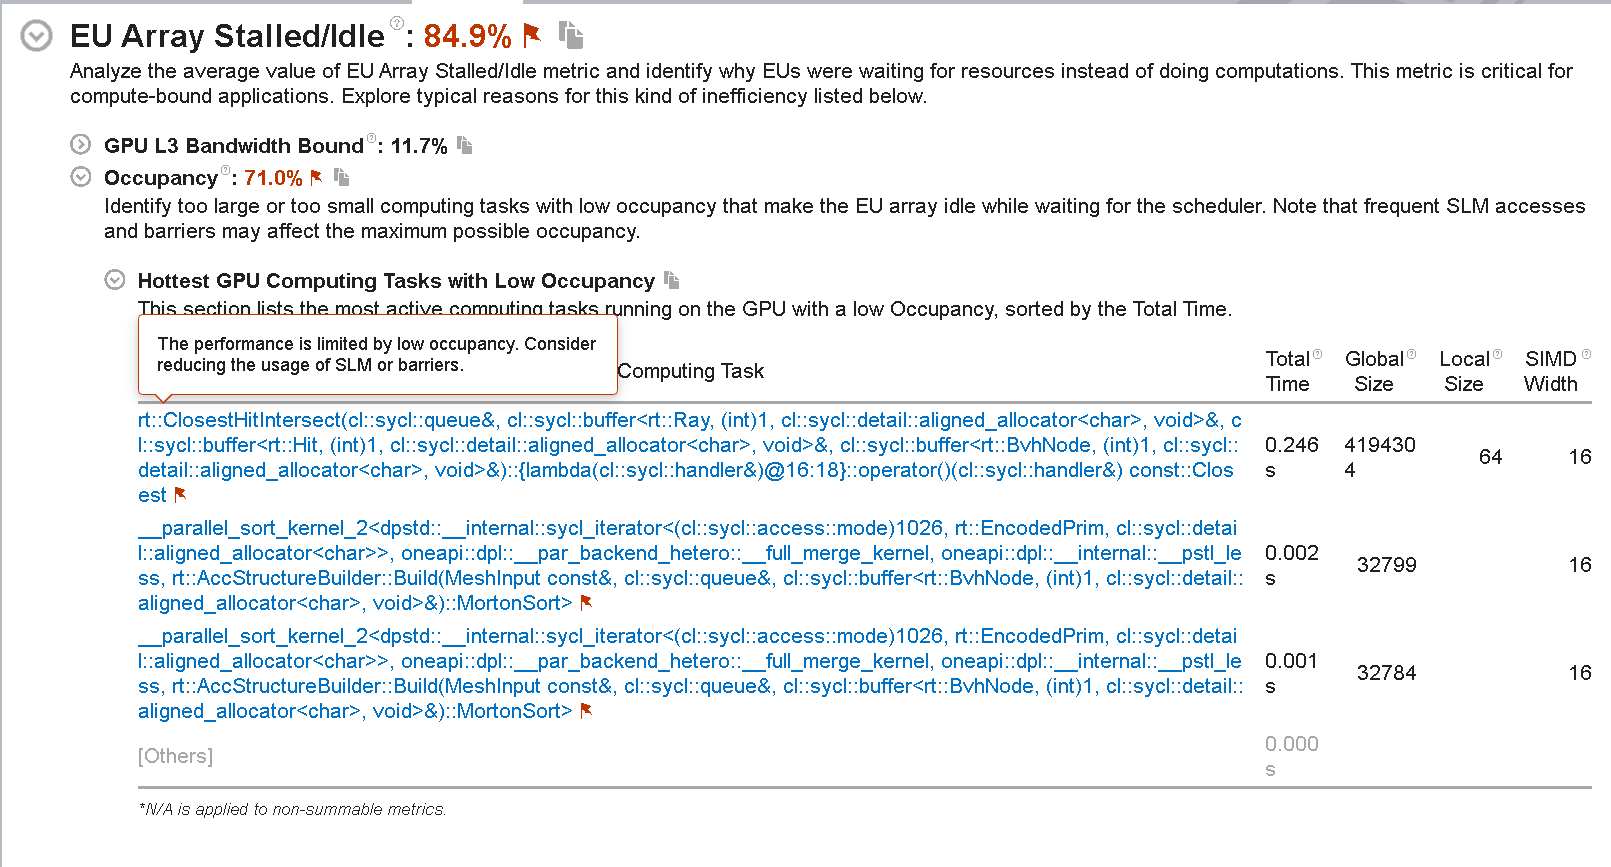
Examine the metrics in the Grouping table with the information presented in the Memory Hierarchy diagram to map computing tasks to the GPU architecture.
- Focus on significant stalls and occupancy in EUs that are flagged in the table.
- See where there was extensive use of GPU barriers or a request for a large volume of shared local memory.
- In the diagram, see if there is a high ratio of data transferred between GPU units to the initial size of the dataset.
- Use the Show Data As feature in the diagram to get additional information like size, bandwidth, or percentage of maximum bandwidth between GPU units.
Learn More:
Profile OpenMP Offload Applications for GPUs
When you build and compile an OpenMP application offloaded onto an Intel GPU, get a high-level summary of application performance by running the HPC Characterization analysis. This analysis type can help you understand how your application utilizes the CPU, GPU, and available memory. You can also see the extent to which your code is vectorized. Follow this analysis with the GPU Offload analysis.
Learn More:
Profile OpenCL™ Applications
Start your profiling of OpenCL™ applications with the GPU Offload analysis.
- Investigate the efficiency of scheduled kernels on the GPU by checking Transfer and Work sizes.
- Monitor CPU and GPU usage mapped to OpenCL™ calls on the timeline to see corresponding performance metrics.
Your performance analysis of OpenCL™ applications can also benefit from some features in the GPU Compute/Media Hotspots analysis type. Run this analysis in the Characterization mode and select the Full Compute preset option. This employs the Overview and Compute Basic event groups to collect data that can help you understand reasons for the stalling of EUs. If the GPU Computing Threads Dispatch metric (in the Timeline pane of the Graphics window) indicates that your OpenCL application is doing substantial work on the GPU, enable the Trace GPU Programming API and run the analysis again.
VTune Profiler highlights those OpenCL kernels running on the GPU that contain performance issues triggered by preset thresholds.
- You can sort the data by computing task purpose - Compute (for the kernels), Transfer (the routines that transfer data between host and GPU), and Synchronization.
- Focus on the kernels with the longest total times. They include kernels with long average time values as well as frequently invoked kernels with shorter time values.
Learn More:
- An Introduction to GPU In-kernel Profiling with OpenCL™ code
- Explore Execution of OpenCL™ Kernels
- GPU OpenCL™ Application Analysis
- OpenCL™ Kernel Analysis Metrics Reference
Profile DPC++ Applications
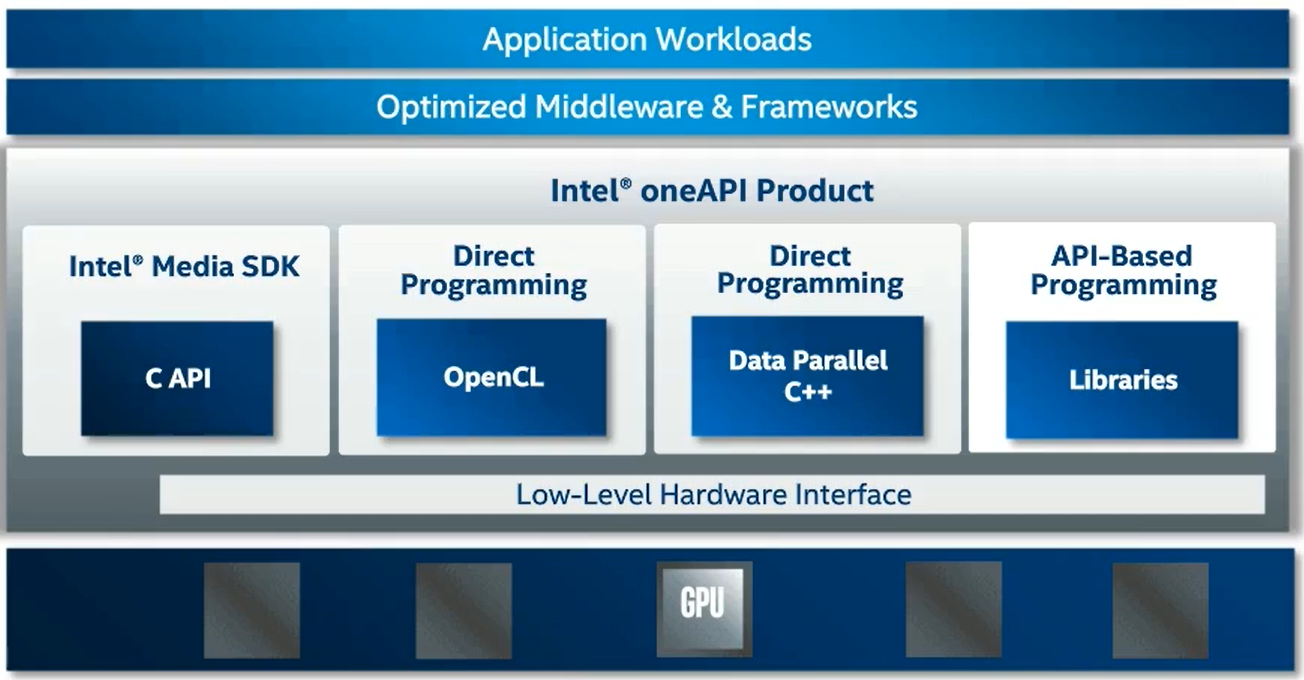
Data Parallel C++ (DPC++) forms the core of the Intel oneAPI specification. DPC ++ combines aspects of ISO C++ and SYCL* standards from the Khronos* Group with several community extensions to deliver a robust high-level language that is uniquely adapted for parallel programming in Intel CPUs and GPUs. It features an implementation of unified shared memory to ease memory use between the CPU host and GPU accelerator.
To use VTune Profiler to run a GPU analysis on DPC++ applications, you need the Intel® C++ Compiler that is available with the Intel oneAPI base toolkit.
If you have GPU applications written in CUDA, use these resources to migrate them to DPC++.
With DPC++ applications, your profiling experience can vary depending on the backend you choose (Level-0, OpenCL etc). But the profiling methodology is similar to profiling OpenCL applications.
Learn More:
- Intel® C++ Compiler
- Intel oneAPI Programming Guide
- DPC++ Language and API Reference
- Intel DPC++ Compatibility Tool User Guide to migrate your CUDA code to DPC++
- A webinar on how to Migrate your existing CUDA code to DPC++
- A guide on using SYCL for CUDA developers
- A recipe to profile a DPC++ application running on a GPU
- GPU Optimization Methodology with VTune Profiler
Summary
When you offload applications onto Intel GPUs for intensive computation, you gain maximum benefit by optimizing these applications to execute on the GPUs so that they can fully employ the parallel processing potential of these devices.
Intel® VTune Profiler and other Intel software analysis tools contain profiling features specifically crafted for this purpose so you can exploit the full potential of your GPU.