1. Description
Most modern systems use a Non-Uniform Memory Access (NUMA) design for multiprocessing. In NUMA systems, memory and processors are organized in such a way that some parts of memory are closer to a given processor, while other parts are farther from it. A processor can access memory that is closer to it much faster than the memory that is farther from it. Hence, the latency between the processors and different portions of the memory in a NUMA machine may be significantly different.
numatop is an observation tool for runtime memory locality characterization and analysis of processes and threads running on a NUMA system. It helps the user to characterize the NUMA behavior of processes and threads and to identify where the NUMA-related performance bottlenecks reside. The tool uses Intel performance counter sampling technologies and associates the performance data with Linux system runtime information to provide real-time analysis in production systems. The tool can be used to:
- Characterize the locality of all running processes and threads to identify those with the poorest locality in the system.
- Identify the “hot” memory areas, report average memory access latency, and provide the location where accessed memory is allocated. A “hot” memory area is where process/thread(s) accesses are most frequent. numatop has a metric called “ACCESS%” that specifies what percentage of memory accesses are attributable to each memory area.
- Note: numatop records only the memory accesses which have latencies greater than a predefined threshold (128 CPU cycles).
- Provide the call-chain(s) in the process/thread code that accesses a given hot memory area.
- Provide the call-chain(s) when the process/thread generates certain counter events (RMA/LMA/IR/CYCLE). The call-chain(s) helps to locate the source code that generates the events.
- RMA: Remote Memory Access.
- LMA: Local Memory Access.
- IR: Instruction Retired. CYCLE: CPU cycles.
- CYCLE: CPU cycles
- Provide per-node statistics for memory and CPU utilization. A node is: a region of memory in which every byte has the same distance from each CPU
- Show, using a user-friendly interface, the list of processes/threads sorted by some metrics (by default, sorted by CPU utilization), with the top process having the highest CPU utilization in the system and the bottom one having the lowest CPU utilization. Users can also use hotkeys to resort the output by these metrics: RMA, LMA, RMA/LMA, CPI, and CPU%.
- RMA/LMA: ratio of RMA/LMA.
- CPI: CPU cycle per instruction.
- CPU%: CPU utilization.
numatop is a GUI tool that periodically tracks and analyzes the NUMA activity of processes and threads and displays useful metrics. Users can scroll up/down by using the up or down key to navigate in the current window and can use several hot keys shown at the bottom of the window, to switch between windows or to change the running state of the tool. For example, hotkey 'R' refreshes the data in the current window.
Users can easily launch numatop by executing the command line “numatop”. For the full command line parameters, refer to the man page. More than one instance of numatop can be run simultaneously on Linux.
numatop requires a patch set to support PEBS Load Latency functionality in the kernel. The patch set has not been integrated in 3.7/3.8. It will probably be integrated in 3.9. The following steps show how to apply the patch set.
Note: Kernel versions lower than 3.7 are not supported.
- git clone git://git.kernel.org/pub/scm/linux/kernel/git/tip/tip.git
- cd tip
- git checkout perf/x86
- Build kernel as usual
numatop supports the Intel® Xeon® processors: 5500-series, 6500/7500-series, 5600 series, E7-x8xx-series, and E5-16xx/24xx/26xx/46xx-series.
Note: CPU microcode version 0x618 or 0x70c or later is required on E5-16xx/24xx/26xx/46xx-series.
2. Capabilities of numatop
Numatop’s capabilities are illustrated through an example run using a test application on an Intel Xeon processor E5-2680 platform.
1) Suppose you want to observe the memory access locality of each process in the system. You can just launch numatop without any options (run as root):
[root@host1 ~] numatop
Figure 1 shows the first window upon numatop startup. This is numatop’s “home” window. It displays a list of processes. By default, the top process has the highest system CPU utilization (CPU%), while the bottom process has the lowest CPU% in the system. Generally, the memory-intensive process is also CPU-intensive, so the processes shown in this window are sorted by CPU% by default. You can press hotkeys '1', '2', '3', '4', or '5' to resort the output by "RMA", "LMA", "RMA/LMA", "CPI", or "CPU%".
- RMA(K): number of Remote Memory Accesses (unit is 1000).
- RMA(K) = RMA / 1000;
- LMA(K): number of Local Memory Accesses (unit is 1000).
- LMA(K) = LMA / 1000;
- RMA/LMA: ratio of RMA/LMA.
- CPI: CPU cycles per instruction.
- CPU%: system CPU utilization (busy time across all CPUs)
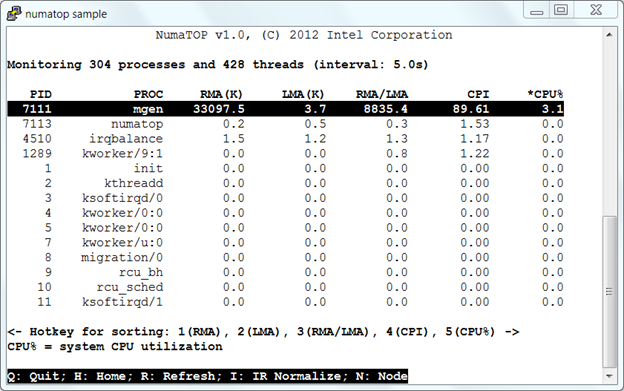
Figure 1. Monitoring processes and threads
In Figure 1, the process “mgen” generates a huge number of RMAs (~33,097,000) and has a high RMA/LMA ratio (~8,835). This indicates that “mgen” is a memory-intensive workload, but with the poorest locality. To investigate why “mgen” generates so many RMAs, use the up or down key to scroll and highlight “mgen” and press <Enter> to switch to the next window, ”Monitoring the process “mgen””.
2) Figure 2, “Monitoring the process “mgen”” shows the locality characterization and node affinity of “mgen”.
NUMA optimization is concerned about allocating memory on specific nodes to let programs access it as fast as possible. The primary way to do this is to allocate memory for a thread on its local node and keep the thread running there. This is node affinity.
- RPI(K): RMA normalized by 1000 instructions.
- RPI(K) = RMA / (IR / 1000);
- LPI(K): LMA normalized by 1000 instructions.
- LPI(K) = LMA / (IR / 1000);
- CPU%: per-node CPU utilization.
- NODE: the NUMA node ID.
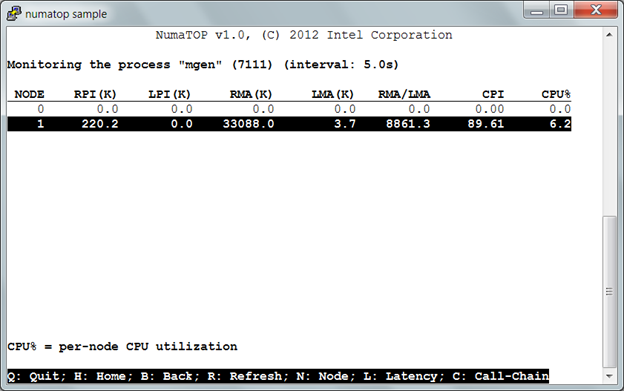
Figure 2. Monitoring the process “mgen”
In Figure 2, the process “mgen” uses 6.2% CPU on Node 1 and generates a huge number of RMAs (~33,000,000) from that node, too. This means the process “mgen” primarily accesses the memory on a remote node and, therefore, shows poor node affinity. You may be interested in exploring the memory areas used by “mgen” to get some clues about why and where so many RMAs are generated. You can press hotkey ‘L’ to switch to the next window, “Monitoring memory areas”.
3) Figure 3, “Monitoring memory areas” shows the memory areas used by “mgen”, percentage of memory accesses to each node, and associated memory access latencies.
- ADDR: starting address of the memory area.
- SIZE: size of the memory area (K/M/G bytes).
- ACCESS%: percentage of memory accesses are to this memory area.
- LAT(ns): the average latency (nanoseconds) of memory accesses.
- DESC: description of memory area (from /proc/<pid>/maps).
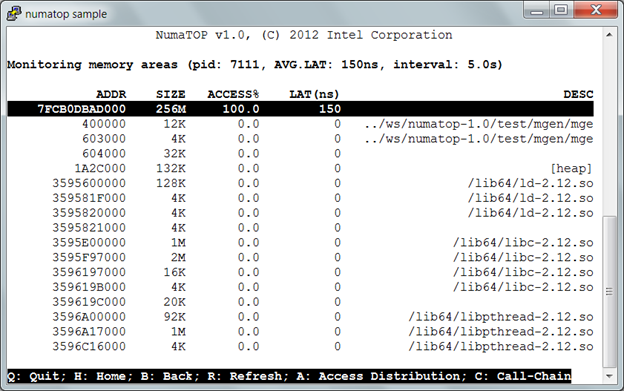
Figure 3. Monitoring memory areas
In Figure 3, by examining the memory use profile for “mgen”, we can see that the first memory area, size “256M”, is currently responsible for all mgen’s memory accesses. Let’s examine where the memory area currently resides. Use the up or down key to select the unnamed “256M” memory area and press <Enter> to switch to the next window, “Break down the memory area into physical memory on the node”.
4) Figure 4, “Break down the memory area into physical memory on the node“ shows which NUMA node the physical memory is allocated to.
In Figure 4, we can see the “256M” memory area is physically allocated on NUMA Node 0. In step 2, we saw that the process “mgen” was running on Node 1, while most of its memory accesses are to the “256M” memory area on Node 0. We now know why so many RMAs are generated by "mgen"
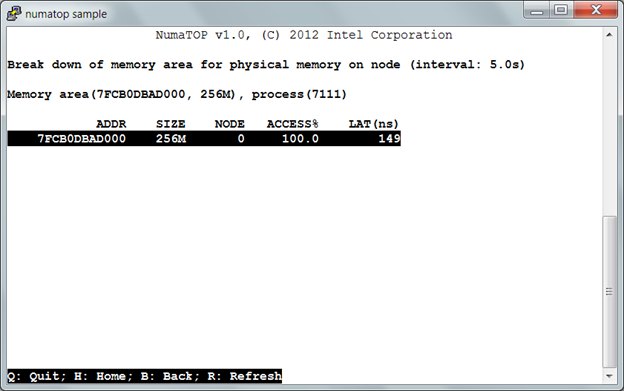
Figure 4. Break down the memory area into physical memory on node
If we want to see an overview of memory accesses originated from “mgen” to each node, we can return to the previous window (see Figure 3) by pressing hotkey “B”. In Figure 3, “Monitoring memory areas”, press hotkey ‘A’ to switch to the ”Memory access node distribution overview” window.
Figure 5, “Memory access node distribution overview” shows the percentage of memory accesses originated from the process “mgen” to each node. The process “mgen” accesses the memory on Node 0 and it doesn’t access the memory on Node 1.
- ACCESS%: percentage of memory accesses are to this node.
- LAT(ns): the average latency (nanoseconds) of memory accesses to this node.
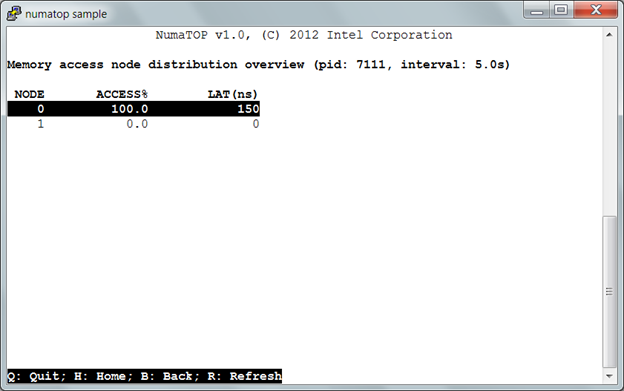
Figure 5. Memory access node distribution overview
Now we have learned why so many RMAs are generated. To find out where in the application the memory accesses originate, use numatop to determine the call-chains to the code that references this memory. First, return to the previous window (see Figure 3) by pressing hotkey “B”. Next, in the “Monitoring memory
areas” window, press hotkey ‘C’ to switch to the “Call-chain when process accesses the memory area” window.
6) Figure 6, “Call-chain when process accesses the memory area” shows a list of call-chains, when you select the “256M” memory area by process “mgen”. In this simple example, we can observe only one call-chain. Obviously, buf_read() is the key function referencing a lot of memory.
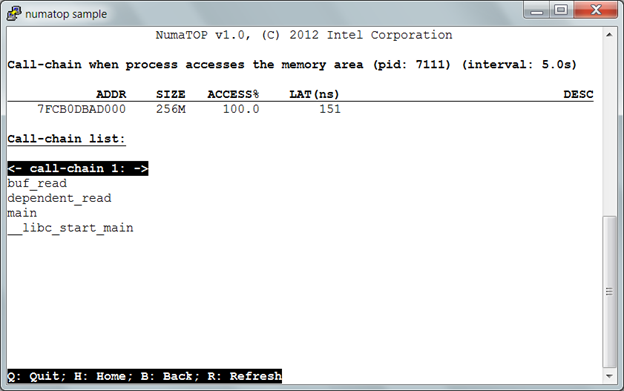
Figure 6. Call-chain when process accesses the memory area
In summary, from above steps 1 ~ 6, we can use numatop to easily figure out the memory-intensive process with the poorest locality in system. We can get more clues, such as the hot memory area(s) in the application, the nodes where the memory is allocated, and where in the application the memory references originate through the call chain. These clues can help system administrators and/or developers tune their applications to get better performance on a NUMA system.
3. Additional numatop features
numatop can also provide additional relevant per-thread and per-node statistics. The per-thread statistics are similar to per-process statistics. The per-node statistics for the system are listed below (see Figure 7).
1) Show the basic per-node statistics for this system (switch to this window by pressing hotkey ‘N’ in the Home window).
- MEM.ALL: total usable RAM (physical RAM minus a few reserved bits and the kernel binary code).
- MEM.FREE: sum of LowFree + HighFree (overall stat).
- LowFree: The amount of free memory of the low memory region. This is the memory the kernel can address directly. All kernel data structures need to be allocated in low memory.
- HighFree: The amount of memory in the high region. This is the memory the kernel uses indirect tricks to access. Data caches can be allocated in this memory region.
- CPU%: per-node CPU utilization.
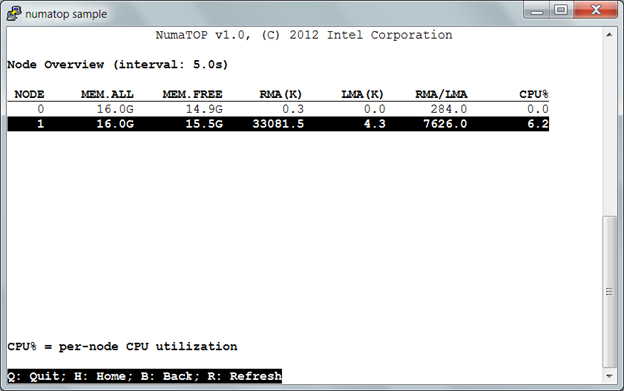
Figure 7. Node overview
In Figure 7, you can use the up or down key to scroll over “NODE 1” and press <Enter> to switch to the next window, “Node 1 information”.
2) Show the memory use and CPU utilization for the selected node.
- CPU: array of logical CPUs which belong to this node
- CPU%: per-node CPU utilization
- MEM active: the amount of memory that has been used more recently and is not usually reclaimed unless absolute necessary
- MEM inactive: the amount of memory that has not been used for a while and is eligible to be swapped to disk
- Dirty: the amount of memory waiting to be written back to the disk
- Writeback: the amount of memory actively being written back to the disk
- Mapped: all pages mapped into a process
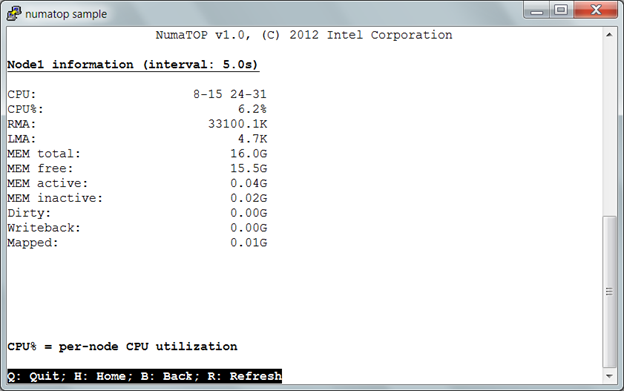
Figure 8. Node N information
4. Potential futures
Future enhancements under consideration include “uncore” features (such as QPI link and memory bandwidth utilization) and kernel memory access locality characterization.