Introduction
Intel® Advisor includes a Memory-Level Roofline feature, which evaluates the data transactions between different memory layers available on your system using cache simulation and provides automatic guidance to improve your application performance. Memory-Level Roofline provides an implementation of the Roofline close to the classical Roofline model by only looking at DRAM data transfers. This article will explain how to generate the classical Roofline model view.
Configure Memory-Level Roofline Model
- Open Intel Advisor, create a project, set up your executable and its parameters.
- In the Project Properties, go to Trip Counts and FLOP Analysis.
- Scroll down and enable the cache simulation. By default, Intel Advisor replicates your system's cache configuration. You can enter custom cache configuration in the text box.
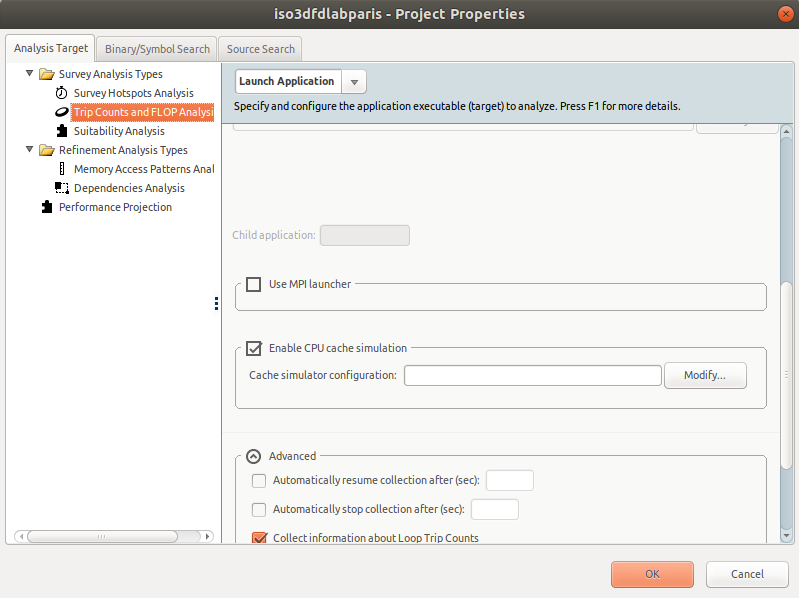
- Once your project is correctly configured, click OK.
Run the Memory-Level Roofline
From the Intel® Advisor GUI
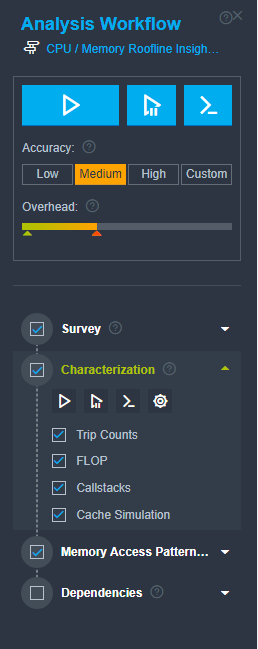
- Select the CPU Roofline / Memory Insights perspective from the Perspective Selector.
- From the Analysis Workflow pane on the lest, select the Medium accuracy level to enable Callstacks and Cache Simulation collections for the Characterization analysis. The callstack collection provides detailed information about loop call stacks, and the cache simulation enables the Memory-Level Roofline.
- Click the Run the perspective
 button and wait while Intel Advisor collects the required data.
Intel Advisor runs two analyses in the background:
- The first one, Survey analysis, uses sampling to measure execution time for your functions and loops. This step adds a small overhead on your runtime (< 2%). The Survey analysis also extracts information from your binary about vectorization and instruction set.
- The second one, Characterization analysis, which includes Trip Counts and FLOP analyses, evaluates what kind of instructions are executed. This analysis counts the number of iterations in your loops as well as the number of integer and floating-point operations. During this step, Intel Advisor also runs cache simulation, providing an estimation of misses and hits on different memory subsystems. Currently, Intel Advisor supports the cache simulation for L1, L2, LLC, and DRAM. This second analysis adds higher overhead (potentially, up to 30x slowdown).
From the Intel® Advisor Command Line Interface
To run the Memory-Level Roofline model from the command line, choose one of the following options:
- Run two command lines one by one to collect Survey and Characterization data (Trip Counts and FLOP) and use --enable-cache-simulation option when running Trip Counts and FLOP:
advisor --collect=survey --project-dir=./my_project -- ./myapp advisor --collect=tripcounts -flop --enable-cache-simulation --project-dir=./my_project -- ./myapp - Run the shortcut Roofline command, which automatically runs the two analyses, with the --enable-cache-simulation option:
advisor --collect=roofline --enable-cache-simulation --project-dir=./my_project -- ./my_app
Read the Results
After the analysis is finished, Intel Advisor will display a Roofline chart. By default, Intel Advisor only shows the Cache-Aware Roofline Model (CARM) with one dot per loop. Many metrics are already available in the Code Analytics tab under the chart.
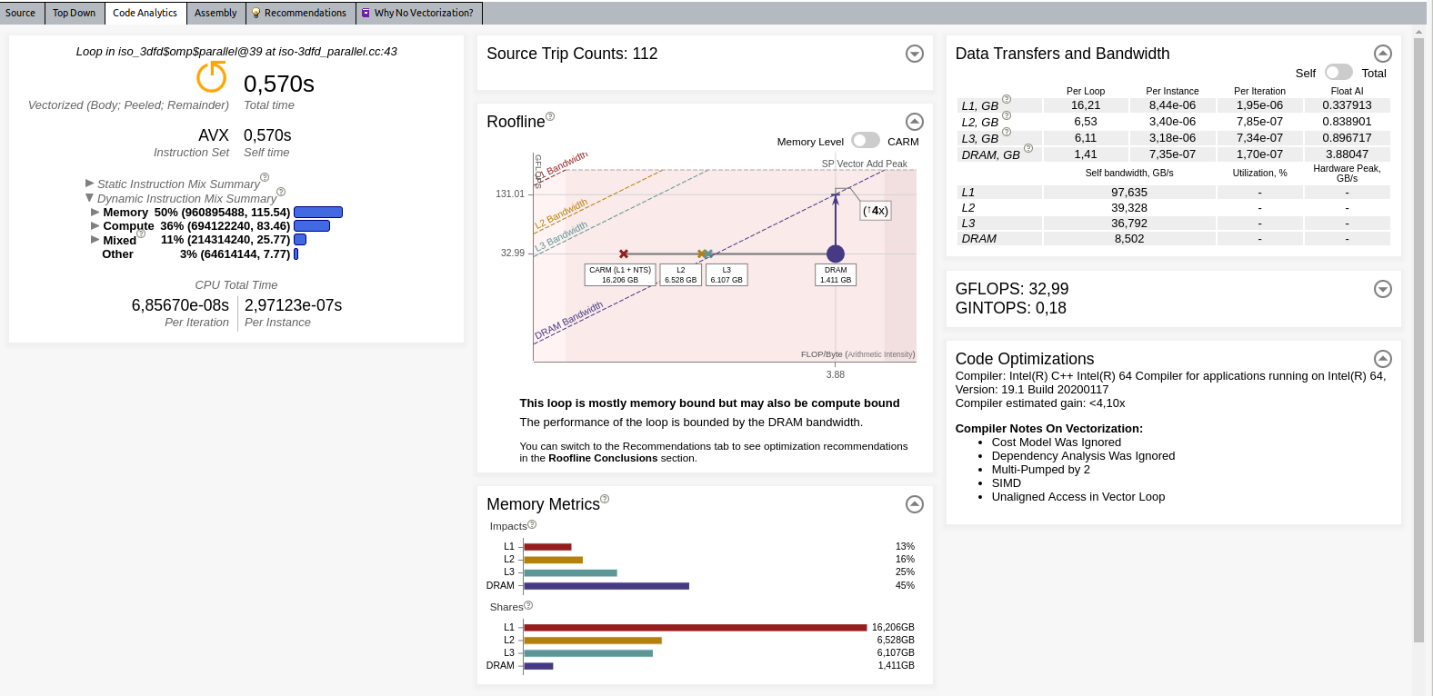
The following sections describe in detail some metrics/information available in the Code Analytics tab.
Roofline
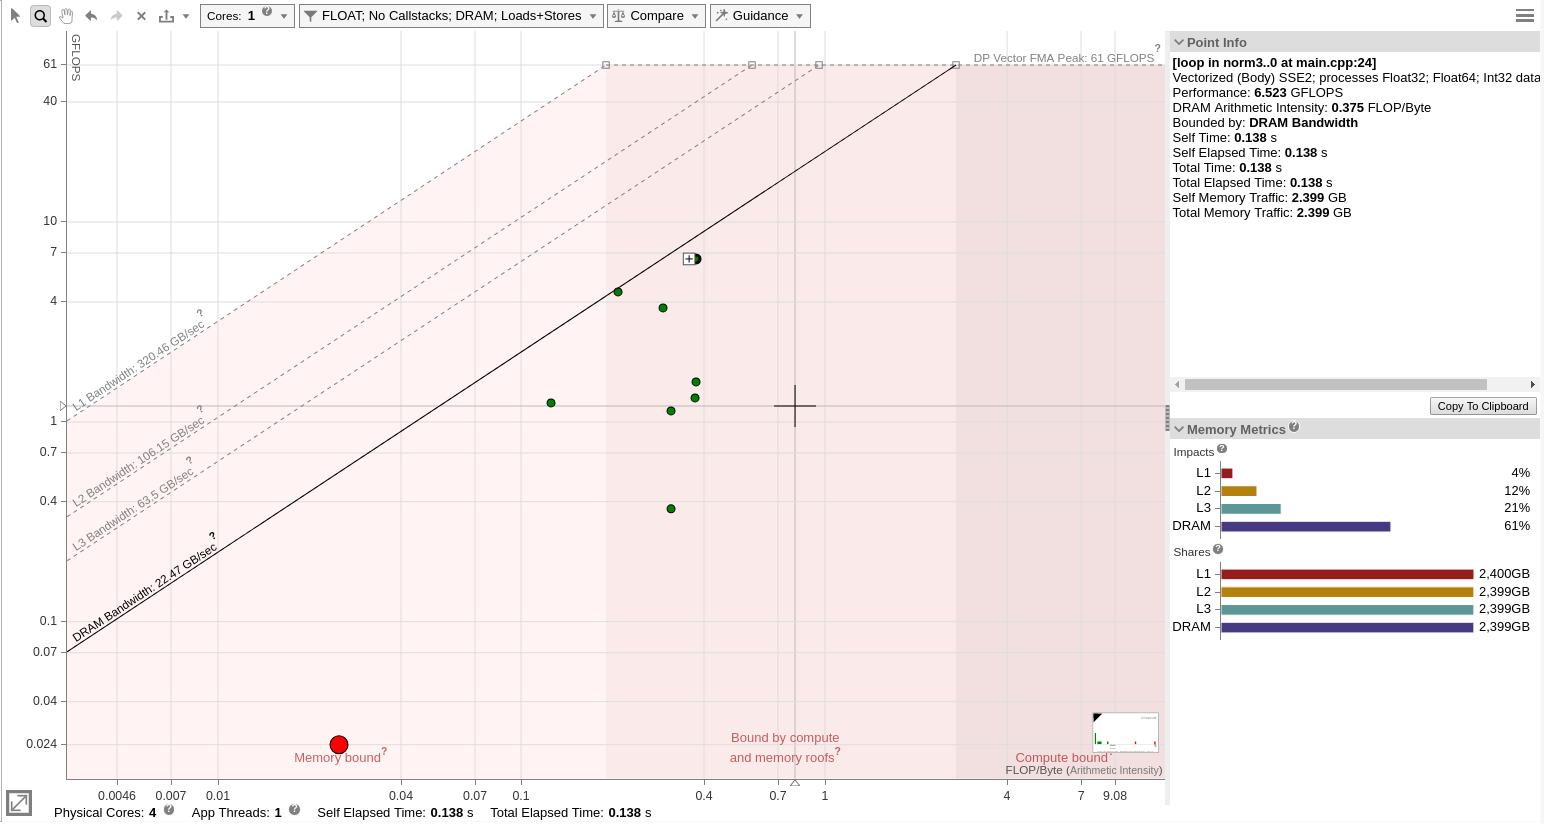
The Roofline pane provides automatic guidance based on the Memory-Level Roofline analysis. In this example, Intel Advisor detects that there is only a potential 4x speed-up possible with respect to the DRAM.
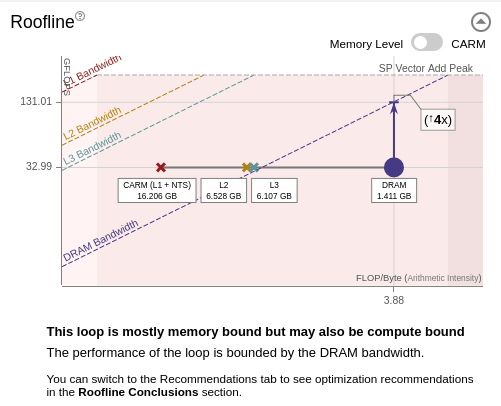
Note: Go to the Recommendation tab to get more detailed advice, such as implementing cache blocking or changing the data structure to reduce memory transfers from the DRAM.
This view shows for dots for a single loop, each dot having the same performance (vertical position) and different arithmetic intensities (horizontal position).
Based on the Roofline model theory, the arithmetic intensity is the ratio of FLOP divided by bytes (operations divided by memory movements). In order to provide these for dots for a single loop, Intel Advisor computes the arithmetic intensity with data coming from the cache simulation and consider the following:
- memory transfers between registers and L1 (CARM dot)
- memory transfers between L1 and L2 (L2 dot)
- memory transfers between L2 and LLC (L3 dot)
- memory transfers between LLC and DRAM (DRAM dot)
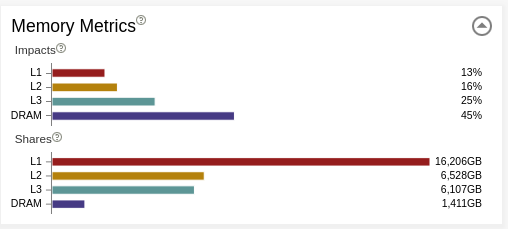
Memory Metrics
Memory Metrics has two sections:
- Impacts shows the percentage of analyzed time that system spends processing requests from different memory levels (L1, L2, L3, DRAM). The widest bar shows where your actual bottleneck is. By looking at the difference between the two largest bars, you can figure out how much throughput you will gain if you reduce the impact on your main bottleneck. It also gives you a long-time plan to reduce your memory limitations as once you solve the problems coming from the widest bar, your next issue will come from the second biggest bar and so on. Ideally, you should see the L1 as the most impactful memory in the application for each loop.
- Shares displays where data is found most of the time for the different memory layers.
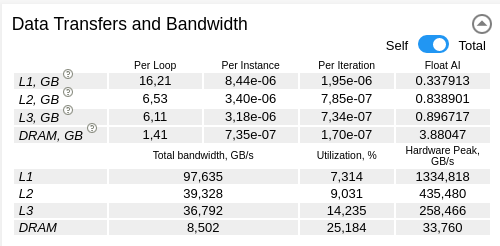
Data Transfers and Bandwidth
Data Transfers and Bandwidth provides memory metrics on different levels (L1, L2, L3 and DRAM). This indicates the amount of data transferred for a single thread (self) or all threads (total), as well as the bandwidth.
Set Up the Memory-Level Roofline
Display the Memory-Level Roofline
By default, Intel Advisor only displays CARM level. To enable the Memory-Level Roofline, from the Roofline chart, open the filter drop-down, select the desired memory levels, and click Apply.
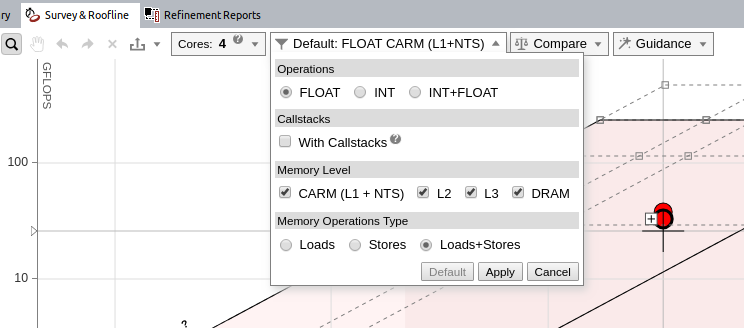
After this step, each loop should show up to four dots.
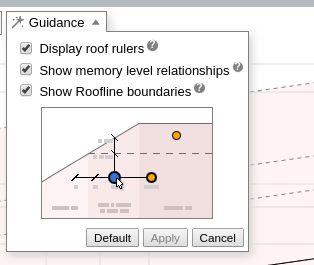
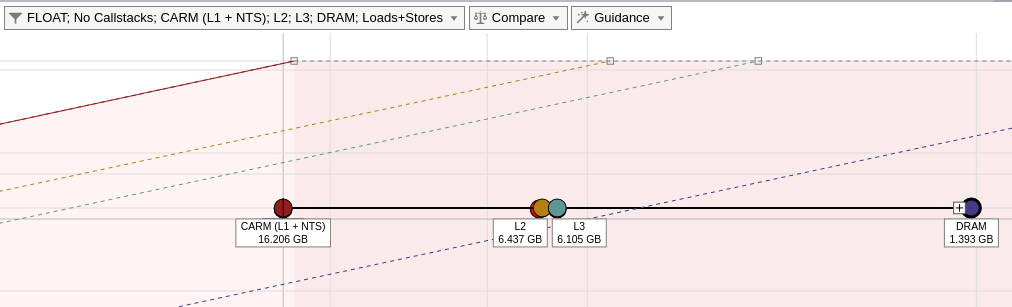
Show Memory-Level Relationships
Memory-Level Roofline can show interactions between all memory levels for a single loop or function. This representation provides similar information as the memory impact view, but in a different way.
To display the relations between Roofline dots for a single kernel, open the Guidance drop-down and select Show memory level relationships and click Apply. Also be sure to select all memory levels from the filter drop-down.
Double-click a dot on the chart to expand it for all memory levels.
- The horizontal distance between dots indicates how efficiently a given cache is used. For example, if your L3 and DRAM dots are very close on the horizontal axis for a single loop, it means that L3 and DRAM usage is similar, and L3 and DRAM are not used efficiently. Improve re-usage of data in DRAM to improve your application performance.
- Projecting dots on their respective rooflines shows how much it is limited by a given memory subsystem. If a dot is close to its roofline, it means that the kernel is limited by the performance of this memory level.
- The order of the dots might also indicate problems with your memory accesses (constant or random strides). In most cases, you would expect to see from left to right for a given loop L1, L2, L3, and DRAM dots. This aspect is for advanced users, but it is a good practice to run the Memory Access Patterns analysis when you see that L1->L2->L3->DRAM order is not preserved.
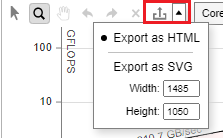
Export HTML Roofline Report
Once the Roofline report is generated, you can export it to the HTML format. This is a very efficient way to save your roofline result at a given optimization step.
To do this, click the Export as HTML icon in the Roofline chart controls:
Classic Roofline Model
The Memory-Level Roofline model allows you to generate the classical Roofline model, initially introduced by Berkley university based on DRAM data transfers. Many high-performance computing applications are bounded by data transfers coming from the DRAM. Classical Roofline offers a way to determine which kernels are close to DRAM bandwidth. When a loop is reaching the DRAM performance, you should find a way to reduce the memory impact for this loop by implementing cache blocking or adapting the data structure when it is possible.
To display the classical Roofline, select only DRAM memory level from the filter drop-down. Hover over a dot to see how far you are from reaching the maximum performance based on your DRAM memory accesses.
Usage Models
The Memory-Level Roofline model in Intel Advisor comes with new interface features and we recommend two usage models based on your preferences:
- Focus on the Roofline chart to navigate through different hotspots and understand the memory impacts. This usage model uses both the Roofline chart and the Memory Impacts and is perfectly suited for a high-level characterization of an application and its loops and functions.
- Use both the Roofline chart and the Code Analytics tab, which offers advanced details and recommendations on how to improve the performance of a selected loop.
We recommend you starting with the Roofline-only view to get a first characterization of the application and then to move to the Roofline + Code Analytics.
Use Only Roofline Report
Once the Roofline data is collected, expend the Roofline view by moving the vertical bar separating Roofline from Code Analytics.
To display memory impacts and shares, click the right side of your screen as shown on the figure. This will open panes with additional metrics on the right hand side.
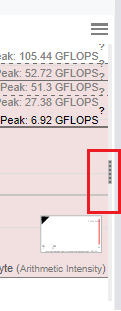
To clear the Roofline view, disable all unnecessary information, for example, unnecessary rooflines. To do this, open the configuration menu on the right-hand side Image.
In our case, the test example uses only double precision and we are only interested in the FMA peak. We want to keep only L1, L2, L3 and DRAM bandwidth as well as FMA peak.
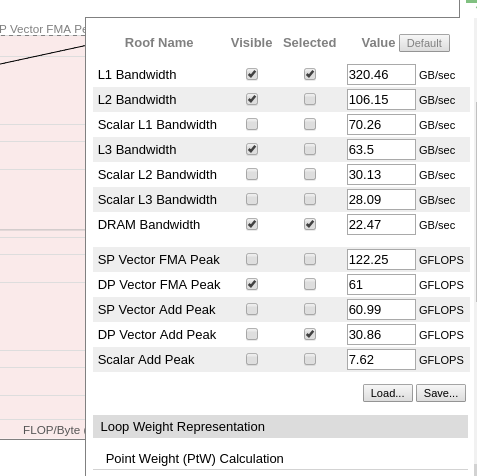
Once the modifications are validated, it gives a nicer view of the roofline. We also enabled data from the DRAM only to display the classic Roofline model
You can select each loop or function, represented by a dot, and see how the kernel is consuming the data from different memory subsystems. Navigating between the kernels, you can see whether your application is limited by memory accesses or by compute. Large red loops represent parts of the code where application spends most of the time.
In this example, the selected loop shows 61% impact from the DRAM meaning that this current bottleneck is accessing or writing data from the DRAM. Assuming that we want more details on the next step to improve this loop, we can open the Code Analytics on the bottom of the screen and use the second usage model.
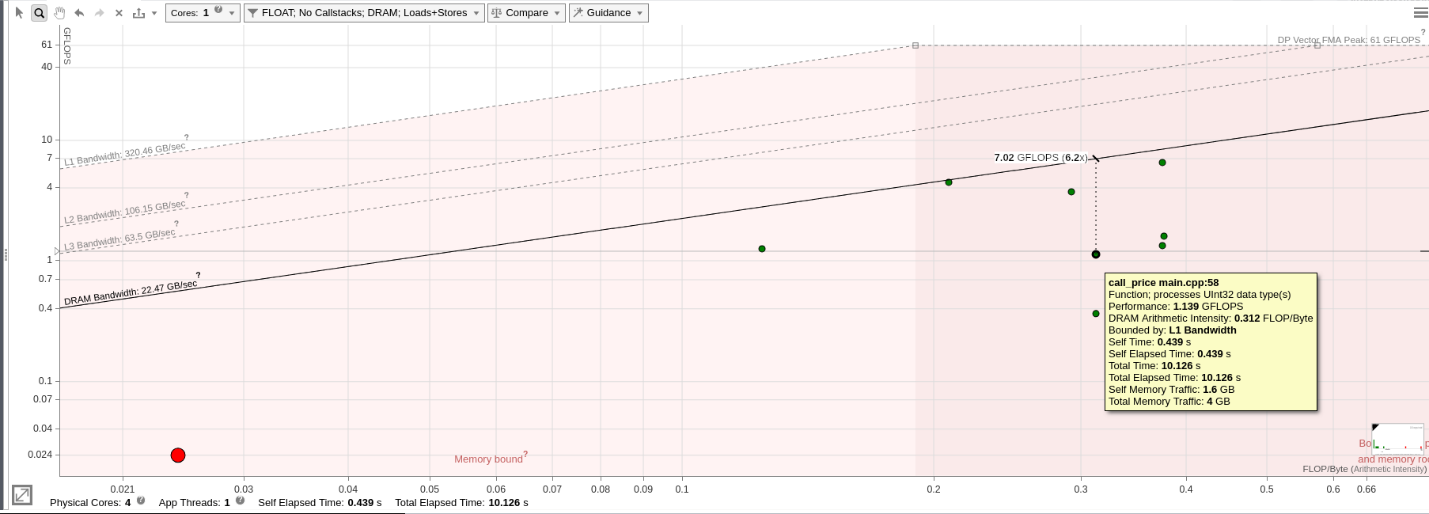
Use Roofline Chart with Code Analytics
In this model, we view the Roofline chart and the Code Analytics to better understand where the limitation comes from. This model also offers recommendations helping you to solve the current bottleneck.
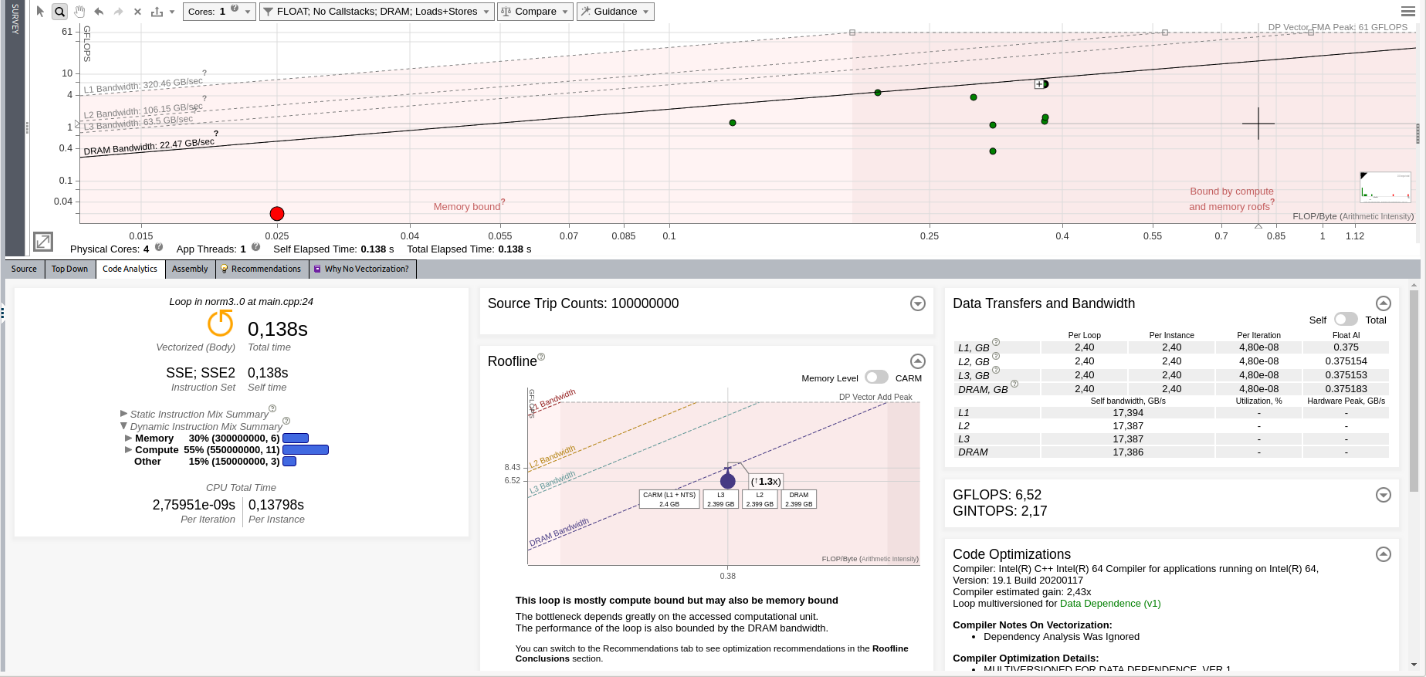
Here, we can take advantage of the Roofline pane in Code Analytics that informs that the loop is compute bound but that the performance is also limited by memory. Intel Advisor provides more recommendations for solving this issue in the recommendation tab.
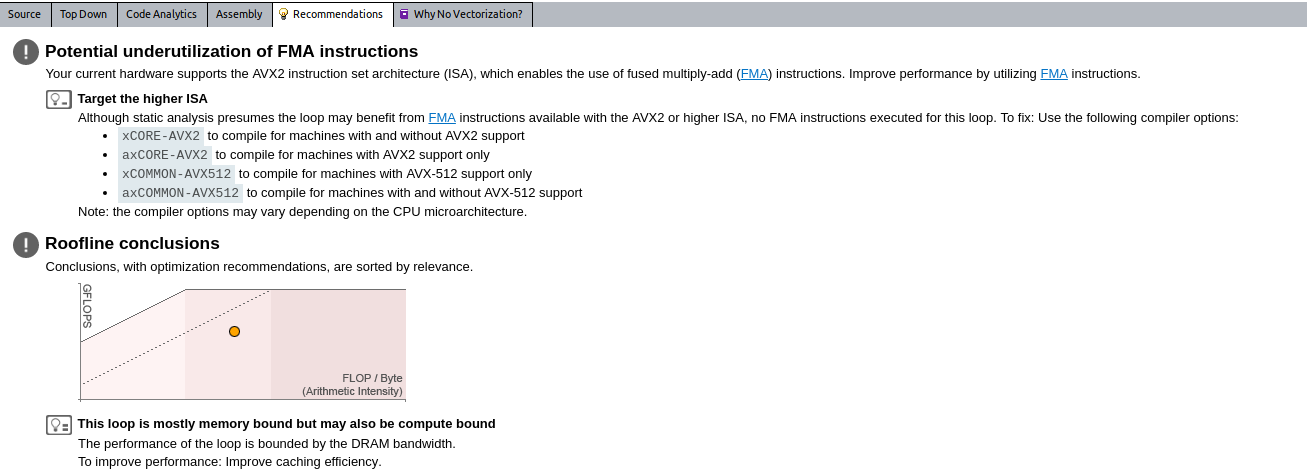
For example, here Intel Advisor detects two potential issues:
- The instruction set does not match the platform and more efficient computations is possible.
- The loop is memory bound, and you are recommended to improve cache efficiency. For example, you can implement cache blocking.
The recommendations are specific to each loop and will change when you select a different loop on the Roofline chart.
Use Roofline with iso3DFD Application
Introduction
Iso3dfd is a wave-propagation kernel based on finite differences. The code is small but provides room for several kinds of optimization. In this example, we will try to detect and solve several performance issues, only using Intel Advisor recommendations.
Collect Baseline Results
In the original code before optimization, most of computations are located in the same function:
void iso_3dfd_it(float *ptr_next,  float *ptr_prev,  float *ptr_vel,   float *coeff,
const int n1, const int n2, const int n3, const int num_threads,
const int n1_Tblock, const int n2_Tblock, const int n3_Tblock){

   int dimn1n2 = n1*n2;

   for(int ix=HALF_LENGTH; ix<n1-HALF_LENGTH; ix++) {
      for(int iy=HALF_LENGTH; iy<n2-HALF_LENGTH; iy++) {
         for(int iz=HALF_LENGTH; iz<n3-HALF_LENGTH; iz++) {
            int offset = iz*dimn1n2 + iy*n1 + ix;
            float value = 0.0;
            value += ptr_prev[offset]*coeff[0];
            for(int ir=1; ir<=HALF_LENGTH; ir++) {
               value += coeff[ir] * (ptr_prev[offset + ir] + ptr_prev[offset - ir]);
               value += coeff[ir] * (ptr_prev[offset + ir*n1] + ptr_prev[offset - ir*n1]);
               value += coeff[ir] * (ptr_prev[offset + ir*dimn1n2] + ptr_prev[offset - ir*dimn1n2]);
            }
            ptr_next[offset] = 2.0f* ptr_prev[offset] - ptr_next[offset] + value*ptr_vel[offset];
         }
      }
   }
}
To get the baseline results for the original code:
- Compile the code. For this first test, we are going to use the following options:
- -O2: To request moderate optimization, which provides a good starting point for compiler optimizations.
- -g: Enable debug information.
- -xCORE-AVX2: Enable Intel® Advanced Vector Extensions 2 (Intel® AVX2) instruction set.
- -qopenmp: Enable threading.
- Open Intel Advisor and set up the analysis for the Memory-Level Roofline Model.
- Switch to the Roofline view and select the main loop. You should see the following:
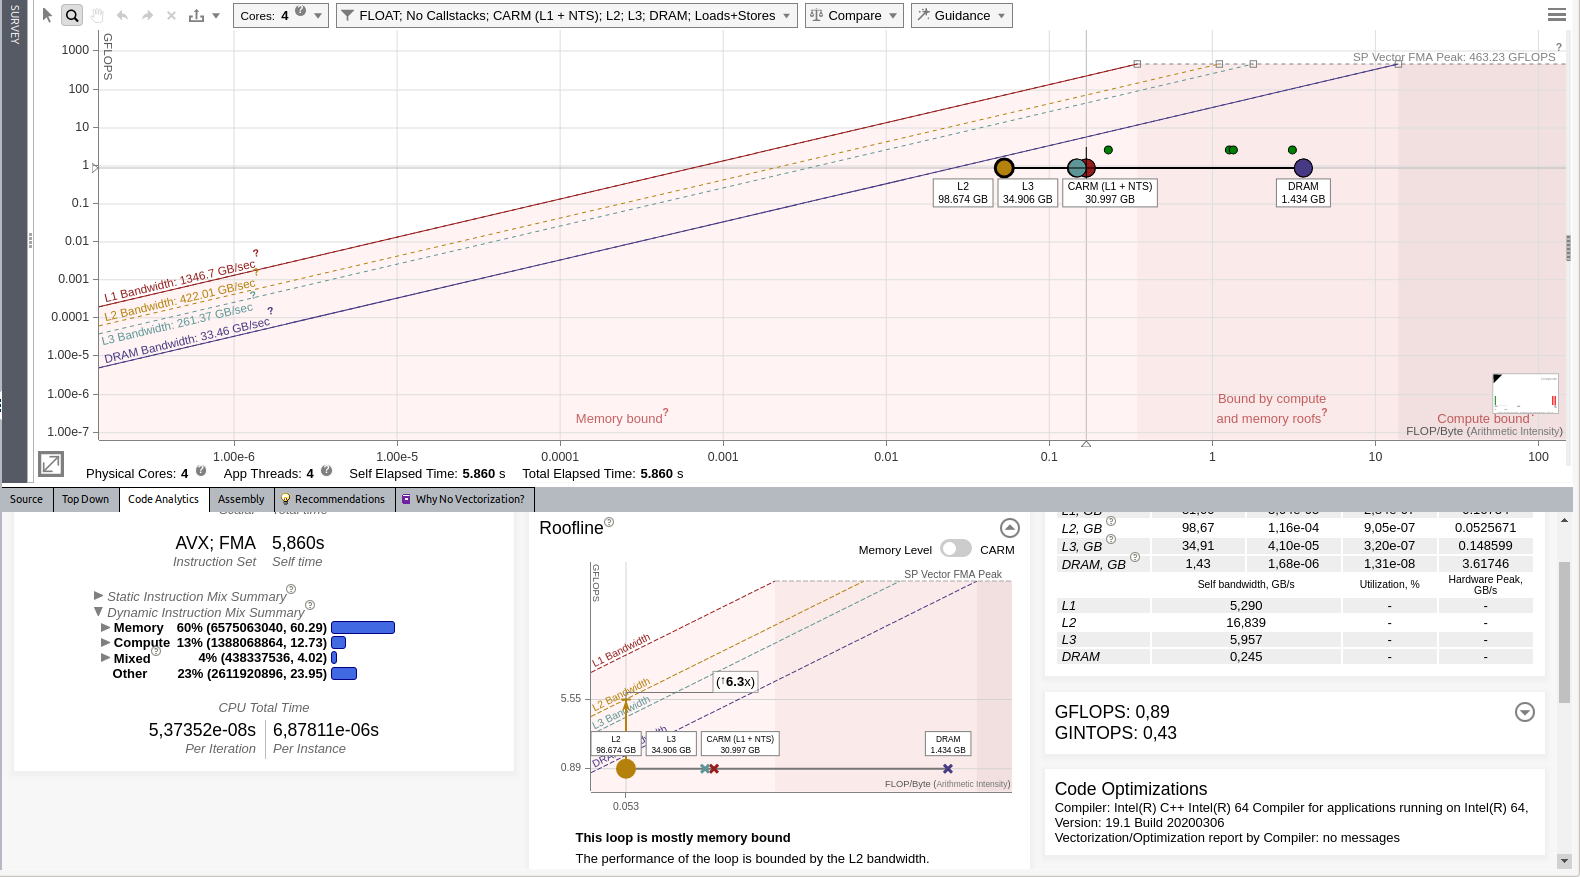
See the following important data:
- Intel Advisor reports that this loop is scalar (not vectorized). We might be able to get some improvements by forcing vectorization.
- Intel Advisor reports that the loop is mostly memory bound and that L2 seems to be an issue.
The use case focuses on the first aspect. Switch to the tab Why No Vectorization to see additional details regarding what prevents efficient vectorization.
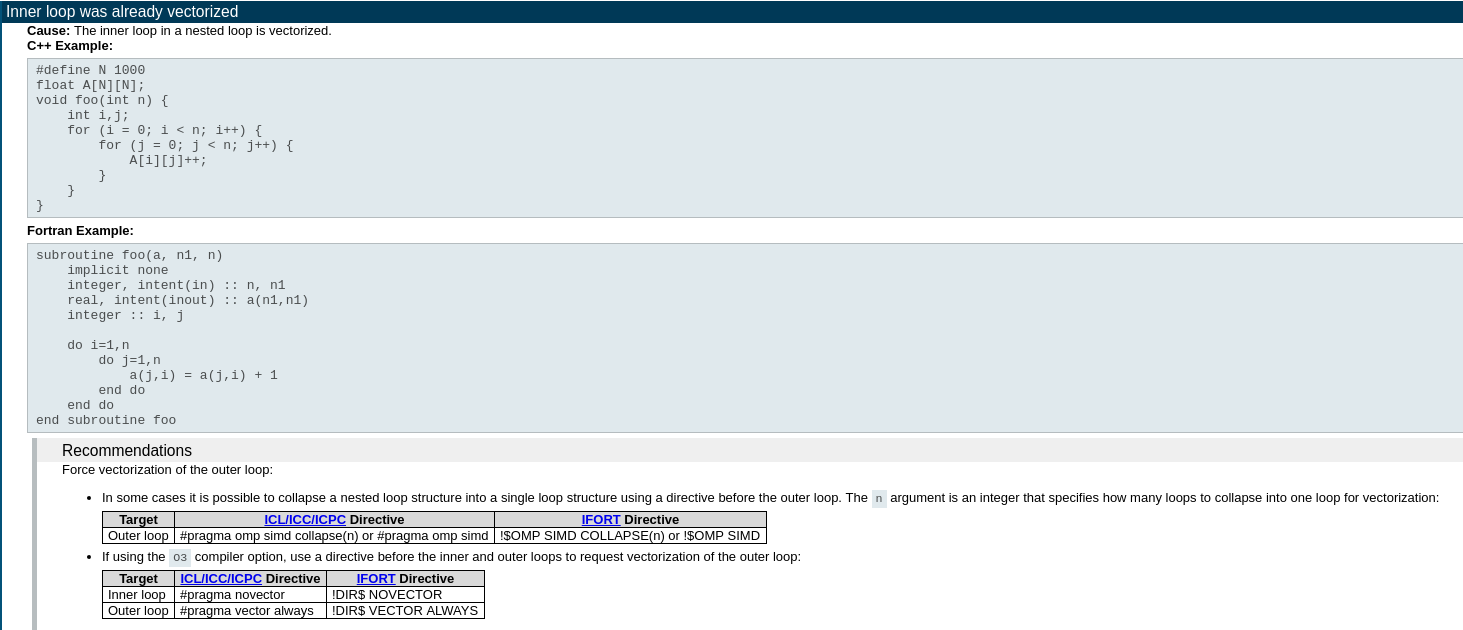
As you can see, the compiler already vectorized the inner loop and Intel Advisor recommends you verifying if vectorization is possible on the outer loop. To enable outer loop vectorization, you need to slightly modify the code and add OpenMP* directives.
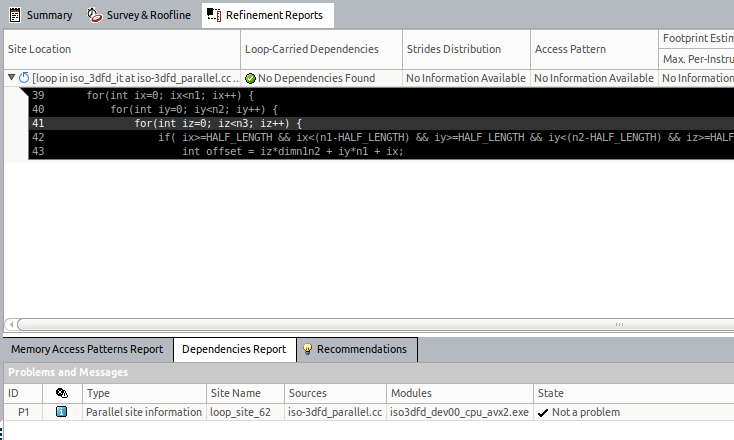
If you are not sure that forcing vectorization is safe, as it might break your results if you have data dependency, Intel Advisor has a Dependency Analysis. To run it:
- Go to the Survey report.
- From the selection column of the report, select your loop(s) of interest.
- From the Analysis Workflow pane on the left, select only the Dependencies analysis step.
- Click the Run the perspective button.
The result of this analysis reports that no dependency was found. It is safe to force vectorization of the outer loop.
Enable Vectorization
To enable vectorization on the outer loop, add the following directive just before the loop you want to vectorize:
#pragma omp simd
NOTE: This directive requires that your application is compiled with -qopenmp or -qopenmp-simd.
Your code should look as follows:
void iso_3dfd_it(float *ptr_next,  float *ptr_prev,  float *ptr_vel,   float *coeff,
const int n1, const int n2, const int n3, const int num_threads,
const int n1_Tblock, const int n2_Tblock, const int n3_Tblock){

   int dimn1n2 = n1*n2;

   for(int ix=HALF_LENGTH; ix<n1-HALF_LENGTH; ix++) {
      for(int iy=HALF_LENGTH; iy<n2-HALF_LENGTH; iy++) {
         #pragma omp simd
         for(int iz=HALF_LENGTH; iz<n3-HALF_LENGTH; iz++) {
            int offset = iz*dimn1n2 + iy*n1 + ix;
            float value = 0.0;
            value += ptr_prev[offset]*coeff[0];
            for(int ir=1; ir<=HALF_LENGTH; ir++) {
               value += coeff[ir] * (ptr_prev[offset + ir] + ptr_prev[offset - ir]);
               value += coeff[ir] * (ptr_prev[offset + ir*n1] + ptr_prev[offset - ir*n1]);
               value += coeff[ir] * (ptr_prev[offset + ir*dimn1n2] + ptr_prev[offset - ir*dimn1n2]);
            }
            ptr_next[offset] = 2.0f* ptr_prev[offset] - ptr_next[offset] + value*ptr_vel[offset];
         }
      }
   }
}
To verify the optimization applied, compile the code and re-run the Roofline analysis.
Improve Memory Accesses
After you re-run the Roofline analysis, you should see that the main loop is vectorized. In the baseline result, Intel Advisor reported 0,89 GFLOP/s, now, it reports 1,03 GFLOP/s. This improvement is rather low assuming that Intel AVX2 can potentially improve performance in 8x on a single precision.
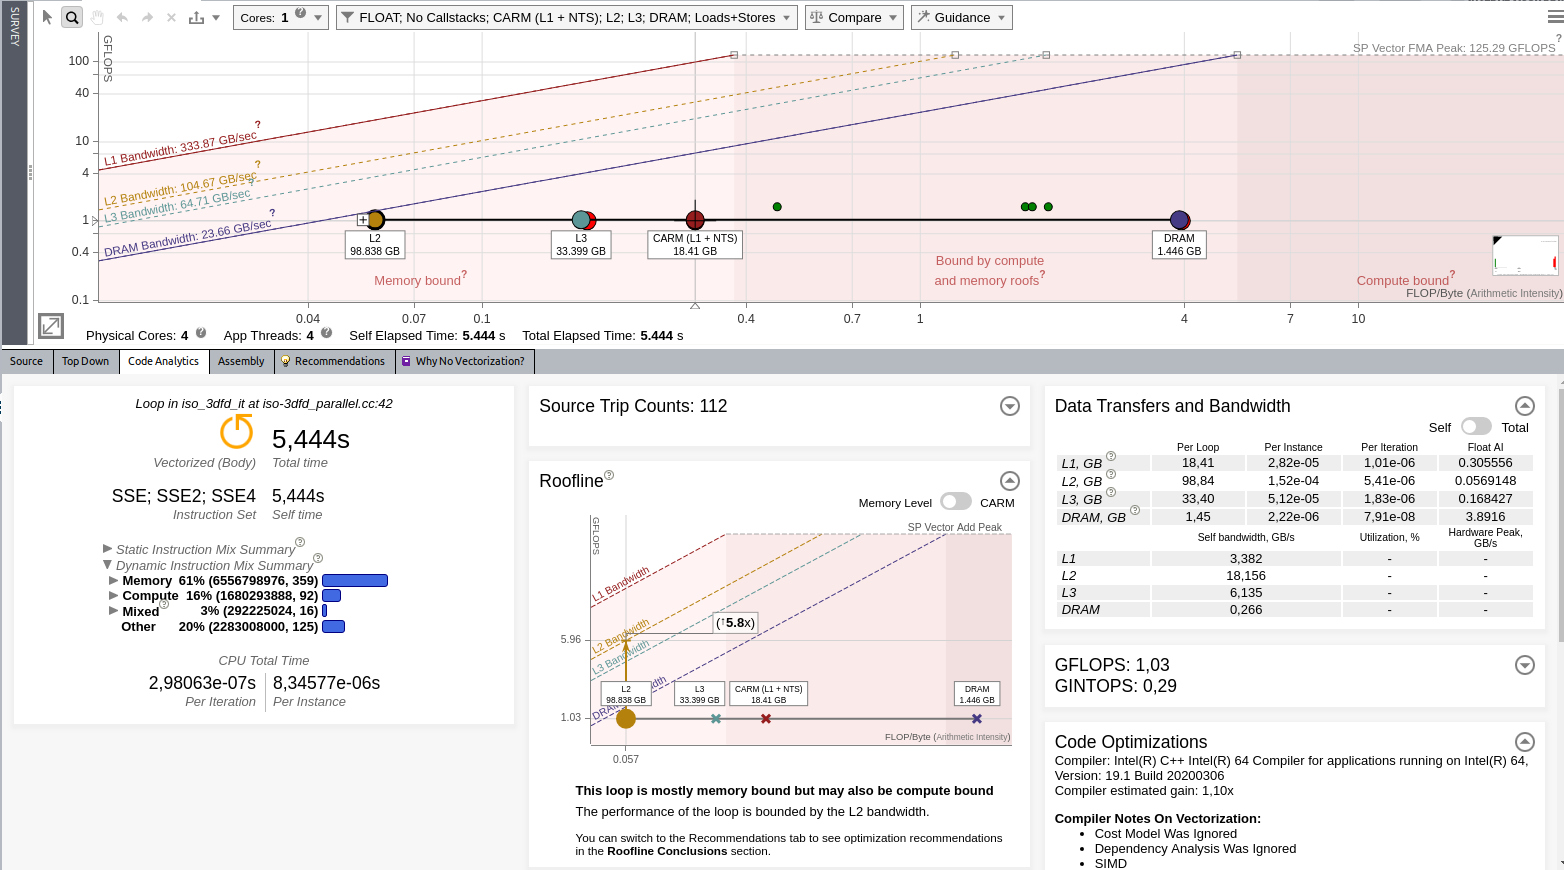
Intel Advisor still reports issues with the memory: the application is limited by L2 cache. Open the Recommendations tab that suggests optimizations to improve your code performance. In this case, Intel Advisor recommends you to run the Memory Access Pattern analysis.
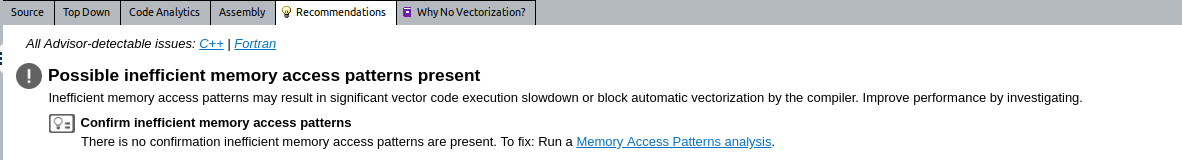
To run the Memory Access Patterns analysis:
- Go to the Survey report.
- From the selection column of the report, select the main hotspot.
- From the Analysis Workflow pane on the left, select only the Memory Access Patterns analysis step.
- Click the Run the perspective button.
This analysis monitors all memory accesses and extracts patterns. It can detect four types of patterns:
- Uniform stride: Each iteration, loop/function accesses the same address.
- Unit stride: Memory cells are accessed in a consecutive order in memory. This improves a lot cache reusage and is usually what a developer want to achieve
- Constant stride: For each new iteration, the program access the same data structure with a constant padding, This is usually what happens when your data structure is built on the array of structures model. As much as possible, you would want to avoid this pattern and modify the data layout to move to unit strides. Another reason for this pattern is a wrong iteration order in second or third arrays. This can negatively impact the performance.
- Random accesses: This case is bad in term of memory access but is usually difficult to avoid. Indirect addressing is one cause of this pattern.
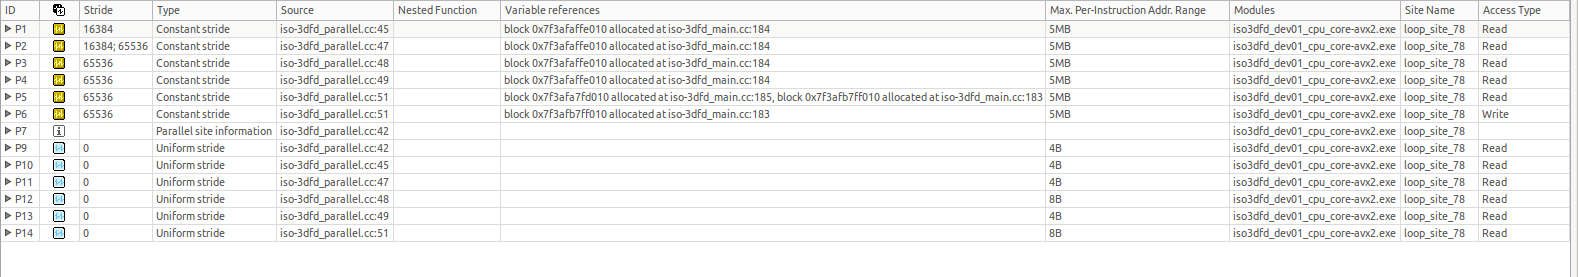
In our example, Intel Advisor reports many constant strides. Looking at the line where these constant strides are reported, see that our iterations are not in the most optimized order. Ideally, you would want to increase the addresses by 1 for every new iteration. It means that the loop P9 should be the innermost loop.
Reverse the loops as follows to solve the access problem:
void iso_3dfd_it(float *ptr_next,  float *ptr_prev,  float *ptr_vel,   float *coeff,
const int n1, const int n2, const int n3, const int num_threads,
const int n1_Tblock, const int n2_Tblock, const int n3_Tblock){

   int dimn1n2 = n1*n2;

   for(int iz=HALF_LENGTH; iz<n3-HALF_LENGTH; iz++) {
      for(int iy=HALF_LENGTH; iy<n2-HALF_LENGTH; iy++) {
         #pragma omp simd
         for(int ix=HALF_LENGTH; ix<n1-HALF_LENGTH; ix++) {
            int offset = iz*dimn1n2 + iy*n1 + ix;
            float value = 0.0;
            value += ptr_prev[offset]*coeff[0];
            for(int ir=1; ir<=HALF_LENGTH; ir++) {
               value += coeff[ir] * (ptr_prev[offset + ir] + ptr_prev[offset - ir]);
               value += coeff[ir] * (ptr_prev[offset + ir*n1] + ptr_prev[offset - ir*n1]);
               value += coeff[ir] * (ptr_prev[offset + ir*dimn1n2] + ptr_prev[offset - ir*dimn1n2]);
            }
            ptr_next[offset] = 2.0f* ptr_prev[offset] - ptr_next[offset] + value*ptr_vel[offset];
         }
      }
   }
}
Add Threading Parallelism
Now, Intel Advisor reports 8,68 GFLOP/s. It also reports potential improvement of only 6.7x due to L3 limitation. We will handle this problem later.
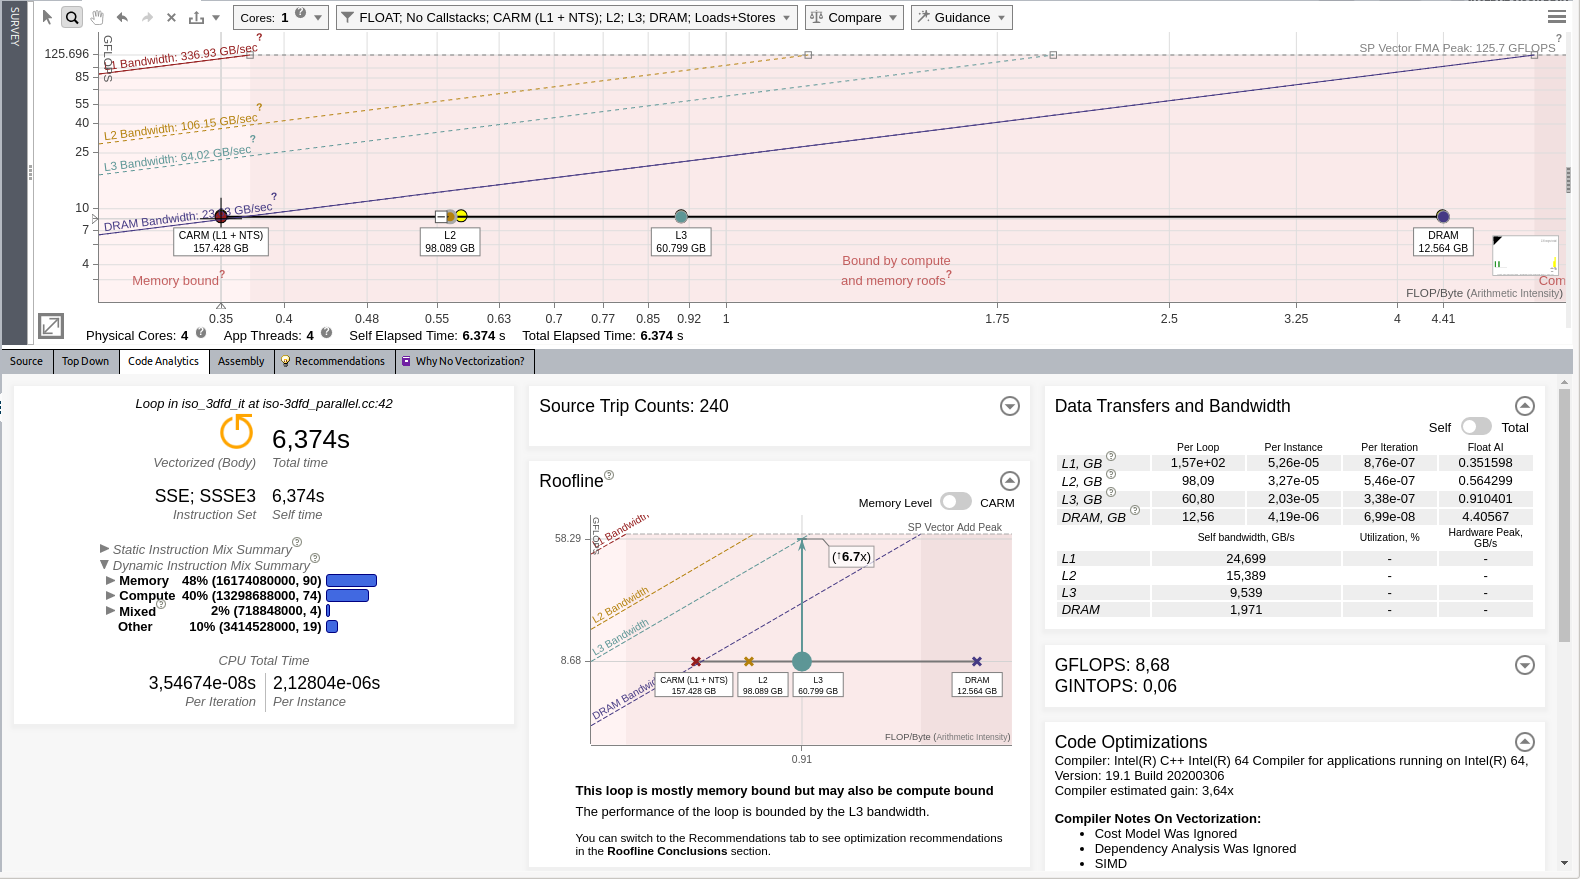
As the application still does not use the full core capabilities, we are first going to add parallelism.
void iso_3dfd_it(float *ptr_next,  float *ptr_prev,  float *ptr_vel,   float *coeff,
const int n1, const int n2, const int n3, const int num_threads,
const int n1_Tblock, const int n2_Tblock, const int n3_Tblock){

   int dimn1n2 = n1*n2;
   #pragma omp parallel for
   for(int iz=HALF_LENGTH; iz<n3-HALF_LENGTH; iz++) {
      for(int iy=HALF_LENGTH; iy<n2-HALF_LENGTH; iy++) {
         #pragma omp simd
         for(int ix=HALF_LENGTH; ix<n1-HALF_LENGTH; ix++) {
            int offset = iz*dimn1n2 + iy*n1 + ix;
            float value = 0.0;
            value += ptr_prev[offset]*coeff[0];
            for(int ir=1; ir<=HALF_LENGTH; ir++) {
               value += coeff[ir] * (ptr_prev[offset + ir] + ptr_prev[offset - ir]);
               value += coeff[ir] * (ptr_prev[offset + ir*n1] + ptr_prev[offset - ir*n1]);
               value += coeff[ir] * (ptr_prev[offset + ir*dimn1n2] + ptr_prev[offset - ir*dimn1n2]);
            }
            ptr_next[offset] = 2.0f* ptr_prev[offset] - ptr_next[offset] + value*ptr_vel[offset];
         }
      }
   }
}
Re-run the Roofline analysis on this optimized version of the application.
Optimize Cache Reuse
After we added the threading parallelism, the performance improved from 8.68 GFLOP/s to 16.54 GFLOP/s. Though the application was executed on a machine with four physical cores, we only get a speed-up close to 2x. This means that something else limits the performance. As the Roofline report shows, the loop is getting very close to the DRAM roofline.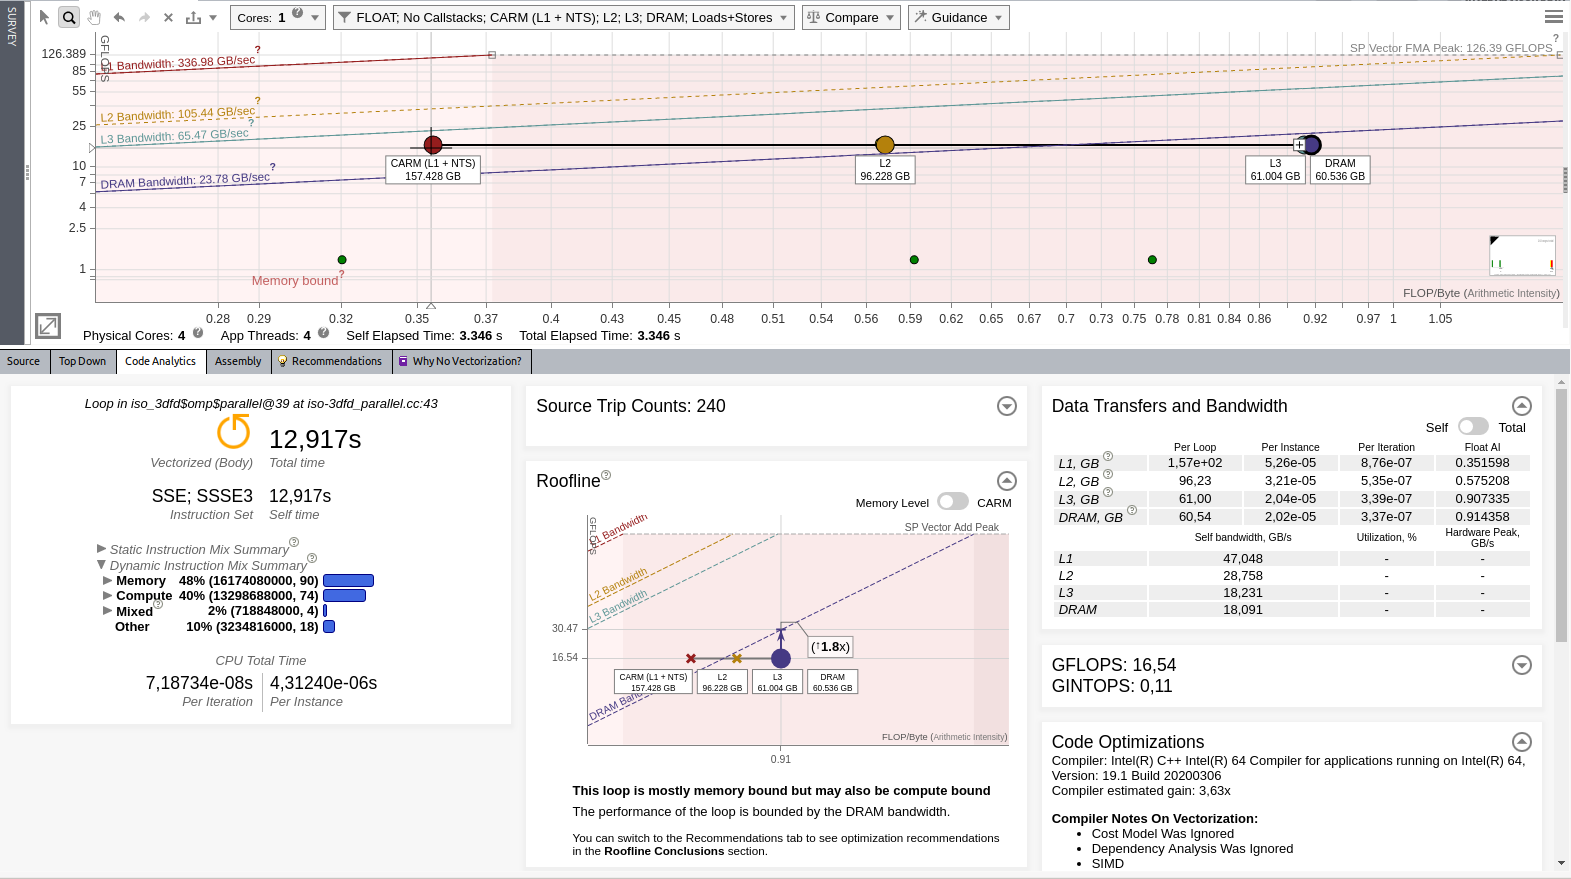
This means that the loop spends time streaming data to and from the DRAM. Intel Advisor recommends to improve cache efficiency. Add the cache blocking as follows to improve cache efficiency:
void iso_3dfd_it(float *ptr_next,  float *ptr_prev,  float *ptr_vel,   float *coeff,
const int n1, const int n2, const int n3, const int num_threads,
const int n1_Tblock, const int n2_Tblock, const int n3_Tblock){
   int dimn1n2 = n1*n2;
   #pragma omp parallel for
   for(int cbZ=HALF_LENGTH; cbZ<n3-HALF_LENGTH; cbZ+=n3_Tblock){
      for(int cbY=HALF_LENGTH; cbY<n2-HALF_LENGTH; cbY+=n2_Tblock){
         for(int cbX=HALF_LENGTH; cbX<n1-HALF_LENGTH; cbX+=n1_Tblock){
            int izend = (cbZ + n3_Tblock) > n3-HALF_LENGTH ? n3-HALF_LENGTH : cbZ + n3_Tblock;
            int iyend = (cbY + n2_Tblock) > n2-HALF_LENGTH ? n2-HALF_LENGTH : cbY + n2_Tblock;
            int ixend = (cbX + n1_Tblock) > n1-HALF_LENGTH ? n1-HALF_LENGTH : cbX + n1_Tblock;
            for(int iz=cbZ; iz<izend; iz++) {
            for(int iy=cbY; iy<iyend; iy++) {
               #pragma omp simd
               for(int ix=cbX; ix<ixend; ix++) {
               int offset = iz*dimn1n2 + iy*n1 + ix;
               float value = 0.0;
               value += ptr_prev[offset]*coeff[0];
               for(int ir=1; ir<=HALF_LENGTH; ir++) {
                  value += coeff[ir] * (ptr_prev[offset + ir] + ptr_prev[offset - ir]);
                  value += coeff[ir] * (ptr_prev[offset + ir*n1] + ptr_prev[offset - ir*n1]);
                  value += coeff[ir] * (ptr_prev[offset + ir*dimn1n2] + ptr_prev[offset - ir*dimn1n2]);
               }
               ptr_next[offset] = 2.0f* ptr_prev[offset] - ptr_next[offset] + value*ptr_vel[offset];
            }
            }
         }
      }
   }
}


                        }
To get an optimal speed, set cbZ=16, cbY=2, and cbX=[whole dimension].
Re-run the Roofline to evaluate the performance after optimization. You should see the following result:
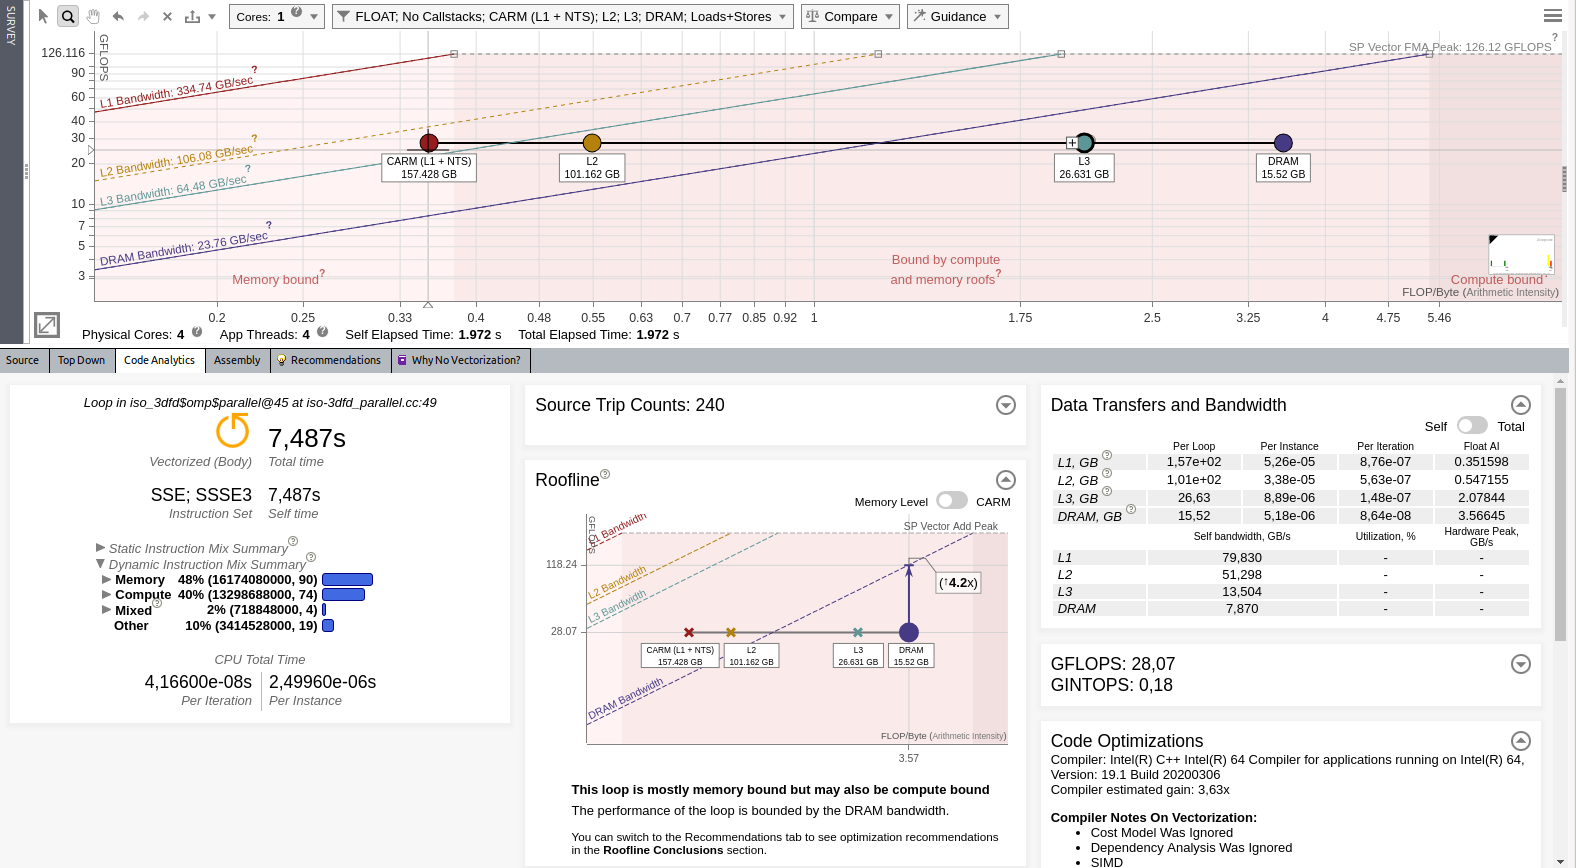
Intel Advisor reports 28,07 GFLOP/s.
Compare the Roofline Results
Intel Advisor allows you to compare Roofline reports. Compare the two last reports to get interesting insights:
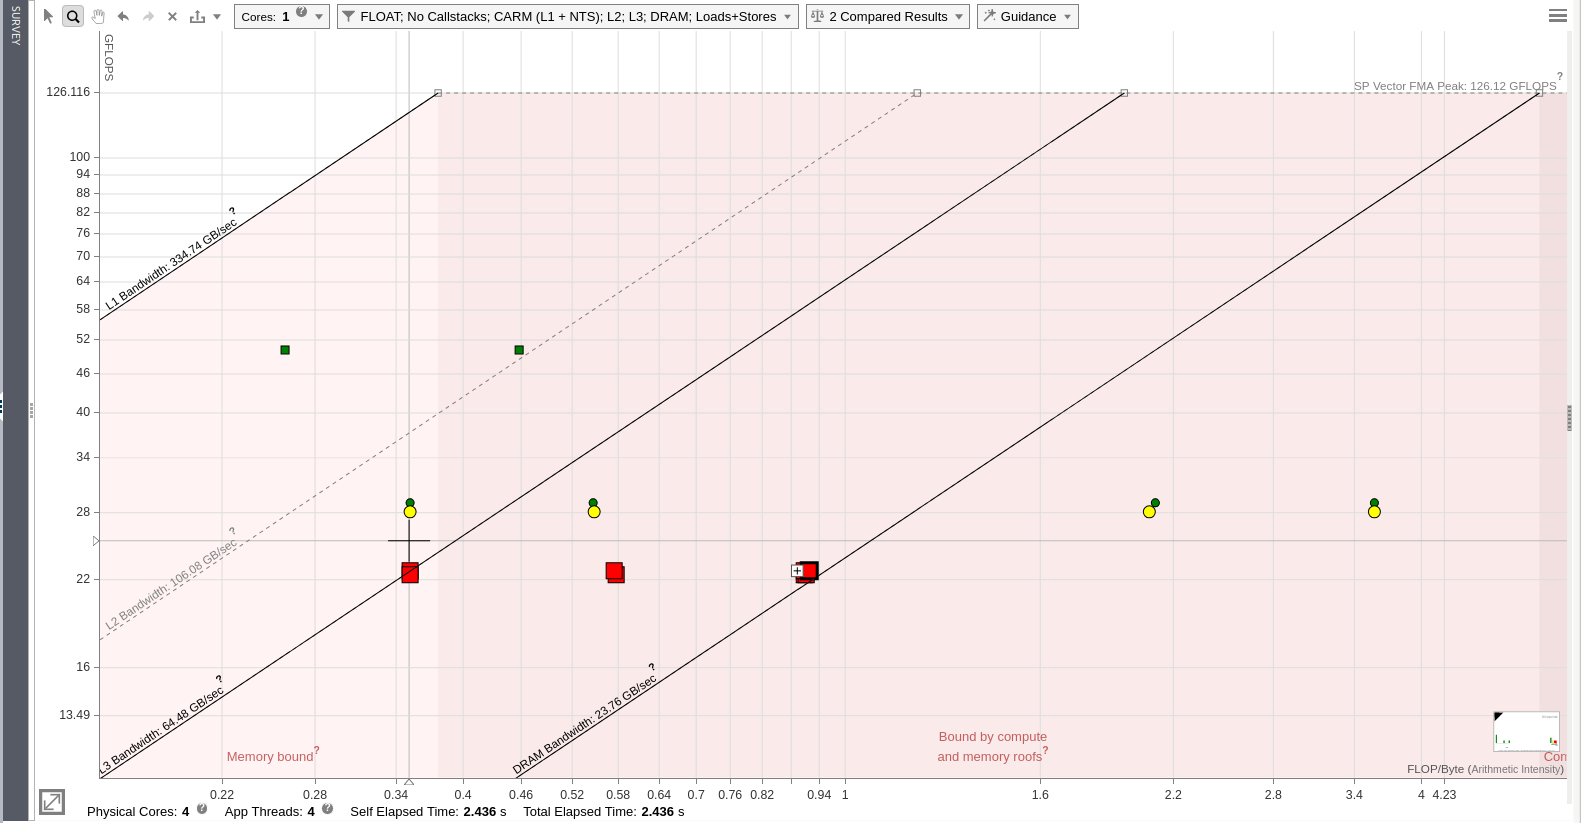
The dots indicate the last version of the optimized code after adding cache blocking and the squares indicate the previous version after adding threading. You can see that the cache blocking helped to move the L3 and DRAM dots to the right, providing more headroom.
Conclusion
This article demonstrated how Intel Advisor can help with optimizing your application, improving performance from 0,89 GFLOP/s to 28 GFLOP/s. Without specific hardware knowledge and just by following the recommendations, you can significantly improve your code performance. The Roofline model provides many benefits in understanding what can go wrong in an application. On the last version of the code optimization, you can see that it is very close to the peak of the machine capabilities and next optimization steps might require a lot of effort for small gains.
Learn More
You can download the Intel Advisor as part of Intel® oneAPI Base Toolkit or as a standalone. Intel® oneAPI products provide a unified toolset to develop and deploy applications across multiple architectures, including CPUs, GPUs and FPGAs. It gives users the freedom to focus on their code instead of the underlying mechanism that generates the best possible machine instructions.
For more information, see:
- Intel® oneAPI
- Intel® oneAPI Toolkits
- Intel Advisor
- Intel Advisor User Guide: CPU Roofline / Memory Insights