In ongoing development since 2003 by Wildfire Games, 0 A.D.* is a free, open source real-time strategy game taking place in antiquity, similar to the 1997 classic, Age of Empires*. The game and its custom-made Pyrogenesis engine are written in a combination of C++ and Javascript. Having been built from the ground up, 0 A.D. is free from the usual licensing requirements associated with existing game engines, but also lacks their optimizations, and thus suffers from performance problems. In addition to long loading times, large maps with hundreds of units have severe frame-rate bottlenecks, dropping as low as four frames per second. Intel set out to identify the source of this problem using Intel® VTune™ Amplifier, our performance profiling tool, with much appreciated assistance from the 0 A.D. development community.
Initial Analysis
The first step was to ensure that the VTune Amplifier timeline would be appropriately annotated with markers indicating frames, as well as event regions marking the start and end of the loading screen and the actual gameplay. While it is possible to use pause and resume annotations to ensure that data is not collected outside the area of interest, we opted not to do so in this case. Once the game was compiled with the frame and event annotations, we began with a microarchitecture exploration analysis (although a hotspots analysis would have been equally appropriate).
The annotations create marks on the timeline in the VTune Amplifier results. The yellow blocks along the very top are frames; the blue chart below them represents framerate. Each row below that is a thread, with running threads marked in green and CPU time in brown. On the topmost thread bar there are two long brackets running along the top. These are the event regions; the yellow one on the left is the loading screen, and the green one on the right is the gameplay.
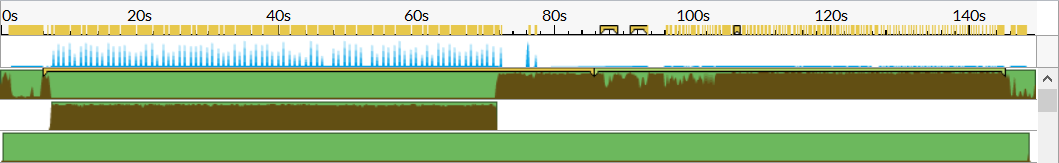
The game’s usage pattern is characterized by the long loading time, some very slow frames on first entering the game, then a relatively stable staccato frame pattern through the rest of the gameplay. Zooming and filtering in on a representative section in the middle of the gameplay not only makes this pattern of short frames with large gaps between them more obvious, it also shows that a significant amount of the game time is spent “[Outside any known module].”
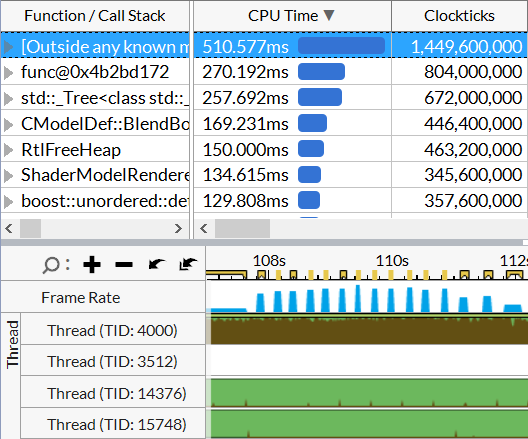
Since the frames themselves are very short, we filter into one of the gaps between them to display only data associated with this delay. Many of the identifiably gameplay-related functions drop away, leaving the unknown module data and lower-level functions taking up most of the time.
Diving Deeper
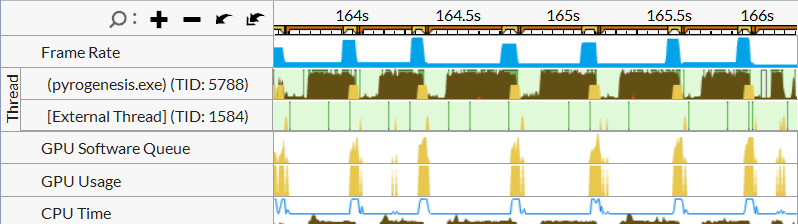
Since the majority of activity in the delays between frames comes from outside the pyrogenesis code, we ran a CPU/GPU Concurrency analysis to determine whether the GPU was active during these times. However, the GPU showed the same staccato pattern, indicating that the game was not waiting on the GPU.
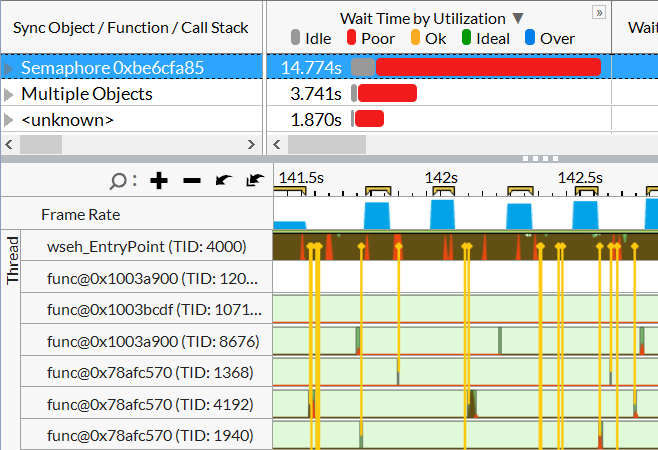
Next, the large number of threads with very little activity prompted us to run a Threading analysis. Sure enough, there were many thread transitions, denoted with yellow lines, occurring in the spaces between frames. Two sync object entries comprised the majority of the time spent.
Following the call stacks down eventually reveals a BaseThreadInitThunk. Thunking is an interface between two types of code, such as C++ and Javascript.
Conclusion
The numerous transitions associated with thunking in the frame gaps, coupled with the various “js” entries that pop up throughout the results, strongly suggest that the game’s bottleneck is its Javascript usage. The exact nature of the problem remains unidentified – it could be excessive garbage collection or too-frequent interfacing, but most likely it’s the use of the Javascript to run significant portions of the game logic, which would likely be more efficient if written in C++.
Intel has reported our findings to Wildfire Games, but unfortunately, updating the Javascript is a massive undertaking, so as of writing, the bottleneck remains.