Get the Best Performance for Applications Developed with Intel® Media SDK
When developing a media application, you often wonder, “Am I getting the performance I should be? Am I using fixed function logic or my EU array?” This article will show how to set up Intel® Graphics Performance Analyzers (Intel® GPA) to analyze the real time performance of your Intel® Media SDK-optimized application.
First, let’s start with Intel® GPA. Intel GPA is a very useful tool for identifying media pipeline inefficiencies and targeting application optimization opportunities. Second, the Intel® Media SDK is software development library that exposes the hardware media acceleration capabilities of Intel® platforms for decoding, encoding and video processing (see hardware requirements for applicable processors). To get started, we’ll use Intel GPA to analyze some of the Intel® Media SDK sample use cases as examples. Please refer to each sample description for details.
For this article, you will need both Intel GPA and the Intel Media SDK. You can get the free downloads of Intel® GPA and either Intel Media SDK (for clients) or Intel® Media Server Studio Community Edition (where Intel Media SDK is a component).
Throughout this article, we use Intel® GPA 2016 R1 with the latest Intel Media SDK 2016. Note that future revisions for Intel GPA and Intel Media SDK will introduce new features that may deviate from some parts of this article.
Setting up Intel GPA
Run the Intel GPA installer to install tools. With Intel GPA you can get in-depth traces of media workloads, capturing for instance operations such as fixed function hardware processing (denoted as MFX from now on) or execution unit (EU) processing. Intel GPA also has the capability to display real-time Intel GPU load via the Media Performance dialog.
The Intel GPA tool is started by launching the “Intel® Graphics Monitor” application from the Start window or from the task bar. Right-clicking the task bar icon brings up a menu with options.
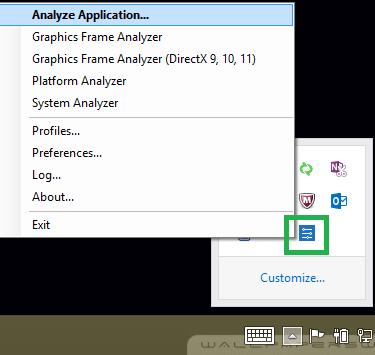
For the purpose of media workload analysis, you will create a media analysis profile in the Intel GPA profiles menu:
1)Select the “Profiles” menu item -> click the “HUD Metrics” tab. Clear existing metrics in “Metrics to display in the HUD”, by selecting all the metrics and click on “Remove”. Now select following from “Available metrics” from Media and click “Add” to add to “Metrics to display in the HUD”.
- MFX Decode Usage
- GPU Overall Usage
- MFX Engine Usage
- MFX Encode Usage
Choose a group name and click on “Add Group” to save your settings. The profile should look just like the one below. Click Apply so save changes.

2) Select the “Preferences” menu item. Make sure the following check boxes are de-selected:
i.Auto-detect launched applications
ii.Disable Tracing
- Press “OK” to exit the "Preferences" dialog window

Analyzing the Application
Intel GPA uses an injection method to collect metrics during the runtime of the application. Injection takes place at application start time and for this tutorial, will be launched from the analyze application menu within GPA.
- To capture detailed workload metrics select “Analyze Application” from the Intel GPA from the task bar menu.
- Enter the executable path, name and arguments in the “Command line” dialog item. Make sure that “Working Folder” is set correctly and no spaces in path.

3) To start capturing metrics for the specified workload press the “Run” button.
Real-time graphs can also be enabled by pressing “Ctrl+F1” during rendering to view real-time metrics. Note: Metrics can be changed during runtime from within the profiles menu from the setup step.

Before analyzing any of the other Intel Media SDK samples workloads, let’s examine what information is presented in metrics captured by Intel® GPA, why they are important, and what are possible next steps for improvement. Each metric is displayed in real time as a percentage value over time. The red number is the minimum value, the green number is the maximum value, and the white number is the current value.
Below is a table of metric descriptions for each media metric offered within Intel GPA. For a full list of Media Metrics supported in GPA, please refer to our documentation.
| Metric Name |
Metric Description |
| MFX Engine usage |
Represents percentage of the time the Multi-Format Codec (MFX) engine is active |
| MFX Decode Usage |
Represents percentage of time that MFX-based decode operations are active |
| GPU Overall Usage |
Represents percentage of time either execution unit (EU) and MFX (Media Fixed Function) is active |
| EU Engine Usage |
Represents percentage of time the Execution Unit (EU) engine is active |
| MFX Encode Usage |
Represents percentage of time that MFX-based encode operations are active |
Interpreting the Data
If you are observing GPU overall usage is high, then check IOPattern in your application, as mismatched IOPattern in MediaSDK implementation consumes large amounts of extra buffers and internal copies and its is recommended to avoid such scenarios. Refer to technical articles here, which explain common Media SDK use-case scenario settings and how to further optimize your media pipelines to achieve best performance.
Questions, Comments, Feature requests regarding analyzing your media application? Connect with other developers and Intel Technical Experts on the Intel Media SDK forum and Intel GPA forum!