The performance improvement an application gets from being compiled with optimization can be enhanced by understanding and acting on optimization reports. Fortunately, this has become much easier with the latest compilers from Intel. Modern optimizing compilers can often make code transformations that greatly improve application performance, but this may depend on how the original code is written and how much information is available to the compiler. The Intel® Compiler’s optimization report tells the programmer which optimizations were performed and why other optimizations were not performed. A programmer can use this feedback to tune code to enable additional compiler optimizations and further enhance application performance.
Prior versions of the Intel compiler provided much potentially valuable information scattered through a series of different reports, but the messages were not logically ordered and were sometimes cryptic or confusing, especially in the presence of inlining or of multiple, compiler-generated loop versions. Some of the information was not actionable or immediately useful to the programmer. The single report stream could be hard to navigate, hard for other tools to access, and was unsuited to the parallel builds which are increasingly used to reduce build times on modern, multi-core processors.
Starting from version 15.0, the compiler in Intel® Parallel Studio XE 2015, the optimization report was comprehensively redesigned to integrate all individual reports into a single, user-friendly report and to address the limitations described above. This article explains the features of the optimization report, how they may be used to understand what optimizations the compiler did or did not perform and to guide further application tuning.
Enabling and Controlling the Report
The command line switches for enabling and high level control of the new optimization report are listed in Figures 1a and 1b for the Intel Compilers for Windows*, Linux* and macOS*. In most cases, the version of a switch for Linux or macOS starts with -q and the corresponding version for Windows starts with /Q. The switches are the same for both C++ and Fortran compilers.
| Linux* and macOS* |
Windows* |
Functionality |
| -qopt-report[=N] |
/Qopt-report[:N] |
Enables the report; N=1-5 specifies an increasing level of detail (default N=2) |
| -qopt-report-file=stdout | /Qopt-report-file:stdout | stderr | filename | filename | -qopt-report-file=stdout | /Qopt-report-file:stdout | stderr | filename | filename | -qopt-report-file=stdout | /Qopt-report-file:stdout | stderr | filename | filename | /Qopt-report-file:stdout | stderr | filename | -qopt-report-file=stdout | /Qopt-report-file:stdout | stderr | filename | filename | -qopt-report-file=stdout | /Qopt-report-file:stdout | stderr | filename | filename | Controls where the report is written (default is to file with extension .optrpt) |
| /Qopt-report-format:vs | Report is formatted to enable display in Microsoft Visual Studio* |
|
| -qopt-report-routine=fn1[,fn2,…] |
/Qopt-report-routine:fn1[,fn2,…] |
Emit report only for functions whose name contains fn1 [or fn2…] as a substring |
| -qopt-report-filter=“filename,ln1-ln2” | /Qopt-report-filter=“filename,ln1-ln2” | Emit report only for lines ln1 - ln2 of file filename |
| -qopt-report-phase=phase1[,phase2,…] |
/Qopt-report-phase:phase1[,phase2,…] |
Optimization information is provided only for the specified optimization phases. |
Figure 1a.
| Optimization Phase | Description |
| vec | Automatic and explicit vectorization using SIMD instructions |
| par | Automatic parallelization by the compiler |
| loop | Memory, cache usage and other loop optimizations |
| openmp | Explicit threading using OpenMP directives |
| ipo | Inter-Procedural Optimization, including inlining |
| pgo | Profile Guided Optimization (using run-time feedback) |
| cg | Optimizations during code generation |
| offload | Offload and data transfer to Intel® Xeon Phi™ coprocessors |
| all | Reports on all optimization phases (default) |
Figure 1b.
Report Output
The report is disabled by default and may be enabled by the switch -qopt-report. By default, for compatibility with parallel builds, a separate report corresponding to each object file is created with file extension .optrpt in the same directory as the object file. The report output may be redirected to a different, named file, or to -qopt-report-file=stdout | /Qopt-report-file:stdout | stderr | filename | filename or stdout, using the switch -qopt-report-file.
For debug builds with -g on Linux or macOS, /Zi on Windows, some loop optimization information is embedded in the assembly code and in the object file. This makes the loop structure in the assembly code easier to understand, and makes optimization information from the compiler available for use by other software tools.
Optimization reports can sometimes be very large. They may be restricted to functions of interest using the switch -qopt-report-routine, or to a particular range of line numbers within a source file using the switch -qopt-report-filter.
Layout of Loop-Related Reports
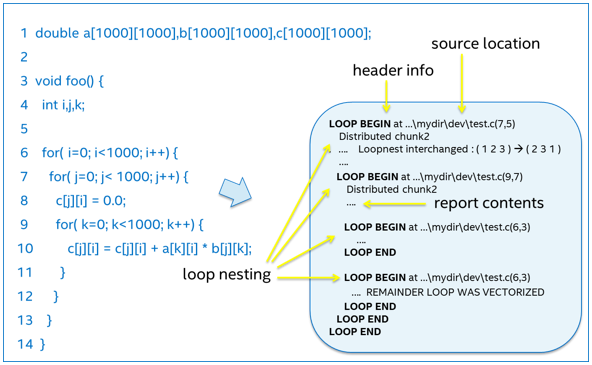
Messages relating to the optimization of nested loops are displayed in a hierarchical manner, as illustrated in Figure 2. The compiler generates a LOOP BEGIN message for each loop in the compiler-generated code, along with the initial source line and column number, and a corresponding LOOP END message. Indenting is used to make clear the nesting structure. There may be multiple compiler-generated loops for a single source loop and the nesting structure may differ from that of the source code. A loop may be “distributed” (split) into two or more sub-loops. The partial report displayed in Figure 2 shows that the outer loop at line 6 of the source code has become two inner loops in the optimized generated code.

Figure 2.
This hierarchical display allows compiler optimizations to be associated directly with the particular loop in the generated code to which they apply.
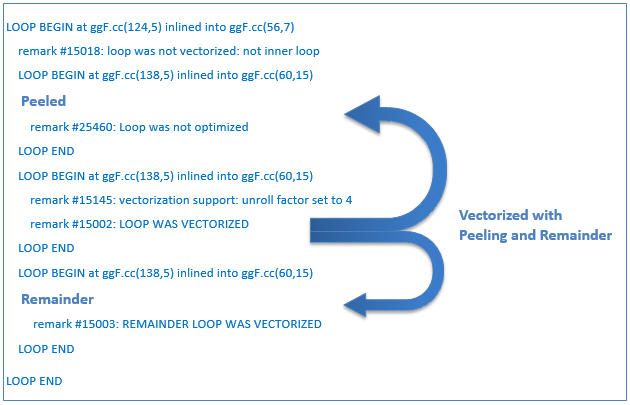
SIMD load instructions in a vectorized loop are most efficient when the data to be loaded are aligned to a memory address that is a multiple of the SIMD register width. To achieve this, the compiler may “peel” off a few initial iterations, so that the vectorized kernel can operate on data that are better aligned. Any small number of left-over iterations after the vectorized kernel may be optimized as a separate “remainder” loop. Figure 3 shows how such “peel” and “remainder” loops are identified in the optimization report.

Figure 3.
Using the Loop and Vectorization Reports
The goal of the optimization report is not just to help you understand what the compiler did, but also to help you understand the obstacles that it encountered, so that you can help it to do better. We will illustrate this with the simple C example in Figure 4, (the report and its interpretation are very similar for C++ and Fortran). The function foo() loops over the input array theta, does a calculation involving a math function and returns the result in the array sth.
#include <math.h>
void foo (float * theta, float * sth)  {
  int i;
  for (i = 0; i < 128; i++)
       sth[i] = sin(theta[i]+3.1415927);
}
$ icc -c -qopt-report=2 -qopt-report-phase=loop,vec -qopt-report-file=stderr foo.c

Begin optimization report for: foo(float *, float *)

    Report from: Loop nest & Vector optimizations [loop, vec]

LOOP BEGIN at foo.c(4,3)
<Multiversioned v1>
   remark #25228: Loop multiversioned for Data Dependence
   remark #15399: vectorization support: unroll factor set to 2
   remark #15300: LOOP WAS VECTORIZED
LOOP END

LOOP BEGIN at foo.c(4,3)
<Multiversioned v2>
   remark #15304: loop was not vectorized: non-vectorizable loop instance from multiversioning
LOOP END
Figure 4.
The report shows that the compiler generated two loop versions corresponding to a single loop in the source code, (this is known as “multiversioning”), and explains that this is because of data dependence. The compiler does not know at compile time whether the pointer arguments theta and sth might be aliased, i.e., the data they point to might overlap, in a way that would make vectorization unsafe. Therefore, the compiler creates two versions of the loop, one vectorized, one not. The compiler inserts a run-time test for data overlap so that the vectorized loop is executed if it is safe to do so; otherwise, the non-vectorized loop version is executed.
If the programmer knows that the two pointer arguments are not aliased, he/she can communicate that to the compiler, either using the command line option -fargument-noalias (Linux or macOS) or /Qalias-args- (Windows), or the restrict keyword along with -restrict (Linux or macOS) or /Qrestrict (Windows). Alternatively, the compiler can be told directly that it is safe to vectorize the loop, using #pragma ivdep or #pragma omp simd (this latter requires the -qopenmp or -qopenmp-simd switch). In each of these cases, only the vectorized version of the loop is generated, and the compiler does not need to generate any run-time tests for data overlap. In the present example, we use the command line switch and increase the level of detail in the report as in Figure 5:
$ icc -c -fargument-noalias  -qopt-report=4 -qopt-report-phase=loop,vec -qopt-report-file=stderr foo.c

Begin optimization report for: foo(float *, float *)

    Report from: Loop nest & Vector optimizations [loop, vec]

LOOP BEGIN at foo.c(4,3)
   remark #15389: vectorization support: reference theta has unaligned access   [ foo.c(5,14) ]
   remark #15389: vectorization support: reference sth has unaligned access   [ foo.c(5,5) ]
   remark #15381: vectorization support: unaligned access used inside loop body   [ foo.c(5,5) ]
   remark #15399: vectorization support: unroll factor set to 2
   remark #15417: vectorization support: number of FP up converts: single precision to double precision 1
   [ foo.c(5,14) ]
   remark #15418: vectorization support: number of FP down converts: double precision to single precision 1
   [ foo.c(5,5) ]
   remark #15300: LOOP WAS VECTORIZED
   remark #15450: unmasked unaligned unit stride loads: 1
   remark #15451: unmasked unaligned unit stride stores: 1
   remark #15475: --- begin vector loop cost summary ---
   remark #15476: scalar loop cost: 114
   remark #15477: vector loop cost: 40.750
   remark #15478: estimated potential speedup: 2.790
   remark #15479: lightweight vector operations: 9
   remark #15480: medium-overhead vector operations: 1
   remark #15481: heavy-overhead vector operations: 1
   remark #15482: vectorized math library calls: 1
   remark #15487: type converts: 2
   remark #15488: --- end vector loop cost summary ---
   remark #25015: Estimate of max trip count of loop=64
LOOP END
Figure 5.
The report shows that only a single loop version was generated. The cost summary shows that the estimated speedup from vectorization is about 2.79. Not bad, but we can do better. We note the remarks 15417 and 15418 about conversions between single and double precision at columns 14 and 5 of line 5, and the presence of 2 type converts in the summary. Checking the source code, we see that the array theta is single precision, but the literal constant 3.1415927 defaults to double precision; this causes the result of the addition to be double precision and so the double precision version of the sine function is called, only for the result to be converted back to single precision for storage into sth. This impacts performance in two ways: it takes longer to calculate a sine function to higher precision; and because a double takes twice the space of a float in the SIMD register, the vector instructions can only operate on half as many elements at a time. If we modify the source code by making the literal constant and/or the sine function explicitly single precision,
sth[i] = sinf(theta[i]+3.1415927f);
then the warnings about precision conversions go away, and the estimated speedup almost doubles, to 5.4. This is because most of the time goes in the vectorized math library call (remark #15482), and rather little in the more lightweight vector operations (remark #15479).
Next, we notice that the estimated maximum trip count of the vectorized loop is 64, (remark #25015), compared to the original loop iteration count of 256. So each vector operation is acting on 4 floats, that is, 16 bytes. This is because by default, we are compiling for Intel® Streaming SIMD Extensions (Intel® SSE), for which the vector width is 16 bytes. If we have an Intel® processor with support for Intel® Advanced Vector Extensionss (Intel® AVX), which have a vector width of 32 bytes, we can target these with the compiler option -xavx. This causes the following changes in the report:
remark #15477: vector loop cost: 11.620
remark #15478: estimated potential speedup: 9.440
…
remark #25015: Estimate of max trip count of loop=32
If we had targeted an Intel® Xeon Phi™ coprocessor or other Intel AVX 512 processors using the compiler option, -xcore-avx512, for example, the maximum trip count would have been 16 and the vector width would have been 16 floats or 64 bytes.
We now look at the messages relating to alignment. Accesses to memory that are aligned to a 32 byte boundary for Intel AVX (or 16 bytes for Intel SSE or 64 bytes for Intel Xeon Phi coprocessors and other Intel AVX 512 processors) are typically more efficient than memory accesses that are not so aligned. Remark #15381 is a general warning that an unaligned memory access was detected somewhere within the loop. Remarks #15389, 15450 and 15451 tell us that when the compiler generates loads of theta and stores to sth it assumes that the data are unaligned. Since theta and sth are passed in as arguments, the compiler does not know their alignment. Data may be aligned where they are declared by using __declspec(align(32)) (Windows) or __attribute__((align(32))) (Linux or macOS), or where they are allocated, e.g. by using _mm_malloc() or Posix memalign(). If the arguments to function foo() are known to be aligned, the keyword __assume_aligned() may be used to inform the compiler:
__assume_aligned(theta,32);
__assume_aligned(sth,32);
These keywords should only be used if you are sure that the pointer arguments of the function will always point to aligned data. There is no run-time check. After recompiling with the __assume_aligned keyword, only aligned memory accesses are reported, e.g
remark #15388: vectorization support: reference theta has aligned access
The estimated speedup due to vectorization increases by about 20%:
remark #15477: vector loop cost: 9.870
remark #15478: estimated potential speedup: 11.130
Now that sth is aligned, the compiler has the possibility of generating streaming stores (also known as non-temporal stores) directly to memory. This may be worthwhile if the stored data are unlikely to be accessed again in the near future, (i.e., before being evicted from cache). This avoids a “read-for-ownership” of the cache line, which may be beneficial for applications that read and write a lot of data and whose performance is limited by the available memory bandwidth. It also frees up cache for more productive uses. The compiler finds it worthwhile to generate streaming stores automatically only for amounts of data much larger than in this example, typically several Megabytes. If the iteration count is increased to 2000000, or if #pragma vector nontemporal is placed before the loop, the compiler generates streaming store instructions and the following additional messages appear in the optimization report:
remark #15467: unmasked aligned streaming stores: 1
remark #15412: vectorization support: streaming store was generated for sth
Even for such a tiny function, the optimization report can be a rich source of information!
Example of the IPO Report on Inlining
The IPO report gives information about optimizations across function boundaries. Here, we will focus on inlining.

Figure 6.
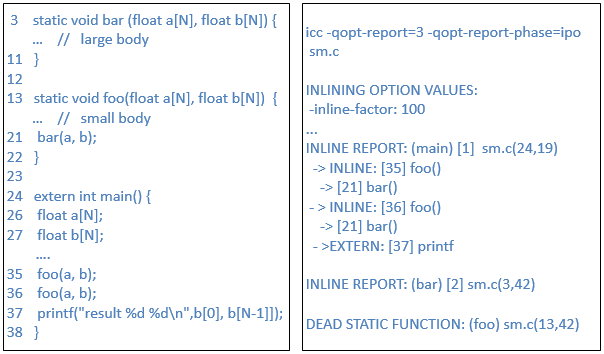
Figure 6 shows schematically a main program that twice calls a small, static function foo() and then calls printf to print a final result. foo() calls a large static function bar(). Each live function gets its own inlining report, Thus main(), whose body starts at line 24, column 19, gets foo() inlined at line 35 and at line 36. foo() in turn gets bar() inlined at line 21. main() also calls printf() at line 37; printf is marked as external, because its content is not visible to the compiler. bar(), whose body starts at line 3 column 42, does not contain any function calls. The static function foo(), whose body starts at line 13 column 42, is marked as a dead because all of the calls to it within the source file are inlined; therefore, since it can’t be called externally, the compiler does not need to generate a standalone version of the function.
Any indirect function calls would also be shown at report level 3, marked INDIRECT. At higher levels, the sizes of all called functions visible to the compiler are displayed, along with the increase in size of the calling function when they are inlined.
At the head of the inlining phase of the optimization report is a list the values of the inlining parameters that were used, next to the compiler switches that can be used to modify them. These can be used to control the amount of inlining, based on the information in the report. For example, changing the argument of -inline-factor (/Qinline-factor on Windows) from 100 to 200 doubles all the size limits used to control what may be inlined. Inlining of individual functions can be requested or inhibited using pragmas such as inline, noinline and forceinline, or by the corresponding function attributes using __attribute__ or __declspec keywords. For more detail, see the Intel Compiler Developer Guide and Reference for C++ or Fortran.
Other Report Phases
A report on automatic parallelization (threading) by the compiler, structured similarly and integrated with the vectorization and loop reports, can be obtained using -qopt-report-phase=par. -qopt-report-phase=openmp produces a report on threading constructs resulting from OpenMP pragmas or directives. A report on Profile Guided Optimization, including which functions had useful profiles, may be obtained using -qopt-report-phase=pgo. -qopt-report-phase=cg reports on optimizations during code generation, such as intrinsic function lowering (conversion to lower level constructs). -qopt-report-phase=loop reports on additional loop and memory optimizations, such as cache blocking, prefetching, loop interchange, loop fusion, etc. A summary of data scheduled for transfer to and from an Intel Xeon Phi coprocessor may be obtained with -qopt-report-phase=offload.
For further information, see the Intel® Compiler Developer Guide and Reference for C++ and Fortran.
Summary
The new, consolidated optimization report in the Intel® C++ and Fortran Compilers provides a wealth of information in a readily accessible format. Information not only about which optimizations were performed, but also about those that could not be performed, can guide the programmer in further tuning to improve application performance.