Introduction
This Eclipse client package implements the Intel® Debugging Analysis and Replay Toolkit (Intel® DART) program recording, replay and slicing tools as a set of additional Eclipse plugins. It is part of the DrDebug project.
This client allows you to debug a program, record a program, replay a program recording, and analyze program variable dependencies using slice analysis. You can also debug programs invoked via Pin or SDE. You can launch a program or you can connect to a running program.
Additionally, you can view summary and dependency files generated by Pin or SDE tools.
This implementation is based on the Eclipse Mars (4.5, June 2015) release and the CDT (C/C++ Development Tooling) plugins that are part of the Eclipse Mars release.
You should be familiar with the basics of Eclipse and CDT usage before using this package. See Eclipse Foundation for help with Eclipse usage and Eclipse CDT for help with CDT usage.
Installation
You must be running current versions of Linux and Java in order to use this package. The README in the readme directory for your Eclipse installation lists the Linux and Java versions that the Mars release of Eclipse has been tested with. The following image shows the relevant requirements for Linux systems.
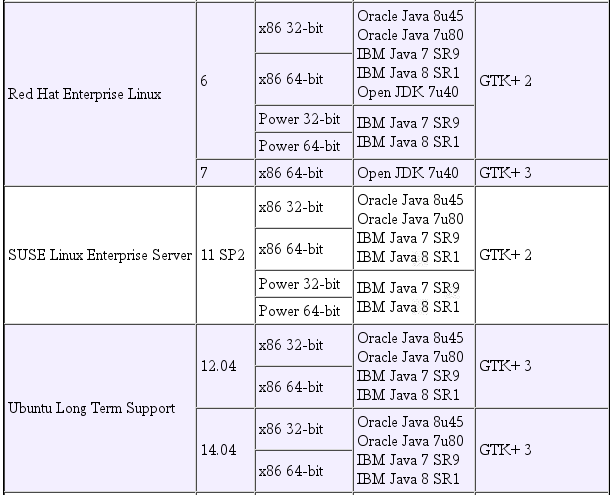
You also need a current copy of the PIN or SDE kit, including the code for the Intel® DART tools, which you have unpacked and installed by following the installation instructions for that kit. You need to know the top level (root) directory for that installation.
There are two installation methods for this client. The first method is intended for new users who want to just install a version of Eclipse with these client plugins installed. The second method is intended for users that have an existing Eclipse (Mars) installation and who want to install these client plugins in their Eclipse installation.
Installation for New Users
To install this client, choose a directory that you have write access to and unpack the tar file by issuing a command such as tar –xfEclipseDART_2014_10_13.tar.gz where EclipseDART_2014_10_13.tar.gz is the filename of the tar file you want to extract. Installation will create an EclipseDART directory as the top level directory of your client installation.
Add the EclipseDART directory Eclipse was installed in to your PATH environment variable setting.
Installation in an Existing Eclipse Installation
The client code is also packaged in an Eclipse update site image which can be used to install the plugins. This image contains the plugin code and metadata that the Eclipse installer utility needs to install the plugins.
Once you have downloaded the update site image, start Eclipse. Invoke the Eclipse install utility by clicking Help in the Eclipse main menu then clicking Install New Software. The installation wizard is displayed.

Click the Add button in the upper right corner of the wizard to add a new plugin repository. The following dialog appears.

Enter a name, such as Intel DART Client in the Name field. Click the Archive button, navigate to the directory containing your update site image and select the update site image. Click the OKbutton
Make sure the new repository is selected in the Work with dropdown. Uncheck the Group items by category checkbox then select the Intel DART Eclipse client in the Name list.

Click Next. You will see several additional wizard pages.
The next wizard page will show you a list of plugins to be installed. Click Next.
The following wizard page will display the license text. Review the license terms. If the terms are acceptable, click I accept the terms of the license agreement and click Finish.
You will see a Security Warning dialog asking if you want to install unsigned software. Click OK.
Once the installation completes, you will see a prompt asking you to restart Eclipse. You should restart Eclipse before attempting to use the client plugins.
Invocation
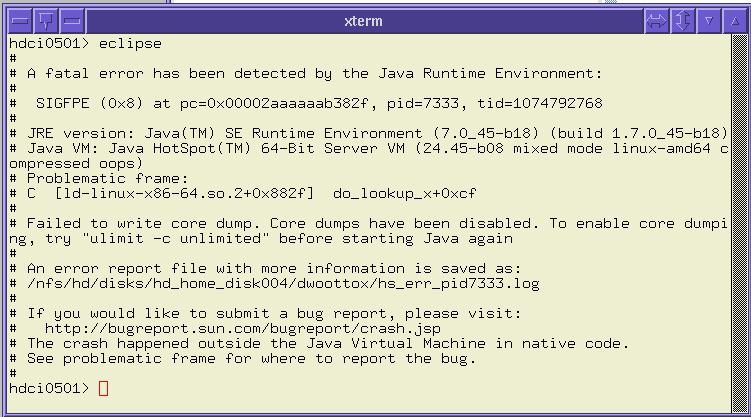
You invoke the client by invoking eclipse where your Eclipse installation directory is in your PATH environment variable setting.
Eclipse will attempt to verify that you have a compatible version of GTK installed and issue an error message if a compatible version of GTK is not installed. Otherwise, if you attempt to start Eclipse on systems with operating system levels older than listed, you may see the following error message
Setup
In order for preferences to be properly saved, you may need to enable preference recording by the Oomph plugins that are part of Eclipse. In order to do this, open the preferences dialog by clicking the Window entry in the Eclipse main menu then clicking Preferences. Then expand the Oomph node in the preferences dialog, expanding the Setup Tasks node, and clicking the Preferences Recording node. The preferences dialog should look like the following image.

Click the Record Info checkbox and make sure all of the checkboxes starting /instance/com.intel.dart are checked.
The Eclipse client needs to know the root directory of your Pin or SDE kit installation. You set this in the Intel® DART preferences window by clicking Window in the Eclipse main menu, clickingPreferences (Window->Preferences), and clicking Intel® DART in the preference window.
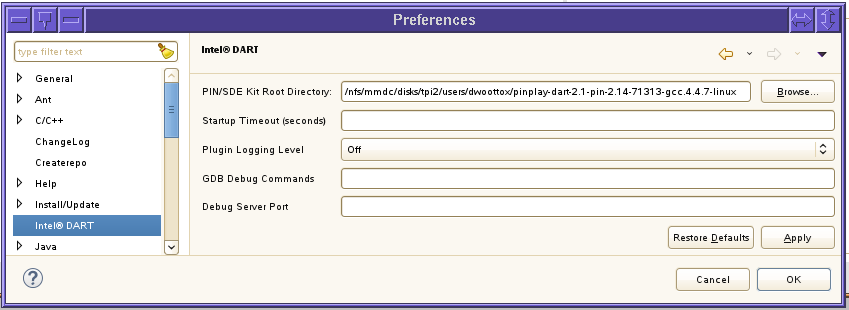
Specify the kit root directory by either typing in the path name in the PIN/SDE Kit Root Directory field or by clicking the Browse button and using the directory selection dialog to select the correct directory.
The Startup Timeout field specifies the maximum time to wait for debugger startup. The 10 second default is sufficient in most cases, but can be increased if needed.
The Plugin Logging Level is normally set to off, and is intended for diagnosing plugin problems.
The GDB Debug Commands field is used to enter a semi-colon delimited list of gdb commands. These commands are issued early in the debug startup sequence and can be used, for instance, to turn on gdb diagnostic output. Normally, this field will be left blank.
The Debug Server Port field is used to specify the port number that the Eclipse client uses to connect to a running application for debugging. You must select an unused TCP port on your system. The default port is 48999.
Once you have set the preference values, click Ok.
Pin/SDE Kit Requirements
Each of the run types you can select has specific requirements for tool modules in the Pin or SDE kit that you use, as follows.
| Run Type | Pin Tool Module | SDE Tool Module |
| Debug | None | None |
| Record | pinplay-driver.so |
sde-pinplay-driver.so (Internal SDE only) |
| Replay | pinplay-driver.so |
sde-pinplay-driver.so (Internal SDE only) |
| Static Analysis | StaticAnalysis | N/A |
| Program Slice | pinplay-driver.so | N/A |
If the Pin or SDE kit you specify does not contain the tool module needed for your run type, then you will not be able to select that run type.
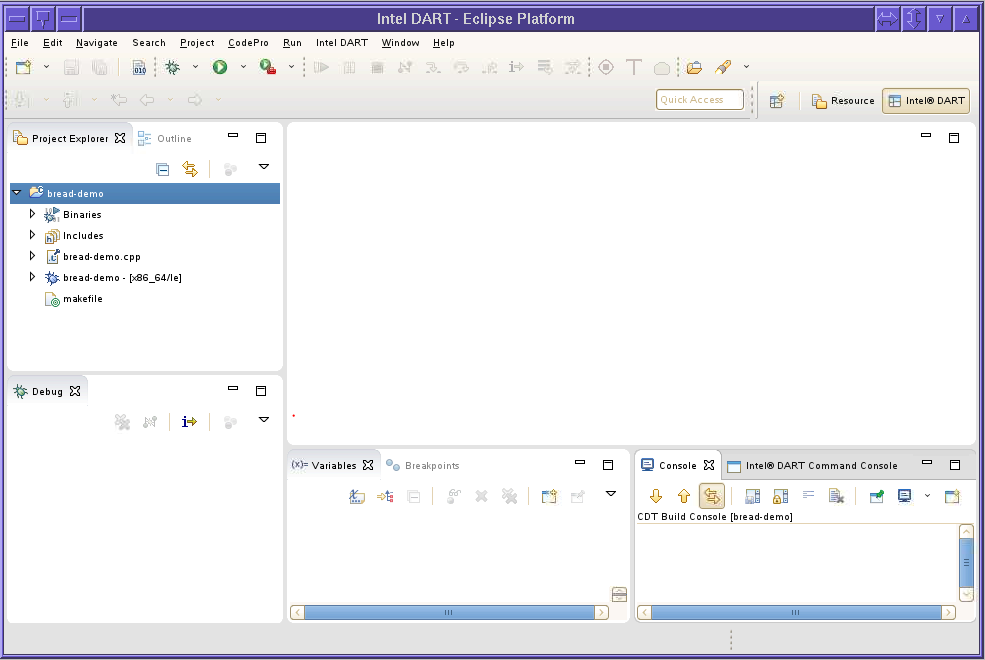
Intel® DART Perspective
An Eclipse perspective is a collection of Eclipse views (windows) that are logically grouped together in support of a specific development workflow, debug, recording, replay, and program slice analysis in this case.
You open this perspective by clicking Window->Open Perspective->Other from the Eclipse main menu and then double clicking Intel® DART in the list in the dialog.
You can open or close views in the perspective as needed. You can also move or resize views. If you need to reset back to the original perspective layout, click Window->Reset Perspective in the Eclipse main menu and then click Ok in the popup dialog.
You should use this perspective for debugging, recording, replay, and program slice analysis with Pin or SDE, but you can add views from this perspective to other perspectives if you choose.
Menu options for program recording are only available in the Intel® DART perspective.
Starting an Intel® DART Session
You start an Intel® DART session by clicking the Debug Configurations entry under the Run menu in the Eclipse main menu or by clicking the dropdown to the right of the debug icon in the Eclipse toolbar and selecting Debug Configurations from the popup menu. The debug configuration dialog opens, as displayed below.
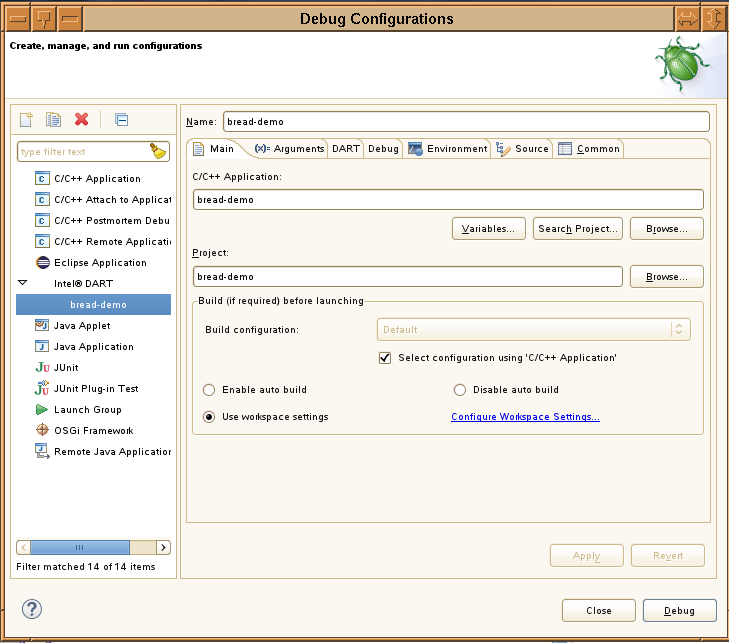
You can either select an existing debug configuration from the list under the Intel® DART node in the tree in the left side of the dialog or you can create a new debug configuration by right-clicking the Intel® DART node in the tree then clicking New in the popup menu.
Once the debug configuration is opened, you can set the application path, application arguments, Intel® DART settings, debugger options and application environment variables by clicking the Main, Arguments, DART, Debug, or Environment tabs respectively.
You specify the application path by typing the full path to the application in the C/C++ Application field in the Main tab or by clicking the Browse button just below the field and navigating to find the executable. The project is selected similarly, where the project is the Eclipse project you created to contain all files for your application.
You specify program arguments on the Arguments tab as a set of blank-delimited parameters in the Program arguments field.
You can either use the default working directory (the top level directory for the project you selected), or specify a specific working directory. To specify a working directory, uncheck the Use default checkbox on the Arguments tab then enter the directory path or use the buttons below the field to navigate to the required directory.
You set program environment variables on the Environment tab by clicking the New button and entering the name and value of the environment variable.
You fill in needed options in the DART and Debug tabs of the debug configuration dialog as described in the following sections.
Where possible, fields are validated after they are filled in. If errors are found, an error message is displayed in the upper left corner of the dialog and the Apply and Debug buttons are disabled. All errors must be resolved before you can continue.
If you click the Apply button, the settings in the debug configuration dialog are saved into a debug configuration.
If you click the Debug button, the settings in the debug configuration dialog are saved into a debug configuration and the session is started.
The next time you use the same debug configuration, the saved settings are loaded into the debug configuration dialog pages.
Once you have created a debug configuration, you can launch the session with the same settings again without opening the debug configuration dialog. You can do this by selecting the debug configuration from the list displayed in the Debug History menu under the Debug menu in the Eclipse main menu or by picking it from the list that appears when you click the dropdown to the right of the debug icon in the Eclipse toolbar.
Setting Intel® DART Options
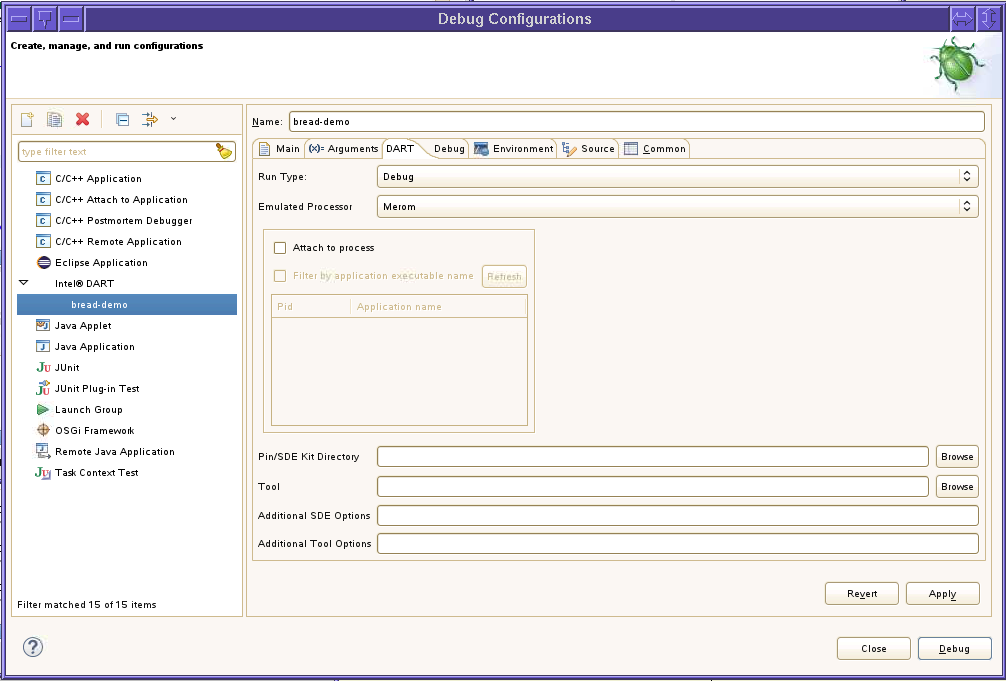
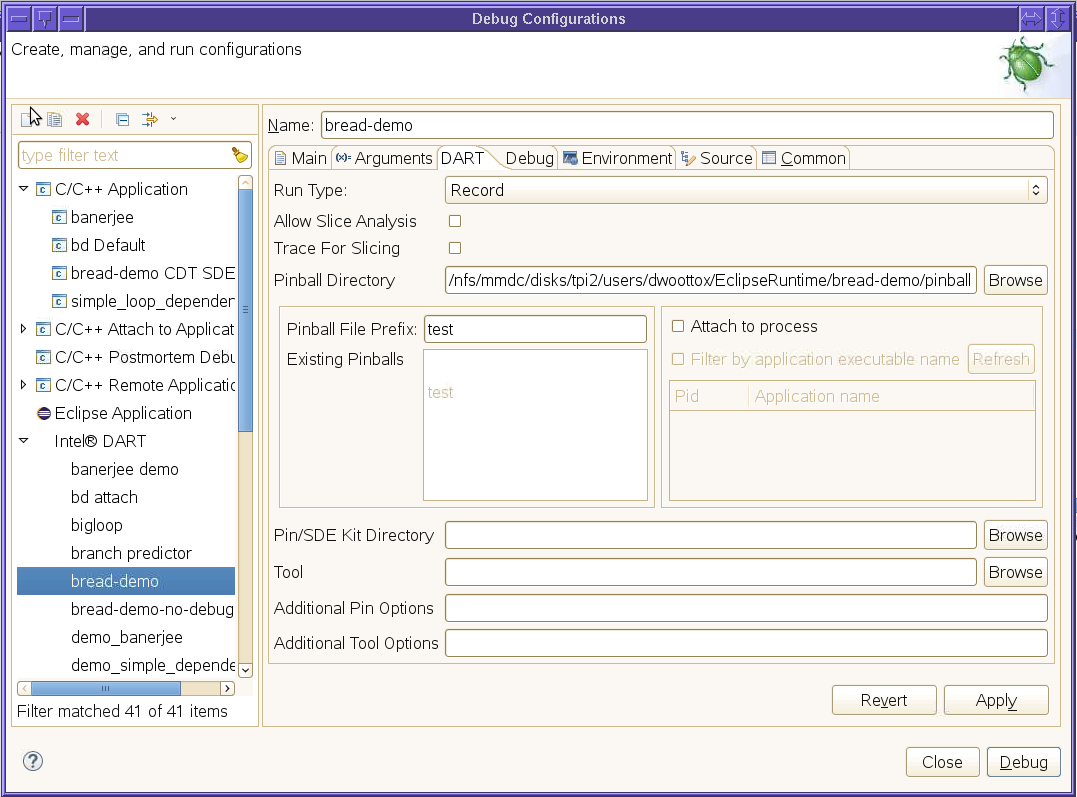
You specify the type of run to be performed, along with any required run options, on the DART tab of the debug configuration dialog.

Run Type specifies the type of session to be run. You can select Debug, Static Analysis, Recording, Replay, or Slice Analysis. Later sections describe each of these run types.
The Allow Slice Analysis checkbox specifies if program slice analysis is allowed during this session.
The Trace for Slicing checkbox specifies if the trace processing required for program slice analysis is done for the entire execution of the application or program recording fragment or if the processing is only done for selected execution regions.
The Pinball Directory field specifies the path to the directory where log files (pinballs) will be written when you record program execution. You can enter the path by typing it or by clicking the Browse button to the right of the field and using the directory selector dialog to navigate to the path to be used as a pinball directory.
This directory does not need to exist before starting the session.
The Pinball File Prefix field specifies the prefix to be used when generating pinball files for this session. The value of this field will be appended to the pinball directory specification.
The Existing Pinballs list is used when selecting a set of pinball files for replay.You select the desired pinball by picking a prefix from this list.
The Attach to process checkbox is checked when you want to attach to an already running process for a debug or recording session. When this checkbox is checked, a list of processes owned by your login account is displayed.
The Filter by application executable name checkbox is used when you want to limit the displayed processes to only the processes that match the application name entered in the Main tab of the debug configuration dialog.
The Refresh button is used to refresh the list of processes displayed in the list widget below the button.
The Pid/Application name list displays the list of running processes owned by your login account. You select the process you want to attach to by clicking its pid or name in this list.
The Pin/SDE Kit Directory field specifies the path to the root of the Pin or SDE kit you are using for this session. If this field is left blank, the path set in the Intel® DART preferences page will be used. You can enter the path in this field or click the Browse button to the right of this field and use the directory selector dialog to navigate to the desired directory.
The Tool field specifies the name of the tool module to be used in this session. If this field is left blank, the Eclipse client will determine the tool module. If a value is entered in this field, it must specify a dynamically linked shared object. If a Pin kit is being used, then any path to a tool module can be specified. If a SDE kit is being used, then this field must specify only the name of the tool module, which must be located in the ia32 or intel64 directory at the root of your SDE kit.
If a tool module is specified in the Tool field, then a set of checkboxes will appear below the Tool field.
![]()
The purpose for these checkboxes is so the user can specify capabilities of the tool module that can be used by the client.
If the Record checkbox is checked, the client assumes that the tool is capable of creating a pinball containing a recording of program execution by using the Record functions.
If the Replay checkbox is checked, the client assumes that the tool is capable of replaying a pinball.
If the Slice checkbox is checked, the client assumes that the tool is capable of generating program slice files.
If a user-specified tool module is specified, then the state of these checkboxes determines the set of run types that can be selected from the Run Type dropdown.
Note that the client assumes that the user-specified tool module accepts the same command line options as the pinplay-driver.so module included with the Pinplay kit accepts.
If the Tool field is blank, then these checkboxes are not visible.
The Additional Pin Options field allows you to specify additional options for Pin or SDE. This is a blank-delimited list of options as if they were entered in a command line.
The Additional Tool Options field allows you to specify additional options for the tool module. This is a blank-delimited list of options as if they were entered in a command line.
Note that the Emulated Processors dropdown is not shown in the image above. This dropdown is specific to SDE and will be described in the Debugging a Program section.
Depending on the Run Type and the selected Pin or SDE kit, some of the options in this dialog will not be visible.
Setting Debugger Options
You can set some debugger options by using the Debug tab of the debug configuration dialog.
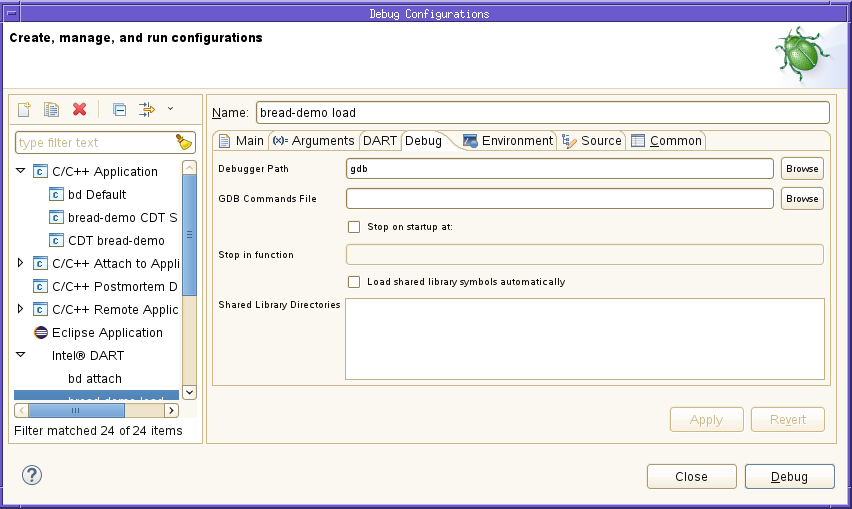
You can specify a debugger other than the system version of gdb by entering the path name to gdb in the Debugger Path field or by clicking the Browse button next to this field to open a file selector dialog and navigate to the debugger executable.
If you are using SDE, you must specify the path to the gdb executable provided with the SDE kit. Otherwise, some debugger functions such as code disassembly may not work correctly.
You can specify a file containing GDB startup commands (a .gdbinit file) by entering the path name to the file in the GDB Commands File field. If
You can request that GDB stop in a designated function at startup by checking the Stop on startup at checkbox and entering the function name in the Stop in function field.
You can specified that symbols in shared libraries are loaded at startup by checking the Load shared library symbols automatically checkbox.
You can specify a list of additional directories to be searched when loading shared libraries by entering the directory names, one per line, in the Shared Library Directories field.
Changing the Pinball Directory
You can change the directory and pinball file prefix while in a recording session or replay session as long as recording is not currently active. This is also useful in replay mode, where you can specify a new directory or pinball file prefix so that you do not overwrite existing pinball files when generating new pinballs.
In order to do this, click the

icon in the Eclipse main toolbar or Set Record Basename in the Intel DART menu in the Eclipse main main menu.. This results in a pop-up dialog where you can enter the name of the directory to hold pinball files and the prefix for the pinball file names
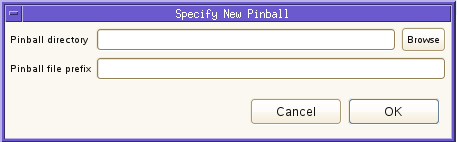
You enter the directory by typing the path name in the Pinball Directory field or by clicking the Browse button and navigating to the desired directory.
You enter the pinball file name prefix in the Pinball file prefix field.
Once you have specified the directory and pinball file prefix, click the OK button.
Debugging a Program
You can debug an application invoked under control of Pin or SDE by selecting Debug as the run type. When the Debug run type is selected, the debug configuration dialog looks like the following image. You can launch an application in a debug session or you can attach to a running program.
If you are using a SDE kit, then you can specify a processor model to emulate by selecting a processor from the Emulated Processor dropdown. If you are not using a SDE kit, the Emulated Processor dropdown is not visible.
If you are using a SDE kit, then you must also use the version of gdb distributed along with the SDE kit to ensure proper emulated processor support is available in the debugger.
After the Debug button is clicked, you can use the views provided by the CDT debugger such as breakpoints, values, and registers as if you were debugging a native application.
You can also attach to a running program to debug it. To do this, open the DART tab in the debug configuration dialog. Click the Attach to process checkbox.
This results in a list of your processes being displayed. Select the desired process from the list, make sure the other settings on this page are correct and click Debug. You can then debug the program by setting breakpoints and either examining the program or generating logs at the breakpoints.
If you have a long list of processes, you can filter the list to show only your application processes, matching the application name in the Main tab of the debug configuration dialog, by clicking the Filter by application executable name checkbox.
If you need to regenerate the list of processes, click the Refresh button.
Once you have attached to the program, you can set breakpoints at points where you want to start and stop recording then resume execution.
Recording a Program Execution
You can generate a recording of program execution for use in replaying execution of an application program or for slice analysis of an application program. You can record the complete execution of an application program or you can record execution of one or more fragments of an application program.
Recording generates a set of log files of program execution called a pinball.
Since there is additional overhead for both recording and program slice analysis, the regions you select should be as small as possible to surround the region of code you are trying to debug but large enough that you capture enough of the program execution in the pinball files.
To record program execution, you set breakpoints at the locations in the program where you want to start recording and where you want to stop recording.
To set breakpoints, double click in the left margin (to the left of the line number) of the line where you want to set a breakpoint. This should place a blue dot in the margin as a marker for the breakpoint. You can set additional breakpoints as needed.
You must set at least one breakpoint at a location in the application that you know will be executed, either before or at the point where you want to start recording.
You remove breakpoints by double clicking over the blue breakpoint marker you want to remove.
Once you have set breakpoints, you are ready to run the application.
You do this from the Eclipse main menu by clicking Run->Debug Configurations, which causes the Debug Configurations dialog to be displayed.
Recording parameters are set on the DART tab.
You select program recording by selecting Record from the list in the Run Type dropdown box.
You must specify a directory where the pinball files will be written by entering a path in the Pinball Directory field. You must also specify a pinball file prefix in the Pinball File Prefix field. All other fields are optional.
Recording is only allowed if you are using a Pinplay or internal SDE kit.
Once you have entered all the fields in the debug configuration, you start the application by clicking the Debug button. The application should start and then suspend at the first breakpoint.
After the application suspends at a breakpoint, you can start or stop recording. You do this by clicking the Record icon in the main Eclipse toolbar. Initially, the icon appears as

indicating that recording is not active. Once you click the icon and recording starts, the icon appears as

indicating recording is active. If you click the icon again, it returns to its original appearance and recording is stopped.
There is a corresponding menu option under the Intel DART menu in the Eclipse main menu. This menu item will toggle between Record On and Record Off when recording state changes.
Note that the Record icons in the toolbar and the Intel DART menu are visible only within the Intel® DART perspective. This means recording can only be controlled from this perspective. They are enabled only when a debugging session with recording enabled is active.
Eventually the program runs to completion.
If you do not stop recording before the application terminates, then the log will include the program's termination.
Recording a Running Program
You can record a running program by attaching to that program. To do this, open the debug configuration dialog

You must switch to the DART tab and specify a pinball directory and pinball file prefix.
After you open the DART tab, click the Attach to process checkbox. This results in a list of your processes being displayed. Select the desired process from the list, make sure the other settings on this page are correct and click Debug. You can then debug the program by setting breakpoints and either examining the program or generating logs at the breakpoints.
If you have a long list of processes, you can filter the list to show only your application processes, matching the application name in the Main tab of the debug configuration dialog, by clicking theFilter by application executable name checkbox.
If you need to regenerate the list of processes, click the Refresh button.
Once you have attached to the program, you can set breakpoints at points where you want to start and stop recording then resume execution. You can also start recording at the point where the program suspended when the Eclipse client attached to it.
Note that if you want to attach to a running process, you must do that by opening the debug configuration dialog to select the process. You cannot attach to a running program using the debug shortcut icons or menu choices, since the saved pid for the application is probably no longer valid.
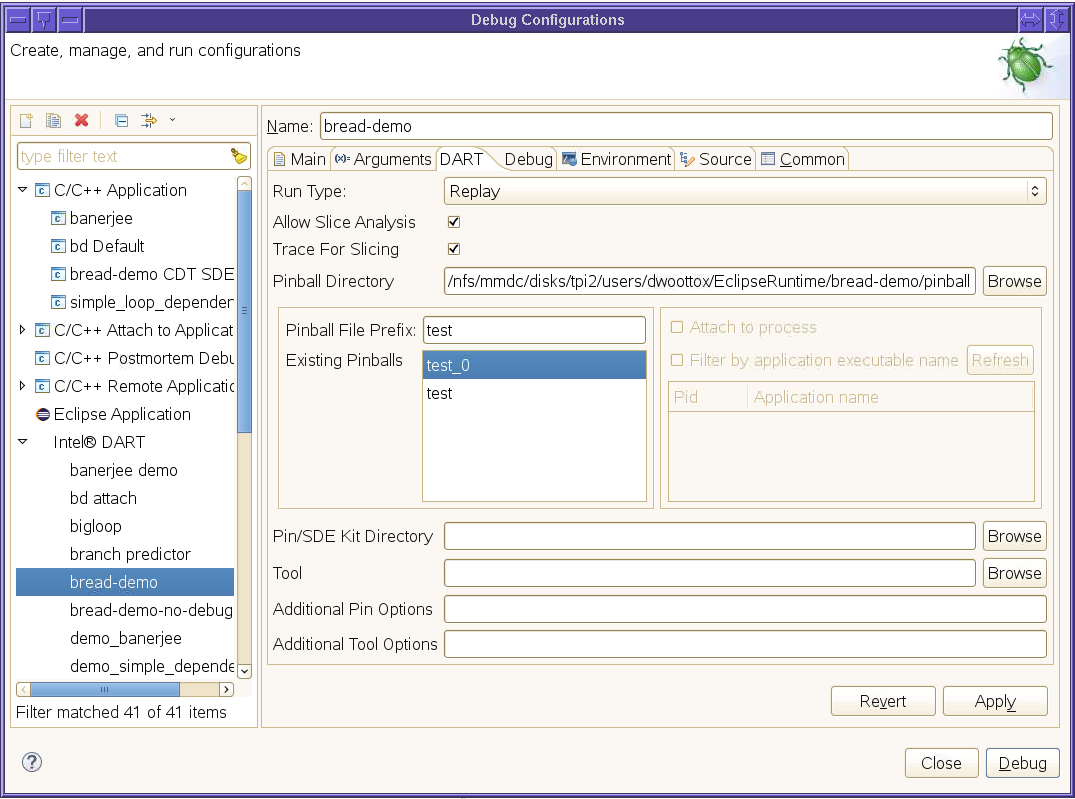
Replaying Program Execution
The replay tool allows you to replay a pinball of a previous program execution. In a replay session you can set breakpoints, run the application to a breakpoint, and examine program variables. You cannot modify the values of variables and you cannot alter program control flow.
Before you start a replay session, you must set at least one breakpoint at a program location that was recorded in the log session and which will be executed. Otherwise your replay session will just run to completion.
Once you have set the appropriate breakpoints, you start the replay session by opening the debug configuration dialog and selecting the Replay option from the Run Type dropdown list.
Invocation for the replay tool is identical to invocation for the log tool except for settings on the DART tab of the debug configuration dialog.

You must specify the directory containing your pinball files in the Pinball Directory field. You must enter the starting characters of your pinball filename in the Pinball File Prefix field then select a pinball from the Existing Pinballs list.
Once you have completed the debug configuration dialog, start the replay session by clicking the Debug button. The replay session will be started and execution will suspend at the first breakpoint reached.
At that point you can examine variables, add and remove breakpoints, single step thru the application, or resume execution as if you were in a debug session.
If you want to generate additional pinballs during a replay session, you should change the pinball file directory and pinball file prefix as described in the Changing the Pinball Directory section.
Static Analysis
Static analysis is only required for a program which you intend to perform slice analysis and where you want to include control flow dependencies in the application in the analysis. You only need to rerun static analysis if the application has been recompiled since the last time static analysis was performed.
You can run static analysis as a separate run, independent of any other tool by selecting Static Analysis as the run type in the debug configuration. When static analysis is selected, the debug configuration dialog looks like the following image.
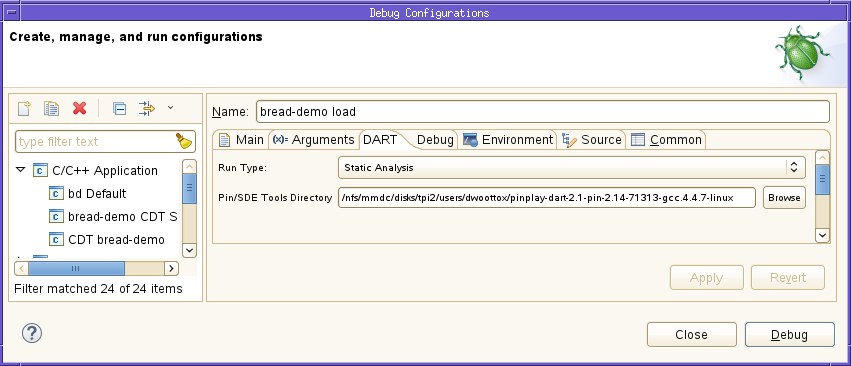
You can change the Pin/SDE Tools Directory field if needed, then click Debug.
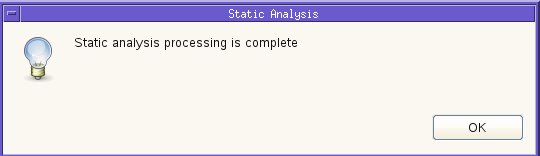
When static analysis successfully completes, the following message is displayed.
Program Slice Analysis
Once you have generated pinballs of application code regions of interest, you can use the program slice tool to perform dependency analysis for variables active in that region.
If you will generate program slices based on file, line number and variable name instead of by addresses, then the program must be compiled with the -gdwarf-2 compiler and linker option.
Invocation for the slice tool is identical to invocation for the recording tool except for settings on the DART tab of the debug configuration dialog.
You must have at least one breakpoint set in a region of code where you captured a log. If no breakpoints are set in logged regions, the application will just exit without allowing you to perform slice analysis.
In order to perform program slice analysis, select Record or Replay from the Run Type drop down box. In addition, you must check the Allow Slice Analysis checkbox, specify an existing pinball directory in the Pinball Directory field, enter a prefix for an existing pinball in the Pinball File Prefix field, and select an existing pinball from the Existing Pinballs list.
The processing required for program slice analysis can add significant overhead to program execution. You can limit the program execution regions where you want to collect the data required by unchecking the Trace for Slicing checkbox. If you do this, then a

icon will be enabled in the Eclipse main toolbar. You can start collecting the required data by clicking this icon when program execution is suspended. The icon will switch to green and data collection will be enabled. You stop collection by clicking this icon again when program execution is suspended. Data collection will stop and the icon will turn red.
Note that when slice analysis is performed, only regions where the additional processing for program slice analysis was enabled will be considered.
Once you have entered all the data in the debug configuration dialog, click Debug. The application should start and run to the first breakpoint.
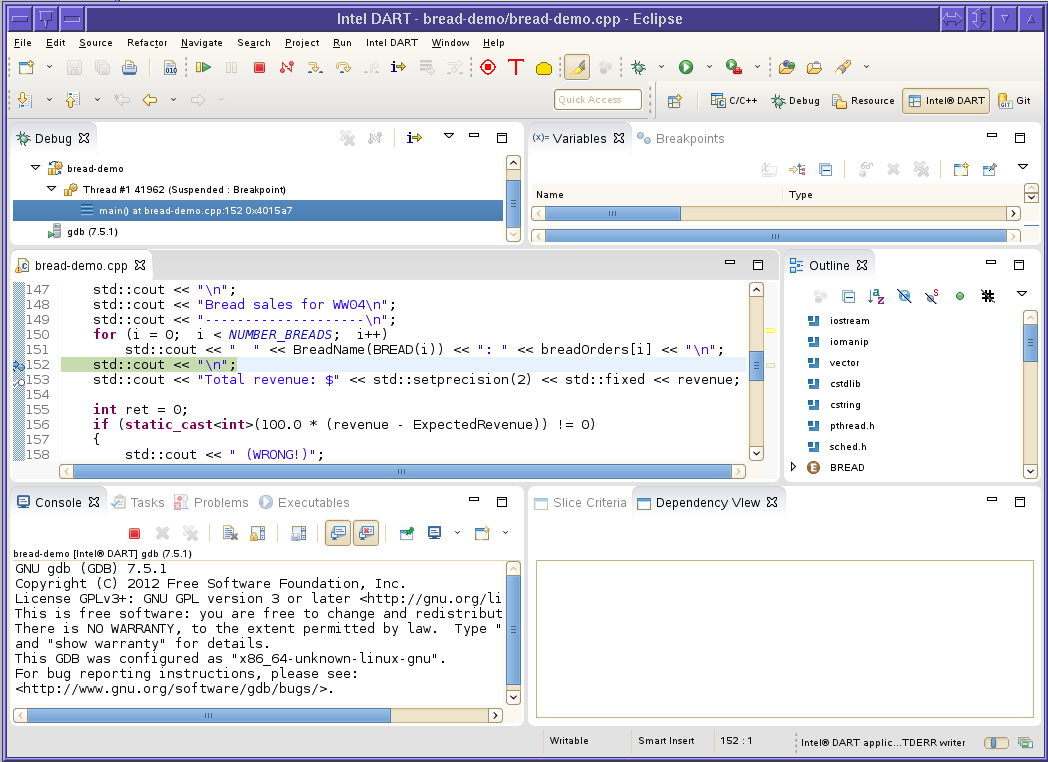
Once the program suspends at a breakpoint, you can generate a program slice, using the Slice Criteria view.
You generate a slice by entering values in the fields at the top of the slice list view and clicking the Backward Slice or the Forward Slice button.
If you click the Backward Slice button, then the generated slice will identify all locations that the variable and execution instance specified by the slice criteria depend on. If you click the Forward Slice button, then the generated slice will identify all locations that depend on the variable and execution instance specified by the slice criteria. In both cases, only regions of program execution where additional data for program slice analysis was collected, either the entire execution of the program or replay region, or only regions where trace for slicing was enabled will be considered.
Instance is the thread’s execution instance at the specified file and line number you want to generate the slice for. For example, if a thread executes a statement 100 times in a loop, the individual execution instances of that statement on that thread are numbered zero through 99.
Thread ID is the thread number of the thread the slice is to be generated for.
File Name is the path to the source file containing the line of code where the slice is to be generated. If this field is blank, it defaults to the currently open and visible file in the source code editor view.
Line Number is the line number where the slice is to be generated.
Variable is the name of the variable to be analyzed. The Variable field must be a simple, unqualified variable name. You cannot specify structure member names or elements of an array.
You can also analyze source code which has not been compiled with the -gdwarf-2 option. In this case, you specify the starting instruction address in the Start Address field, the ending instruction address in the End Address field, the variable address in the Variable field, and the variable length in the Length field.
You can also specify instruction addresses and variable addresses for source files which have been compiled with the -gdwarf-2 option, for instance, to perform analysis where the variable in question is only accessible via a pointer or the variable is a member of a structure or an array element.
Instruction addresses and variable addresses are specified in hexadecimal, for instance, 0x40100.
The variable name may also be the name of a register, for instance, %rax.
Once you click the Backward Slice or Forward Slice button, the slice is generated and added to the list at the bottom of the slice list view.
If you select a slice from the list at the bottom of the view and click the Remove button, it will be removed from the list of slices.
If you select a slice from the list at the bottom of the view, enter a variable name in the Variable Name field and click the Prune button, then the slice will be regenerated, excluding dependencies on the named variable. Multiple variables can be excluded from a slice by repeatedly selecting the slice, entering a variable name and clicking the Prune button.
If you select a slice from the list at the bottom of the view and click the Show Code button, then the client will attempt to show the source file in the source code editor view, positioned to the line where the slice was generated.
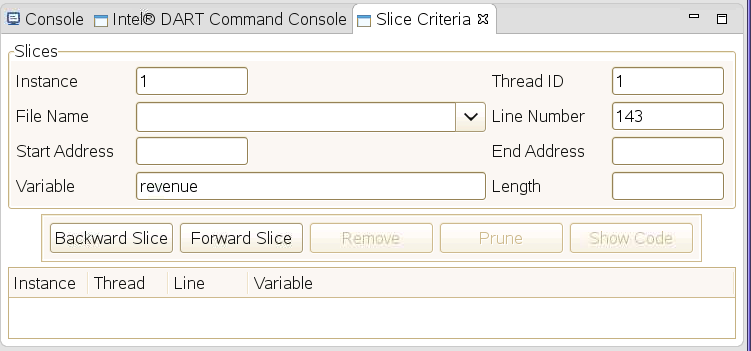
In order to view the detail for a slice, double click on a row in the list at the bottom of the slice list view. This results in the Dependency Summary view opening and displaying the slice data. It also annotates the source code editor view with markers and highlighting at each source line where there is a dependency from the line where the slice was generated.
The Dependency Summary view is described in the Viewing Dependency Files section, below.
Requirements for Summary and Dependency File Viewing
The summary file and dependency file viewers in this client require the summary and/or dependency files as well as the application's source code to all be located in Eclipse projects. If this requirement is not satisfied, then the viewers may not properly load summary or dependency files and may not properly locate source files referenced from the summary or dependency files.
The structure of the source files should match the structure that existed when the application was compiled.
Source files for an application may exist in multiple Eclipse projects. The client will search for files in projects the following order
· Same project as the summary or dependency file
· Breadth-first traversal of the tree of projects identified as projects referenced by the current project
· Any projects remaining in the Eclipse workspace
Project references are set by opening the project properties dialog for a project which references another project, clicking the Project References tab of the properties page and selecting the projects referenced by that project.
Viewing Summary Files
Summary files can be viewed by clicking the Open Summary File menu entry in the Intel DART menu in the Eclipse main menu then navigating to the location of the summary file and selecting that file. If the summary file has a .sum extension, then the summary file can be opened by right clicking the name of the summary file in the Project Explorer view and selecting Open Summary File from the popup menu.
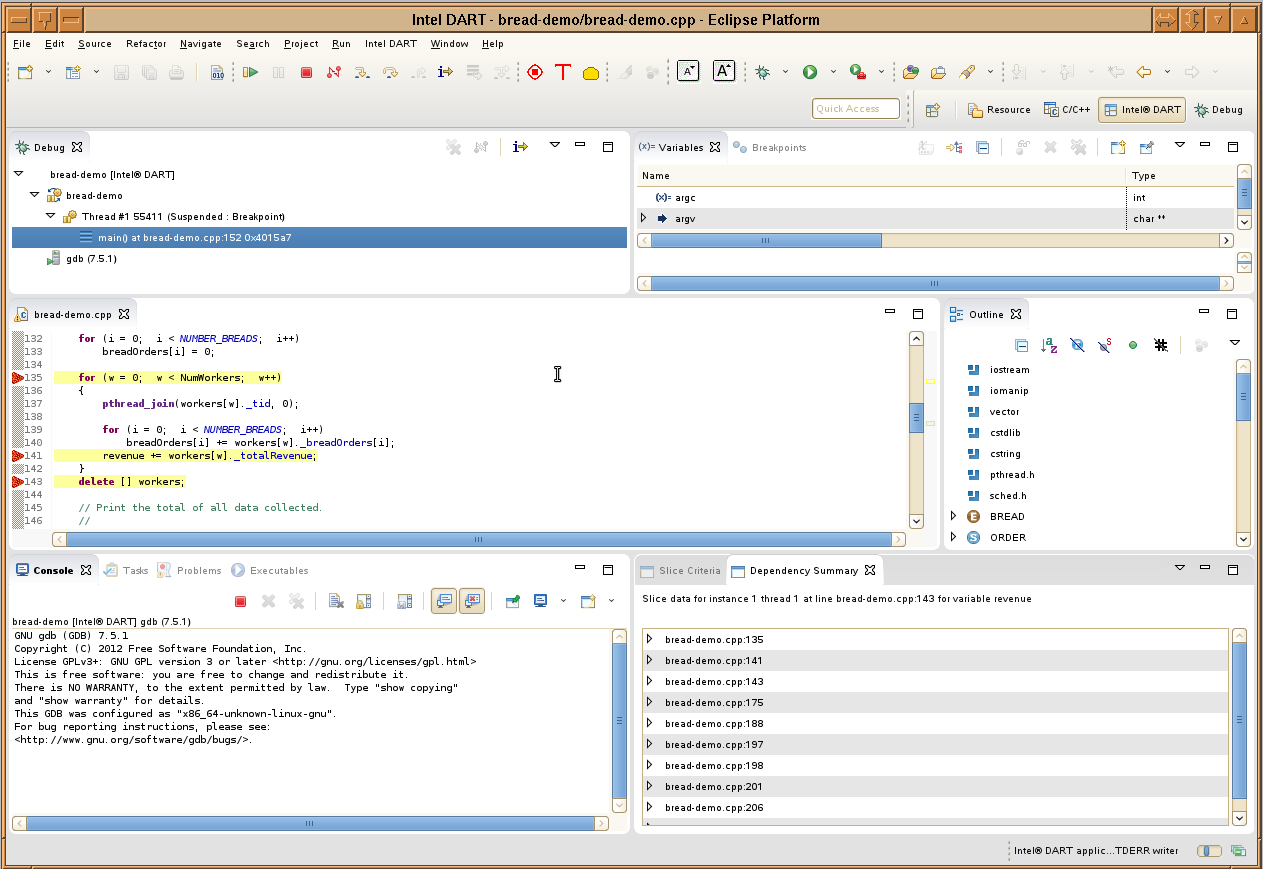
When a summary file is opened, the sumary view is opened, displaying the contents of the summary file. In addition, source code editor windows are opened for each source file referenced in the summary file and the source lines referenced in the summary file are annotated with ![]() markers.
markers.
The summary view consists of several columns containing data from the summary file.
If you click a row in the summary view, then the corresponding source file editor window will become the top level editor window, with the source file positioned to the selected line.
If you click a column heading in the summary view, then the table will be sorted by that column. The first time a column heading is clicked, the table is sorted in ascending order. The second time the same column heading is clicked, the table is sorted in descending order.
If you right click a row in the table in the summary view, a popup menu is displayed. This menu will contain a menu entry for each column in the table. When you click a menu entry, the view is updated to show only rows matching the value in the selected column for the row you clicked.
Multiple filters can be active, in which case rows are displayed only if they match the selection criteria for all active filters.
If you have selected one or more filters, the popup menu will contain a Remove latest filter menu entry. If you click this entry, one filter will be removed and the view updated to match the new filter criteria.
Viewing Dependency Files
Dependency files can be viewed by double clicking a row in the list of slices at the bottom of the Slice Criteria view. The second way to view a dependency file is to click the Open Dependency File menu entry in the Intel DART menu in the Eclipse main menu then navigate to the location of the dependency file and select that file. The third way to view a dependency file, if the dependency file has a .dep extension, is to right click the name of the dependency file in the Project Explorer view and select Open Dependency File menu in the popup menu.
If you are opening an arbitrary dependency file, then that file must be included in an Eclipse project, either residing in the Eclipse workspace, within that project's directory, or it must be linked to by an Eclipse project. If neither condition is satisfied, you will see a popup error dialog informing you that the dependency file cannot be found in any Eclipse project.
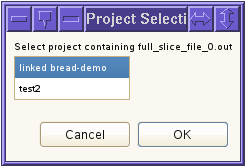
Dependency files are searched for by filename, excluding any path prefix. If the dependency filename is found in multiple Eclipse projects, then a popup dialog will be displayed, prompting you to select the project containing the dependency file.
Once a dependency file has been opened, the Dependency Summary view will be opened, displaying the dependency data.
Dependency Summary View
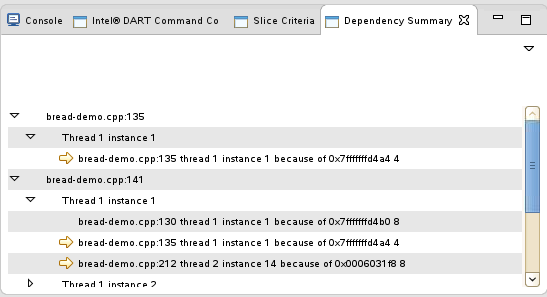
The dependency summary view is organized by line number, thread, instance, and then dependency. You can expand and collapse the tree by clicking the triangle icons to the left of each node.
If you left-click an entry in the tree, the client will attempt to open the corresponding source file and position the file to the line that was selected.
If you hover over a slice marker in the source code editor view, which corresponds to a top level node in the Dependency Summary view, a brief summary of the dependencies at that line will be displayed.
If you right-click over a node in the tree, then that node is selected and the client will attempt to open the corresponding source file and position the file to the line that was selected. In addition, depending on the selected node's level in the tree and the current state of the view, a popup menu with the following options will be displayed.
· Filter by thread - Update the view so only dependency information for top level nodes which have a thread/instance pair matching the selected node will be displayed.
· Filter by source line - Update the view so that only dependency information for leaf nodes matching the source line for the selected node and the parent nodes for that leaf node are displayed.
· Filter by variable - Update the view so that only dependency information for leaf nodes matching the memory location, register or control dependency for the selected node and the parent nodes for that leaf node are displayed.
· Remove latest filter - Remove the last selected filter and update the view so that the tree is displayed in its state before that filter was applied.
· Show next dependency - Locate the thread/instance pair node (2nd level node) corresponding to the source file, line number, thread and execution instance in the selected leaf node and update the tree view so that node is selected and visible. This menu item will only appear if the dependency is a non-leaf dependency.
· Show previous dependency - Restore the tree to the position and selection where it was positioned before the Show next dependency menu item was selected.
Filters can be stacked, where more than one filter can be active. If multiple filters are active, then the table is displayed as if the conditions for each node were applied, resulting in an 'and' relationship, such as filtering by thread and source line.
Dependency nodes may have a

to the left of them. This indicates that the dependency is a non-leaf dependency and that you can walk the dependency tree to the next level.
The Show next dependency and Show previous dependency menu options allow you to walk the dependency tree, stepping up or down thru the tree and following the path to leaf dependencies.
You can open additional dependency views by clicking the View By Dependency or Show Dependencies menu options from the drop down menu that is displayed when the menu icon in the upper right corner of the Dependency Summary view is clicked.
View By Dependency View
If the View By Dependency menu option is clicked, then the View By Dependency view is displayed.
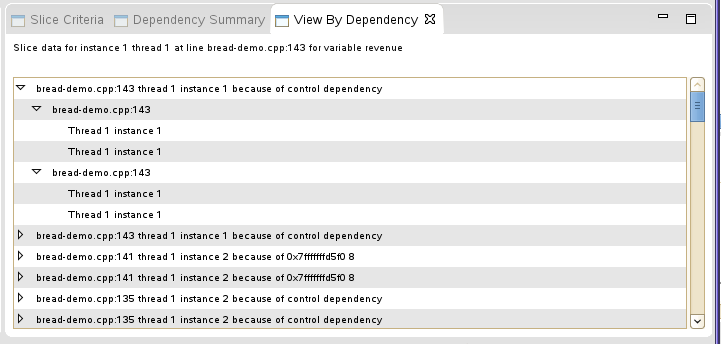
The top level node in this view shows the dependency information for a specific line, thread, execution instance and memory location, register, or control dependency.
The second level node in the tree groups all thread and execution instance pairs for a single line number that depends on its top level node in the tree.
The third level node in the tree groups all instances of a specific thread and execution instance pair that depends on its top level node in the tree.
If you left-click an entry in the tree, the client will attempt to open the corresponding source file and position the file to the line that was selected.
If you right-click over a node in the tree, then that node is selected and the client will attempt to open the corresponding source file and position the file to the line that was selected. In addition, depending on the selected node's level in the tree and the current state of the view, a popup menu with the following options will be displayed.
· Filter by thread - If this option is clicked for a top level node, then the view is updated so only top level nodes which match the selected thread and all child nodes of that node are displayed. If this option is clicked for a leaf node, then the view is updated so that only leaf nodes which match the selected thread, along with their parent top level nodes and second level nodes are displayed. Top level nodes and second level nodes which do not have any leaf nodes matching the selected thread are not displayed.
· Filter by source line - If this option is clicked for a top level node, then the view is updated so only top level nodes matching the selected file and line number and all of their child nodes are displayed. If this option is clicked for a second level node, then the view is updated so that only second level nodes which match the selected file and line number are displayed along with all their child nodes. If a top level node does not contain any second level node matching the selected file and line number, then that top level node is not displayed.
· Filter by variable - This option updates the view so that only top level nodes matching the selected memory location, register, or control dependency are displayed, along with all its child nodes.
· Remove latest filter - Remove the last selected filter and update the view so that the tree is displayed in its state before that filter was applied.
Filters can be stacked as described above.
Dependency Flow View
If the Show Dependencies menu option is clicked, then the Dependency Flow View is displayed.

Top level nodes in this tree represent file number, line number, thread and execution instance combinations that have dependencies upon memory locations, registers, or control dependencies that have been captured in the dependency file. The view is ordered so that node representing the file name, line number, thread and execution instance matching the selection criteria for the generated dependency file is at the top of the view. The following nodes represent subordinate dependencies, approximately ordered from immediate dependency to leaf dependency, constrained by the grouping of all instances of a unique filename, line number, thread and execution instance combination being grouped into a single node.
The second level nodes in the tree represent individual dependencies on a memory location, register or control dependency in a specific thread and execution instance of that line of code.
If you left-click an entry in the tree, the client will attempt to open the corresponding source file and position the file to the line that was selected.
If you right-click over a node in the tree, then that node is selected and the client will attempt to open the corresponding source file and position the file to the line that was selected. In addition, depending on the selected node's level in the tree and the current state of the view, a popup menu with the following options will be displayed.
· Filter by thread - If this option is clicked for a top level node then the view is updated so that only top level nodes matching the selected thread and all their child nodes are displayed. If this option is clicked for a seond level node, then the view is updated so that only second level nodes matching the selected thread and their parent top level nodes are displayed. If a top level node does not contain any second level nodes matching the selected thread, then the top level node is not displayed.
· Filter by source line - Update the view so that only second level nodes matching the selected file and line number and their parent top level nodes are displayed. If a top level node does not contain any second level nodes matching the selected file and line number then the top level node is not displayed.
· Filter by variable - Update the view so that only second level nodes which match the selected memory location, register or control dependency and their parent top level nodes are displayed. If a top level node does not contain any second level nodes matching the selected memory location, register or line number, then the top level node is not displayed.
· Remove previous filter - Remove the last selected filter and update the view so that the tree is displayed in its state before that filter was applied.
· Show next dependency Update the view so that the top level node matching the file name, line number, thread and execution instance in the selected node is visible and marked as selected. This menu item will only appear if the dependency is a non-leaf dependency.
· Show previous dependency - Restore the tree to the position and selection where it was positioned before the Show next dependency menu item was selected.
Dependency nodes may have a ![]() to the left of them. This indicates that the dependency is a non-leaf dependency and that you can walk the dependency tree to the next level.
to the left of them. This indicates that the dependency is a non-leaf dependency and that you can walk the dependency tree to the next level.
Filters can be stacked as described above. Dependency navigation also works as described above.
Disassembly View
If you click a row in a summary view or dependency view where that row does not contain source file and line number information, then an attempt is made to open the disassembly view, with the view positioned to the machine instruction referred to be the row in the summary view or dependency view you clicked.
This view displays a disassembly listing of the module containing the instruction address in the row you clicked. You can enter an instruction address in the Address field in this view. If the address you entered matches an address in the listing, then the listing is scrolled to that address.
Each time you click a row in a summary view or dependency view that does not contain source file and line number information, the disassembly view attempts to display the disassembly listing for the module containing that instruction, positioned at that instruction address.
You can manually generate a disassembly listing by clicking the Disassemble Object menu entry in the Intel® DART menu in the Eclipse main menu, then navigating to the directory containing the object to be disassembled and selecting that object.
Command Console
This client includes a command console which can be used to issue Intel® DART commands other than the record, slice, and prune commands used internally by the client. You open this console by clicking Window->Show View->Other on the Eclipse main menu to display the Show View dialog.
Expand the Intel® DART node, click Intel® DART Command Console and click OK.
Once the console view opens and you are in an active Intel® DART debug session, you can enter commands. Commands and their responses are displayed in the window at the bottom of the view.
Only pin or monitor commands can be issued. You must specify the pin or monitor command prefix.
If you press the up arrow or down arrow keys in the command field, you can scroll thru the list of previously issued commands.
Customizing Eclipse Fonts
In some cases, depending on the window manager you use, the default font size used by Eclipse may be too small. If necessary you can customize the default font size. To do this, go to the directory with the name starting with com.intel.dart.styling in the plugins directory of your Eclipse installation. Edit the dart.css file which should look like the following image
Modify the file to specify a default font size so that it looks like the following image, where 16 is the font point size.
Save the file and restart Eclipse.
Input File Formats
This client can display summary files and dependency files that conform to the following file formats
Syntax Notation
The following characters are used to represent the syntax of each line in these files. None of these characters actually appear in these files
<> Indicates a substitution, where the specified element has an actual value substituted.
[] Indicates a set of one or more optional elements. Either none of the elements between a pair of brackets or all of the elements between a pair of brackets must be specified.
{} Indicates selection of one element from the set of elements between curly braces.
| Is the delimiter between selections in a list enclosed by curly braces.
+ Indicates the immediately preceding token is specified at least one time.
* Indicates the immediately preceding token(s) appear zero or more times.
Any other characters outside <> must be generated exactly as specified.
Whitespace is one or more spaces. Tabs should not be used.
Summary File
The summary file consists of a set of lines, one per source file and line number to be annotated. There should be only one line in this file for each unique source file and line number. Each line has the following format
<filename>:<lineNumber> [ # <commentText> ]
filename is the name of the source file. This may be an absolute path, relative path or just a basename (foo.c). Directory separators for files on Windows systems (\) are internally converted to '/'. The client resolves file references by basename only.
lineNumber is the source line number in the source file for the source line to be referenced
commentText is an arbitrary text string containing additional data. The text is split into columns delimited by commas (,). If comment text is written in the summary file, all lines must have the same number of comma-separated text fields. This string is used by the client as an annotation for summary markers in the source file editor views and as additional data columns in the Summary View.
Additionally, the first line of the summary file may be an optional line specifying column headings for the data fields written as commentText If the first line of the summary file specifies column headings, then it must be written in the following format:
# <Heading>[,<Heading>]*
Heading is a column heading. The text is the column heading for that data column. It is also used as the menu label in the Filter By popup menu for filtering the view by the selected value in that column.
If the line containing column headings is present, then it specifies the number of data columns which must be written in each data line in the summary file.
If the line containing column headings is not present, then the labels Data 1, Data 2, etc are used as column headings in the summary view and Filter By menu entries in the summary view popup menu.
A summary file may contain information about the executable and shared objects in the application that generated the summary file. If this information is present, it must appear at the start of the file, immediately following the optional column headings line. There is one line per executable or shared object, in the following format
# image <imagePath> <loadAddress> <endAddress> <applicationExecutable>
imagePath is the full path to the executable or shared object
loadAddress is the hexadecimal load address for the executable or shared object, such as 0x40000
endAddress is the hexadecimal ending address for the executable or shared object
applicationExecutable is a flag indicating that the image is the application executable. Set it to 1 for the application executable, 0 for all others.
The suggested filename extension for summary files is .sum.
For example:
main.c:10 # Assignment to i
main.c:12 # Conditional branch
Dependency File
The dependency file consists of a set of lines, one per dependency. Each line has the following format
<lhsThread> <lhsFilename>:<lhsLineNum> [ <lhsInstance> ] [# <lhsComment> ] { -> | <- } <rhsThread> <rhsFileName>:<rhsLineNum> [ <rhsInstance> ] <dependency>+ [# <rhsComment> ]
dependency is {@control | @Call/Return/Goto/Continue/Break | <variableName> | %<register> | <memoryAddress> <memoryLength> } where @control indicates a control flow dependency and @Call/Return/Goto/Continue/Break indicates a branching dependency. The remaining substitutions (<>) are described below.
variableName is the name of the dependency variable.
register is the name of the dependency register.
memoryAddress is the address of a memory dependency that cannot be resolved as a variableName.
memoryLength is the length, in bytes, of the dependency at memoryAddress.
lhsThread is the thread id of the execution thread for the left side of the dependency.
lhsFilename is the source file name for the source statement represented by the left side of the dependency.
lhsLineNum is the source line for the statement on the left side of the dependency.
lhsInstance is the execution instance id for the statement on the left side of the dependency.
lhsComment is the comment text used to annotate tree nodes in the dependency view representing the left side of a dependency. This comment is terminated by a '->' or '<-' marker.
rhsThread is the thread id of the execution thread for the right side of the dependency.
rhsFilename is the source file name for the source statement represented by the right side of the dependency.
rhsLineNum is the source line for the statement on the right side of the dependency.
rhsInstance is the execution instance id for the statement on the right side of the dependency.
rhsComment is the comment text used to annotate tree nodes in the dependency view representing the right side of a dependency.
The '->' or '<-' indicates the direction of the dependency where '->' indicates forward dependency and '<-' indicates a reverse dependency.
A filename and line number pair should be specified if source line information is available. If source line information is not available then the filename should be specified as .unknown.asm and the line number as the hexadecimal instruction address.
A dependency file may contain information about the executable and shared objects in the application that generated the summary file. If this information is present, it must appear at the start of the file. There is one line per executable or shared object, in the following format
# image <imagePath> <loadAddress> <endAddress> <applicationExecutable>
imagePath is the full path to the executable or shared object
loadAddress is the hexadecimal load address for the executable or shared object, such as 0x40000
endAddress is the hexadecimal ending address for the executable or shared object
applicationExecutable is a flag indicating that the image is the application executable. Set it to 1 for the application executable, 0 for all others.
The suggested filename extension for dependency files is .dep.
For example:
1 main.c:10 5 # LHS Comment -> 2 calc.c:3 4 sum # RHS Comment
1 main.c: 10 # LHS Comment -> 2 calc.c:5 sum # RHS Comment
1 .unknown.asm:0xdeadbeef -> 1 .unknown.asm:0x0badbeef @control
1 main.c:10 -> 1 calc.c:1 %rax
1 main.c:10 -> 1 calc.c 0x12345678 8