By Paul Del Vecchio
Introduction
As a Senior Performance Analyst working at Intel, I spend my days collecting and studying enormous amounts of data that I gather in a laboratory over weeks or perhaps even months for any given project. This is a secure job, because software optimization is literally a job that never ends.
Consider the software development cycle; it is the drum beat to which every software company on the planet marches. From the smallest to the largest, firms employ scores of developers who spend their days writing code in multiple programming languages, across platforms and architectures, to enhance products’ functionality, stability, or richness. In doing so, they inevitably solve issues presented by the existing version of the product. It has been my experience throughout the never-ending cycle of development, from conceptualization to quality assurance, one aspect of the product usually goes unchecked: performance.
Even if the software did not morph from version to version every several months, another variable adds to the software-performance equation – the ever-changing nature of hardware technology. Gordon Moore, senior member of Intel’s Board of Directors and one of the company’s founders, conceived Moore’s Law back in 1965. The premise stating that the number of transistors per integrated circuit will grow exponentially over time has held true to this day. Figure 1 below shows how the number of transistors in Intel® microprocessors has grown substantially over time:

Figure 1. Moore’s Law
This paper discusses software performance in a very practical light and addresses the problem of optimizing performance in a way that developers can understand and apply across a very wide variety of applications and solutions. Its goal is to give the average software developer and IT professional a working knowledge of the process, tools, and “Best Known Methods” (BKMs) required for diagnosing, root causing and addressing performance problems in modern software applications.
Start Here: Beginning to Quantify Performance
Often, the most difficult task of all is simply identifying the need for performance engineering in a given product. Without a basis for comparison, one could argue whether or not the need even exists. If, for no other reason, consider the end user. Whether that person is an IT professional managing hundreds of servers or a PC gaming enthusiast, gaining more performance from software results in cost savings for everyone. Cost savings means a better overall user experience and simpler solutions that yield greater ease of management. For these reasons and many others, performance should be a primary consideration, rather than an afterthought.
In order for software performance to become practical, it must first be quantifiable. What exactly is required? First, one must identify a metric for measuring an application’s performance. This may seem to be an easy task, but it is more often than not quite complicated. Some software applications simply do not lend themselves to measurement. Moreover, even if a metric seems readily apparent or obvious, how does one know it is the right thing to measure? The only way to answer this question is to ask more questions:
- What does the application do?
(i.e., calculations, analytics, modeling, graphics rendering) - What system components are stressed during runtime?
(i.e., CPU, memory, graphics, disks, network) - With what metric might the end-user be most concerned?
(i.e.,startup time, request-processing time, user experience) - Are there several components or tiers that the performance engineer should consider?
(i.e.,Web, database, application, network services) - What comprises a 'representative' end-to-end solution?
(i.e., interaction between multiple systems or nodes)
Here are some examples of common application types and the metrics by which one can measure their performance:
| Web | HTTP Pages/Sec (Requests Rate) |
| Database | Transactions/Sec (Transactional Rate) |
| Gaming/Graphics | Frames/Sec (Frame Rate) |
| Directory Services | Searches/Sec (Search Rate) |
| File Services | Transfers/Sec (Transfer Rate) |
| Network Services | Packets/Sec or Bytes/Sec (Throughput) |
| Messages/Sec (Message Rate) |
All of these applications and their associated performance metrics have something in common. They are all measurable, and developers can quantify their performance. Note that every one of them is measurable by some rate of performance. What this table does not show is the other hidden metric or 'qualifier' present. In most (if not all) of the cases, whenever a rate or throughput component is used to quantify performance, it is accompanied by some latency or response-time metric to “qualify” the primary metric.
Even the compilers (programs that generate the binaries or other components by which applications run) are measured for their performance attributes. One measures the performance of a compiler simply by timing how long a specific compile job takes to complete. In many cases, simple wall-clock time is the best way to measure an application's performance, as it lends itself easily to generating a rate in operations per some appropriate time.
The Vehicle: Characteristics of a Good Workload
Once you have identified a meaningful performance metric, the next step is identifying the means by which you will stress the application inducing a load or producing work. A very difficult hurdle to overcome, this issue is probably the most important single aspect of performance work. The performance benchmarking community refers to these synthetic 'workloads' as 'benchmarks'. Benchmarks and workloads are truly two different quantities. The following comparison highlights some of the main differences between the two quantities. (I personally prefer the term 'workload' for generic application performance analysis.)
- A benchmark has the following characteristics:
- An industry standard that goes through a thorough specification and qualification process by some governing body of interested parties, such as a consortium
- Pertains only to a specific application type (web, messaging, database)
- Produced for the express purpose of vendor competition
- Results must be audited by the governing body to be published
- Results are published into the public domain for general consumption
A workload has the following characteristics:
- Is usually 'home grown' by the application vendor
- Often is a variant of some regression test that was later modified
- Specific to the task of inducing work
- May or may not produce a results output that indicates performance level
- Targets a specific application
- Usually not generic enough to apply across applications and/or architectures
This discussion will use the term 'workload' going forward. Understanding what makes a good workload is paramount to accurately quantif ying application performance. Below are some critical characteristics that a workload must satisfy in order to be truly useful in performance-optimization work.
Workloads must be measurable
One must define a quantifiable metric that represents performance.
Workloads must be reproducible
The measurement must be repeatable and consistent; variance from run to run must be low to non-existent. Reproducibility is necessary. Otherwise, you will not be able to measure performance accurately from run to run. Run duration often plays a key role in whether results are repeatable or not. If your results vary by more than 2% from run to run, red flags should go up. Stop your work and figure out why. Extending the runtime may be all that is required to eliminate run-to-run variances, but if not, you have more work to do in order to eliminate the variance. Note that averaging multiple results that vary is not a solution to this problem.
Workloads must be static
The measurement must not vary with time. This issue can be tricky, as it speaks to a term performance engineers refer to as “Steady State”. An example of a workload that does not meet this criterion is a case where you run a workload that performs some heavy file I/O during the test, and five minutes into the run, the disk has become greater than 75% full. As the disk fills, file read and write operations take longer and longer to complete. As a result, the performance will slowly degrade over time. Thus, the workload is not static.
Workloads must be representative
The work must be typical of the stress put on the system under normal operating conditions. This issue seems simple enough, but it can be very tricky. Ask yourself the question, "what good is measuring the performance of my application while performing functionality that no one will ever utilize?" This concept is what representation is about. As important as this criterion is, you should not spend an inordinate amount of time trying to create the perfect workload, as there is no such thing. Quantifying performance with a workload that gives you good code coverage should be your goal.
Even benchmark industry bodies such as the Transaction Processing Performance Council (TPC) and Standard Performance Evaluation Corporation (SPEC) struggle with representation. There is no such thing as a 'one size fits all' benchmark for all Web servers, all databases, etc. Each is unique and needs to be treated as such. If your test incorporates most of the functionality end-users will exercise, and the distribution (weighting) of work across components is what you believe to be accurate, then you have done your due diligence with respect to representation.
Workloads must be stable
The workload must not exhibit or create a less-than-stable system state. One might assume that workload and application stability are required for this work, but both require mentioning for the sake of completeness. If either the workload or application is not stable, optimizing performance will become a near-impossible feat. While it is imperative for software architects to design workloads and applications with performance in mind, the task of measuring their performance cannot begin until both the workload and application have reached some level of maturity. Therefore, measuring performance of pre-beta-quality applications (or with such workloads) is highly discouraged.
The Domino Effect: Everything Hinges on the Baseline Measurement
Once you have identified a quality workload for your performance project, you must take a baseline measurement. You will compare all subsequent measurements to this measurement. It is your basis for comparison and provides the reference for all future work. Due to the criticality of the baseline measurement, you must ensure that it encapsulates the absolute best performance the solution is capable of exhibiting in its current state. If the baseline measurement is artificially low (or high), it will cause subsequent measurements to reflect gains (or regressions) that are not genuine. It is imperative that you take all necessary steps to ensure the establishment of a quality baseline before moving on.
A solid baseline measurement has the following characteristics:
- It is the most important step in performance-optimization work
- It verifies that the workload is suitable for your work
- It sets the standard for all future improvements
- It must utilize the correct performance metric
- It must exhibit the best initial performance possible
In order to ensure that a baseline is meaningful and truly representative of how the current solution performs, it is important to discuss certain aspects of tuning with regard to taking the baseline measurement. One might consider any tuning work to be strictly a 'post-baseline' activity, but since we are discussing optimization of software, it is important to ensure that system-level components (hardware, OS, BIOS) are not limiting solution performance artificially.
For example
The presence of a disk or network I/O bottleneck will limit overall performance and keep the system from becoming fully saturated with respect to processor utilization. Measurement of a baseline at this point would be ill advised. You must remove system-level barriers (configuration issues) before taking the baseline measurement. Always attempt to use the latest technology available to help ensure that I/O subsystems and other components are not problematic.
A Recipe for Success: The Top Down/Closed Loop Methodology
Over the past eight years, I have been involved with many performance-tuning engagements spanning multiple Independent Software Vendors' application architectures and end-users. None of these engagements would have concluded with meaningful performance gains if not for our adherence to a strict, clearly defined process. This process, developed many years ago by the Intel® Application Solution Center, is the 'recipe' by which our performance-tuning work is conducted.
This process is known as “The Top-Down, Closed-Loop” approach to software-performance optimization, and it is vital to success. Software performance work is not an art form; it is a science. Tuning software does not require a marvel of software engineering or a software guru. Often extremely bright software architects needlessly flounder with performance optimization of their own application codes due to lack of process and lack of scientific methods used to conduct experiments.
This process is not complicated. The Top Down, Closed Loop approach actually simplifies and focuses software-tuning projects by clearly and concisely laying down the ground rules and workflow. Below are the tuning levels referred to be the Top Down part of the approach, followed by the criteria defined by the Closed Loop process:
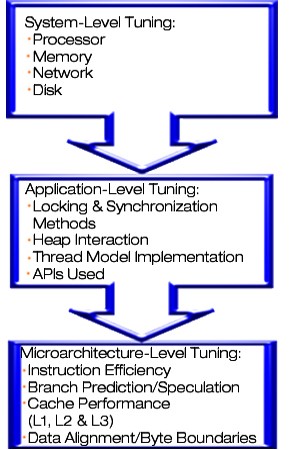
Figure 2. The Top Down Tuning Levels and Their Components
We adhere to a Top Down process because of the dynamics between tuning levels. Developers must clearly understand this concept before moving on. Very simply put, issues at a higher level can “mask” performance problems that originate below. You should therefore eliminate high-level issues before drilling down to a deeper level.
For example
Modifying application code would not be useful while some system-level problem, such as an I/O or memory bottleneck, exists. That is, the application would not exhibit its true behavior, because the I/O bottleneck would “mask” other application attributes. The same is true for microarchitecture problems such as cache misses, processor stalls or incorrectly predicted branches.
Spending time trying to defeat such problems before all application issues are addressed is not useful, because the microarchitecture behavior will undoubtedly change as a result of changes made to application code.
The other component of our methodology is the Closed Loop cycle, which dictates the steps, order, and flow of performance-tuning iterations. The process ensures that the right things are done right, at the right levels, and in the right order. It mandates the “What”, “When” and “Why” of performance work. Working inside the Closed Loop process helps to maintain focus and limit distractions that might otherwise lead an investigation astray. Below are the steps involved in the Closed Loop cycle and some key points to keep in mind:

Figure 3. The Closed Loop Cycle
Keep the following key points in mind while navigating inside the Closed Loop:
- Use the right workload/benchmark
- Measure in such a way that data of interest is minimally affected
- Look for unexpected results and data out of tolerances; consider whether the data clearly identifies the performance issue
- Keep it simple
- Focus on one issue at a time
- Change only one thing at a time
- Rate alternatives based upon greatest potential payback
- Consider the ease (or difficulty) of implementing the solution
- Keep track of all changes to be able to back-track if necessary
- Verify that the results meet your expectations
- Remember that this is an iterative process
The Closed Loop cycle also helps establish and maintain that scientific methods are used throughout your work, such as good note-taking skills. Any good scientist knows the value of thoroughly documenting experiments. The following is a non-exhaustive list of some key elements to capture when performing your experiments:
Date and time: Always make reference to when work was conducted
Hardware, software, BIOS and other versioning information: Always document current versions of your hardware and software (including BIOS)
Hardware and software configuration information: This information is vital, and any change may alter your results
What experiment you are conducting: You modified something and need to re-measure – what changed and why?
Detailed results of your experiments: Results determine next steps and provide a reference for future experiments
Choose Your Weapon: The Performance Tool Hierarchy
Much performance work would be impossible if not for the software tools that make data collection and analysis possible. Their main purpose is to diagnose performance issues in software or hardware. Before considering specific tools and their attributes, it is vital to make reference to the Top Down levels with respect to tools usage. Because performance work is conducted from the Top Down, it is important to apply this methodology when using performance tools to collect and analyze data in way that provides the right information at the right level.
You will undoubtedly start your performance project by collecting and analyzing system-level data by using tools designed to provide such information. Once all system-level issues (memory, disk I/O, network I/O, etc.) have been addressed, you should migrate your data-collection and analysis efforts to the application level. Do this by using tools that specialize in providing application-specific data, such as APIs, synchronization/locking issues, hot methods/modules/functions, callers and call order, etc.
These tools provide functionality such as call graphing, or “call trees”, time-based or event-based profilers, instrumented compilers and application debuggers. After you feel that you have exhausted your application-tuning efforts, turn your attention to the internal components of the microprocessor, better known as the microarchitecture. These components include the L1 and L2 caches, branch units, floating-point units, integer units, etc.
We tune at this level using tools designed to provide insight as to how these subsystems within a microprocessor perform when executing a particular instruction sequence in your application. Tools designed to provide this data scrutinize subsystem events and derive ratios such as cache hit/miss ratios, branch-prediction/mis-prediction ratios, instruction stalls that result in pipeline flushes, the Clock-Cycles-Per-Instruction ratio (CPI), path-length (instructions/operation), etc. One of the tools specifically designed to capture this information is the Intel® VTune™ Profiler.
Once you have collected the data, an analysis of the tool's output can give you great insight as to how well your software performs on Intel® architecture. Software dictates microarchitectural performance. Determining that a particular event or behavior within the microprocessor is occurring (good or bad) is just the beginning, as it is symptomatic of a lower-level problem. You must determine the root cause by locating the software component responsible for triggering such events or behaviors. Intel VTune Profiler can help you do just that.
It is extremely important to have the ability to correlate your results whenever possible. The only way to do so is to collect similar data sets with multiple tools for comparison. This is not always easy, as some tools are very specialized, and finding another tool that provides the same data for purposes of comparison can be next to impossible. The bottom line is always to try to correlate your findings when possible. More data can only help your cause, assuming that the data is valid and collected in a manner consistent with the methods discussed in this paper.
There are a number of performance tools available in the public domain. Most software vendors have both public and private versions of their tool offerings. The private versions afford them some advantage when it comes to diagnosing performance issues in their own software. Since more data is always better than less, having more tools at your disposal is better. Going into the code to address an issue that has been identified and corroborated using multiple data sources can be the difference between locating the problem and going on a wild goose chase.
Performance tools make this work possible, but they are by no means without their own set of problems.
Each performance tool will itself affect the quantity it measures, to some degree. We refer to this attribute as the level of intrusiveness a tool exhibits. The amount of intrusiveness can vary depending upon the tool, what it is measuring and the workload it is using.
If a tool is highly intrusive, it typically impacts performance in a significant way measurable at typically 5% or greater. If the intrusiveness is low, the impact the tool has on performance is typically ~ 1-2%. Knowing that the insight performance tools provide you comes with a price, it is important first to measure any modifications to software or hardware without the use of tools. This practice allows you to measure the performance impact of your modification, good or bad, remembering to perform multiple runs to ensure repeatability of your results.
The table below lists some popular performance tools found in the public domain, as well as their primary traits:
| Performance Tool | Tool Type | Tuning Level | Level of Intrusiveness | Level of Difficulty | Vendor Link |
|---|---|---|---|---|---|
| Windows Performance Monitor* | Time vs. Event Sampling System | Application | Low | Easy | Perfmon* |
| Microsoft C++ Compiler* Toolset | Debugger | Application | High | Moderate | Visual Studio* |
| Visual Studio* Debugging Tools | Debugger | Application | Low to Moderate | High | Debugging Tools* |
| Debugging Tools for Windows* | Debugger | System, Application | Low to Moderate | High | Debugging Tools* |
| Intel VTune Profiler | Profiler, Call Graph Sampling | System, Application, Microarchitecture | Moderate to High | Moderate | Intel VTune Profiler |
| Intel® C++ Compiler | Instrumented Compiler, Debugger | Application, Microarchitecture | Moderate to High | Moderate | Intel C++ Compiler |
While the list of performance tools above is far from exhaustive, it includes some of the more popular choices among software-performance engineers. The Microsoft Platform Software Development Kit (SDK) and Driver Development Kit (DDK) are excellent resources for many free specialized tools from Microsoft. Of course, the Internet is always a valuable resource for finding software tools. As this technology is ever-changing, search often for new tools and updates to old ones.
In summary, remember these key points when considering performance tools and their usage:
- Use the right tool at the right level as it applies to the Top Down methodology
- Always attempt to use multiple tools in order to correlate your findings
- Avoid drawing conclusions from any single piece of data, whenever possible
- Collect data in a way that does not severely alter the results (intrusiveness)
- Use a remote system as the “collector” when applicable
- Remember that compilers are performance tools and use them as such
Peeling the Onion: Symptom versus Root Cause
I think of software performance work as being analogous to peeling an onion. Like an onion, performance optimization has layers upon layers, and the more you peel away the layers, the closer you get to your goal. Half of this work is determining symptoms, and the other half is finding their root cause (or causes). The Top Down/Closed Loop methodology dictates that once you identify one issue, you must eliminate it before you can move on to next iteration. Thus, in each of the iterations of the Closed Loop Cycle, you must perform root-cause analysis of the current issue.
Determining the root cause of symptoms does not get easier or harder as you drill down from System to Application to Microarchitecture. The root causes of some issues are simply easier to determine than others. The process mandates that you take them as they come. Focus and adherence to the process are the keys to success.
Adding Hardware Was Not Enough: A Personal Experience with Root Cause Analysis
One particular software vendor engaged Intel® Solution Services in an effort to optimize its messaging application written for Windows* NT Server 4.0. The application was a messaging server, compliant with the Simple Mail Transfer Protocol (SMTP), Post Office Protocol 3 (POP3) and Internet Message Access Protocol 4 (IMAP4) specifications, designed to send and receive e-mail within a corporate IT infrastructure and over the Internet.
To facilitate tuning of the application, we ran a messaging benchmark against the server to generate stresses typical of messaging server workloads. We used Mailstone* 2.0, one of the premier messaging benchmarks at the time. After collecting Windows Perfmon data via logging mode, we scrutinized the logs with the chart mode and analyzed the output.
After reviewing the logs, we noted a potential disk I/O problem – specifically, the transfer latencies and disk-queue length counters (sec/transfer and avg. disk queue length) under the logical disk object were out of tolerances. After analyzing the Perfmon logs, we determined that the disk subsystem was saturated. Once requests from the application made their way through the OS to the disk I/O subsystem (SCSI device driver), the time to process a single request by the subsystem steadily increased past acceptable limitations and created a queue.
After determining that a disk I/O bottleneck existed, our first instinct was to add more physical disk drives to the RAID (Redundant Array of Independent Disks) array that contained the messaging stores or mailboxes. We believed that this strategy would help to reduce the growing transfer latencies during our tests. The RAID array was already properly tuned to deal with the small, random nature of the I/O requests sent by the messaging application. Tuning such an array includes adjustment of the number of physical disks, the stripe size, the RAID level (0,1,3,5,1/0), and the write and read cache modes of the RAID controller. Regardless of the robustness of the I/O subsystem we put in place, the system continued to suffer from severe disk-transfer latency issues. We decided to look further into the I/O subsystem of the application architecture in order to solve the problem.
We used a file-system tool called Filemon*, a tool developed by a software group known then as Win Internals (now SysInternals Group). Filemon is a lower-level tool (provides more detailed information) than Perfmon and enables the user to measure which processes interact with the file system (NTFS*), at what rate, and for what duration. We decided to measure the file system hits that resulted from sending a single mail message as an initial test.
Instead of capturing the expected four to five hits on the file system per mail message, we found that our single mail message interacted with NTFS more than 30 times. The developers corrected the issue in their application’s I/O architecture by modifying the code to set up caches in main memory for work that had previously utilized NTFS to temporarily store message header, data, and error-control information. The real solution was in modifying software, rather than hardware, and it enabled us to break through the disk I/O bottleneck.
The above is a good example of symptom versus root cause analysis and why it is important to get to the cause in the software compared to simply modifying the hardware to achieve the desired result. Even if adding the extra disks would have solved the transfer latency problem, it would have been the wrong thing to do initially. Going after the cause in software was exactly the right thing to do, regardless of the outcome. Adding the disks would have been an acceptable solution only after determining that there was no issue in the software.
The Scientific Method: Change Only One Thing at a Time
Applying scientific methods during software performance work is imperative to achieve positive results in relatively short order. It takes time and resources to undertake software performance optimization work as an ongoing process to improve a piece of software. While changing only thing at a time is not the only way to apply the scientific method, it is the most important with respect to this work.
The Closed Loop process states that a single modification or solution must be applied to a given problem in software, and the software must be retested in order to know whether the solution was effective. Changing multiple software components, configuration parameters, environment variables, etc. can seem like a method for expediting the process, but in reality, it only impedes progress.
If you change multiple items, retest, and find your results to be either positive or negative, you will be unable to determine which change improved or degraded performance. As a result, it will then be necessary to undo one of the changes you made. Retesting to isolate the relevant change costs the time necessary to run more experiments. Adhering to the process will save you time and money.
Back to the Beginning: This is an Iterative Process that Never Ends
Completing multiple tuning iterations that each result in modest to significant performance gains is a great start, but it is certainly not the end of your work. If you adopt this methodology in a quest to improve the performance of a piece of software and perform the steps outlined in this paper, you will undoubtedly find that your work is never really quite finished.
As a developer of software, you know that the application you just tuned will change to address some new business problem(s) requiring new functionality to be added. These changes will inevitably necessitate additional performance optimization. The fact that you have been through this maze before, however, will make your task seem simpler than it was before. Happy hunting!
Additional Resources
The following resources will be useful to developers conducting further research into software performance optimization:
- Gordon Moore and Moore’s Law
- Intel VTune Profiler
- Intel C++ Compiler
- Windows Performance Monitor*
- Microsoft Windows* SDK
- Microsoft Windows SysInternals
About the Author
 Paul Del Vecchio is a senior performance analyst reporting to the Core Software Division (CSD) under Intel’s Software and Solutions Group (SSG). Paul is a Microsoft Certified Systems Engineer (MCSE) who has spent the past eight years helping end-users and Independent Software Vendors achieve optimal performance of their solutions running on Intel® architecture.