Ceph[1] is an open-source distributed software platform that provides scalable and reliable object, block, and file storage services. When Ceph was originally designed, it was deployed on conventional spinning disks with low IO performance. Since storage technology has progressed rapidly, modern NVMe devices and persistent memory with high IO speed have changed the status of Ceph.
Ceph OSD (object storage daemons) is an important component of Ceph responsible for storing objects on a local file system on behalf of Ceph clients. Ceph OSD uses the CPU, memory, and networking of Ceph cluster nodes for data replication, erasure coding, recovery, monitoring, and reporting functions. To enable Ceph to better utilize these new technologies, the community developed Crimson[2] as a replacement for Ceph-OSD. Crimson minimizes latency and CPU overhead by using high performance asynchronous IO. Crimson uses a new threading architecture designed to minimize context switches and inter-thread communication when handling an operation.
Crimson is a new Ceph-OSD for the age of persistent memory and fast NVMe storage. It is still under active development and feature-wise, not yet on par with its predecessor (classic-OSD). For the needs of development work and the comparison with classic-OSD, we describe in detail the whole process of testing crimson, including environment consideration, Crimson configuration, and Benchmarking methodology. We also discuss the stability and scalability of the benchmarking, including multi-core simulation. Finally, we compare classic-OSD and the Ceph benchmarking tool, CBT.
Environment consideration to benchmark Crimson
CPU
In general, the performance of Crimson is proportional to the performance of the CPU, since Crimson can fully utilize the CPU core. For Intel CPUs, there are two P-state selection algorithms provided by intel_pstate in the active mode: powersave and performance. We chose performance for our test.
Memory
There is no evidence that memory affects the performance of Crimson except for extreme settings. We used normal settings.
Disk
As Crimson is designed for high-speed devices, we strongly recommend that you use NVMe SSDs or Intel® Optane™ SSDs for testing. Benchmarking with low-speed devices such as HDDs may yield unreliable results. Before testing begins, determine the read/write performance of a backend device to compare it with the client’s performance. The best method is to use fio (flexible I/O tester) to run a read/write workload to get performance figures for the devices.
Precondition
SSD devices that are fresh out of the box (FOB), or in an equivalent state, typically exhibit a transient period of elevated performance, which evolves to a stable performance state relative to the workload being applied [3]. This state is referred to as a Steady State. Therefore, when using devices based on NAND, it is better to precondition the disk to enter a Steady State. This is usually done by writing 2X user capacity with 128KiB/1024KiB (according to the situation) SEQ writes. For random workloads, fill the drive with 4KiB of random data.
Write amplification
Write amplification (WA)[4] is an inevitable phenomenon associated with flash memory and solid-state drives (SSDs) where the actual amount of information physically written to the storage media is a multiple of the logical amount intended to be written. Write amplification impacts device performance. Erase operations are usually taxing and slow operations on the device level. If a use case leads to higher write amplification, a flash device will suffer from poorer performance, due to its controller needing to perform many more writes during the background operations (in addition to erasing the flash).
Write amplification factor (WAF) is a value to represent the degree of write amplification calculated by dividing the amount of data written to flash media by the amount of data written by the host. Recording the WAF during test can help reflect the condition of the device.
Record nand_bytes_written and host_bytes_written before and after test.
[root@]$ nvme intel smart-log-add /dev/nvme4n1
...
nand_bytes_written            : 100%       sectors: 15968284
host_bytes_written            : 100%       sectors: 14453994
[WAF = host_bytes_written(after)-host_bytes_written(before)/nand_bytes_written(after)-nand_bytes_written(before).
Similarly, there is write amplification between host and client, which is an important indicator to measure OSD’s performance.
Crimson configuration
Build and run Crimson
- Clone Ceph and install dependencies.
$ git clone --recursive https://github.com/ceph/ceph.git
[ceph]$ WITH_SEASTAR=true ./install-deps.sh
- Do cmake progress; be sure to use -DCMAKE_BUILD_TYPE=RelWithDebInfo to create a non-debug release.
[ceph]$ ./do_cmake.sh -DWITH_SEASTAR=ON -DWITH_MGR_DASHBOARD_FRONTEND=OFF -DWITH_CCACHE=ON -DCMAKE_BUILD_TYPE=RelWithDebInfo -DWITH_TESTS=OFF
- Change Crimson settings. seastore_device_size is set by 50G by default in ceph.conf which is not enough for sequential workloads. Set this value according to the size of your hard drive. If you use vstart, add -o seastore_device_size = 200G directly in the command line.
[ceph]$ cat ./src/common/options/crimson.yaml.in
...
- name: seastore_device_size
type: size
desc: Total size to use for SegmentManager block file if created
level: dev
default: 50_G
...
[ceph]$ vim ./build/ceph.conf
...
[osd]
seastore_device_size = 200G
- Build Crimson
[build]$ ninja
- Run Crimson. vstart.sh is a script that allows you to deploy a local cluster for development purposes. At this stage, it is preferred to run Crimson on a single node.
[root@build]$ MGR=1 MON=1 OSD=1 MDS=0 RGW=0 ../src/vstart.sh \
-n -x --without-dashboard --nodaemon --redirect-output --nolockdep \
--crimson --seastore --seastore-devs /dev/xxx #block device
SeaStore backend
SeaStore[5] is a new storage backend for Crimson targeted at emerging storage technologies including persistent memory and ZNS devices. SeaStore is designed natively for Crimson's threading/callback model and target NVMe devices. Although Crimson is plan to keep the support of HDDs and low-end SSDs via BlueStore, and SeaStore is still under active development, SeaStore is recommended for use in benchmarking.
Benchmarking methodology
Benchmarking scenery for Crimson
Generally, IO tests contain random/sequential reads/writes with different io-depths/jobs on various hardware configurations. For Crimson, there are some specific limitations or precautions. First, it is likely to crash during testing in the development phase. Go to out/** for logs and submit a tracker[6] if necessary. To reduce the impact of cache in read cases, it is better to kill the OSD and restart it (using an old ceph.conf) after prefilling before the read test procedure. Finally, similar to disk precondition, SeaStore needs preconditioning to benchmark in a stable state with internal garbage collection. We are working on a way to do this step.
Benchmark Crimson with RADOS bench
Ceph includes the rados bench [7] command to do performance benchmarking on a RADOS storage cluster.
- To run RADOS bench, first create a test pool after running Crimson.
[root@build]$ bin/ceph osd pool create _testpool_ 64 64
- Execute a write test (block size=4k, iodepth=32) for 60 seconds.
[root@build]$ bin/rados bench -p _testpool_ 60 write -t 32 -b 4K --no-cleanup
- Execute a randread test (block size=4k, iodepth=32) for 60 seconds using the previous pool in write test.
[root@build]$ bin/rados bench -p _testpool_ 60 rand -t 32 -b 4K
rados bench seconds mode [-p pool] [ -b objsize ] [ -t threads ]
The options are explained below:
- Run the benchmark for seconds.
- Specify the mode: write, seq, or rand. seq and rand are read benchmarks, either sequential or random. Before running one of the reading benchmarks, run a write benchmark with the –no-cleanup option.
- -p: the pool name.
- -b: object size, default is 4 MB. Only valid only in write mode.
- -t: simulated threads (parallel writes), default is 16
- --no-cleanup: Before running one of the reading benchmarks, run a write benchmark with the –no-cleanup option
Benchmark Crimson with flexible I/O tester (fio)
Fio is a tool that simulates desired I/O workloads by using job files that describe a specific setup. Fio contains many test engines, such as RBD (RADOS Block Device) engine. We can easily run tests on RBD using fio to measure throughput and latency.
- Create a test pool and an RBD image.
[build]$ bin/ceph osd pool create _rbd_ 64 64
[build]$ bin/ceph osd pool set --yes-i-really-mean-it rbd size 1 && bin/ceph osd pool --yes-i-really-mean-it set rbd min_size 1
[build]$ bin/rbd create rbd_test --size 20G --image-format=2 --rbd_default_features=3
- Write a fio test script[8].
[global]
ioengine=rbd # use rbd engine
clientname=admin
pool=_rbd_
rbdname=rbd_test
rw=randwrite   # randwrite, randread, read(seq), write(seq), readwrite(mix)
bs=4k # block size
runtime=60     # test time
group_reporting
direct=1 # use non-buffered I/O
numjobs=1 # number of clones of this job

[rbd_iodepth32]
iodepth=32
- Run the test.
$ fio ./rbdtest.fio
Similar to RADOS bench, run a write test before a read test.
Monitoring tool
Perf
Perf is a profiler tool that abstracts away CPU hardware differences in Linux performance measurements and presents a simple command line interface.
Use perf stat to keep a running count during benchmark process execution. You can customize the parameters that need to be fetched.
[root@]$ PID=$(pidof ceph-osd)
[root@]$ perf stat --timeout 5000 + str(self.last_time)
-e cpu-clock,context-switches,cpu-migrations\
cpu-migrations,cycles,instructions,\
branches,branch-misses,cache-misses,cache-references \
-p ${PID}
IOstat
The iostat command is used for monitoring system input/output device loading by observing the time the devices are active in relation to their average transfer rates. We compare a real workload with device loading to analyze write amplification.
[root@]$ iostat -x -k -d -y $test_time 1
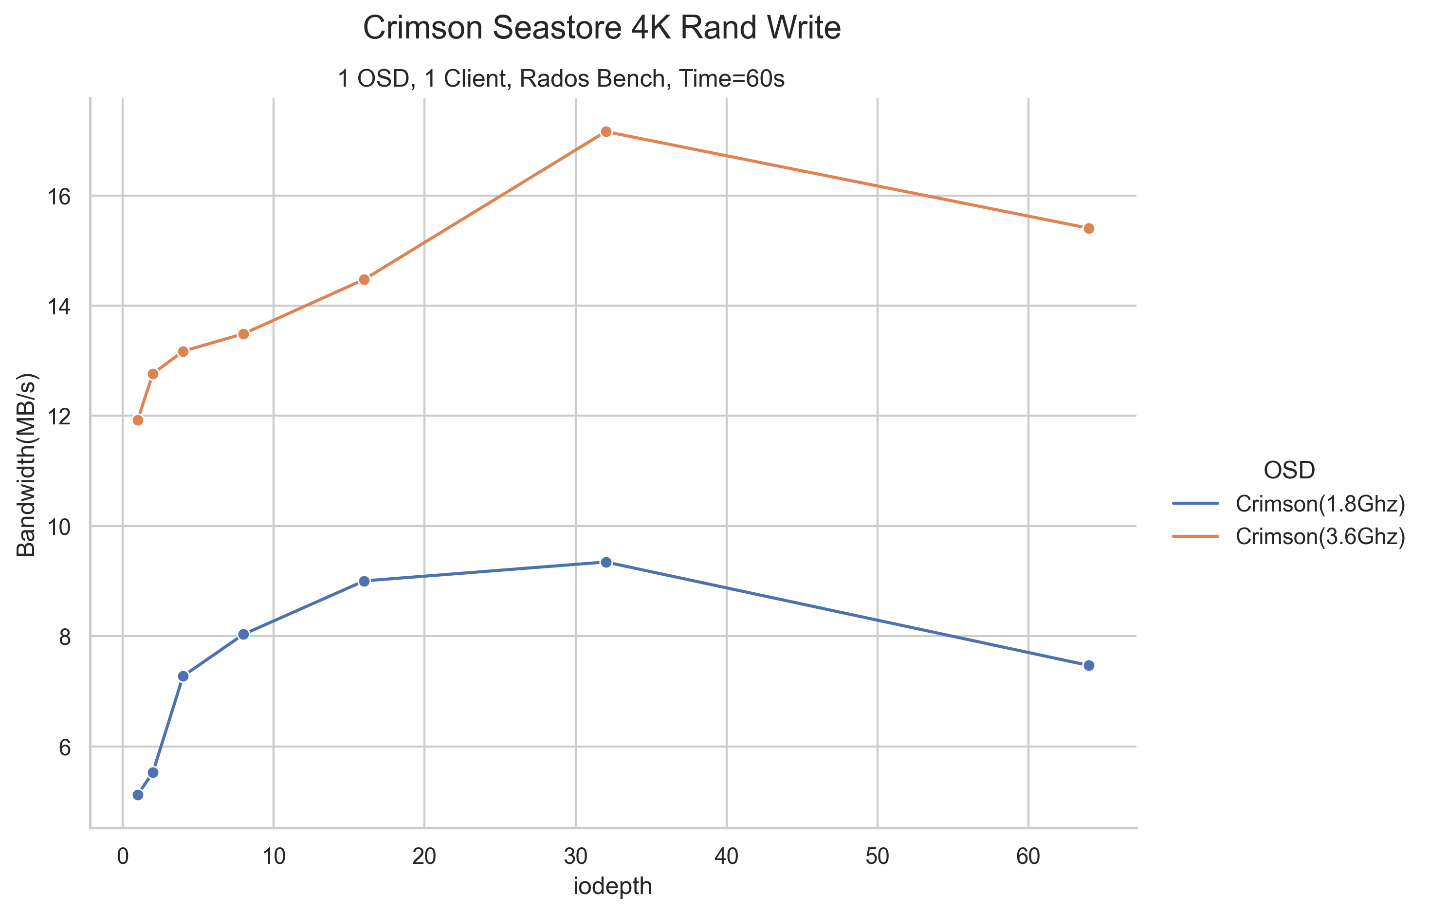
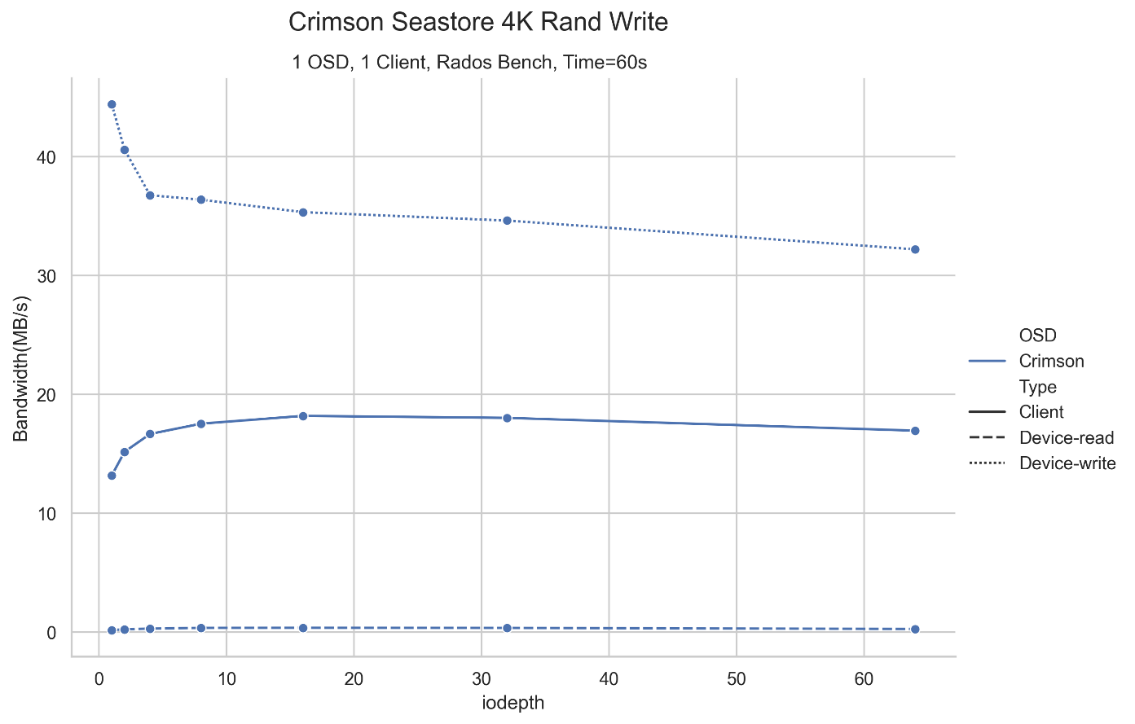
Result example

Benchmark considerations
Get repeatable results
As Crimson is still under active development, the benchmark outcomes may vary between different branches, machines, or test cases. The best-known method is to benchmark Crimson using the same branch on machines with similar configurations for different test cases. Besides, drawing on the principle of steady state in an SSD test, we could run benchmark process multiple times until:
- Range(y) is less than 20% of Ave(y): Max(y)-Min(y) within the measurement window is no more than 20% of the Ave(y) within the measurement window
- Slope(y) is less than 10%: Max(y)-Min(y), where Max(y) and Min(y) are the maximum and minimum values on the best linear curve fit of the y-values within the measurement window, is within 10% of Ave(y) value within the measurement window.
y is the value of one test result; you could adjust these rules based on requirements.
Multi-core simulation
It is hard to talk about scalability since Crimson does not support multi-core at this stage. However, we could do multi-core simulation by running multiple instances of Crimson on the same device. To do this, first partition the device using fdisk or other tools. Then mount each part to one directory and make each OSD correspond to one directory in the configuration file ceph.conf. Or you can add each partition directly to the parameters of vstart. The script will automatically map partitions to OSDs
Comparison with classic-osd
At present, the general configuration of Ceph in production scenarios is classic-osd with BlueStore. The performance of classic is significantly higher than that of Crimson because the former supports multi-core, and the latter does not. For a fair comparison with Crimson running on a single core, we can bind the classic-osd process to one core using taskset.
CBT and Crimson stress tool
CBT[9] is an open-source test tool that can automate a variety of tasks related to testing the performance of Ceph clusters. CBT contains many benchmark modules like RADOS bench and could record more system information with collectl and other tools, including perf, blktrace, and valgrind. Specifically, the Crimson stress tool[10] is a simplified benchmark tool for Crimson that includes the test procedures mentioned in this article.
Summary
This article describes the procedure for testing crimson, including environment configuration, preprocessing, testing steps and some considerations. You can build a set of testing procedures for crimson according to this article or use existing CBT or stress tools for testing.
Reference
- Ceph (https://ceph.io/en/)
- Crimson (https://docs.ceph.com/en/latest/dev/crimson/crimson/)
- Solid State Storage (SSS) Performance Test Specification (PDF) (https://www.snia.org/sites/default/files/technical-work/pts/release/SNIA-SSS-PTS-2.0.2.pdf)
- Write amplification (https://www.tuxera.com/blog/what-is-write-amplification-why-is-it-bad-what-causes-it/)
- SeaStore (https://docs.ceph.com/en/quincy/dev/seastore/?highlight=seastore#seastore)
- Tracker (https://tracker.ceph.com/projects/crimson)
- RADOS bench (https://access.redhat.com/documentation/en-us/red_hat_ceph_storage/4/html/administration_guide/ceph-performance-benchmarking)
- FIO Doc (https://fio.readthedocs.io/en/latest/fio_doc.html)
- CBT repository (https://github.com/ceph/cbt)
- Crimson Stress Tool (https://github.com/ceph/cbt/blob/master/tools/crimson/crimson_stress_tool.py)