
Measuring App Responsiveness
The responsiveness of the apps can be evaluated by measuring the compile time and the launch time. The compile time is the time taken by the apps to get installed onto the device. The launch time consists of the first launch and subsequent launch time measurement. First launch time is the time taken by the app to load and make its content visible to the user for the first time after the app has been installed. Subsequent launch time is the time taken by the app to load and display its contents after it has been launched a couple of times.
This data provides us with an insight into the performance and responsiveness of Android and the device on which it is installed. Hence collecting these values provides us with a way to measure the responsiveness of Android.
However, manually collecting the compile and launch time has issues:
1. Not 100% accurate due to human error
2. Requires human resources to perform
3. Collections are tedious to perform
Hence, we need to automate collecting compile time and launch time. Below is our solution.
Our first step was to define the different values we can collect to measure the responsiveness of an Android application.
- Compile time: We take the dex2oat time as the compile of the Android application. dex2oat takes a dex file and compiles it. The result is essentially an elf file that is then executed natively. So instead of having bytecode that is interpreted by a virtual machine, it now has native code that can be executed natively by the processor. This is also called as AOT (ahead-of-time) compilation.
- First launch: First launch is also known as a cold start. A cold start refers to an app starting from scratch. Cold start happens when your app’s being launched for the first time since the device booted or since the system killed the app. This type of start presents the greatest challenge in terms of minimizing startup time because the system and app have more work to do then in the other launch states.
- Subsequent launch: Subsequent launch, also known as a hot start, is much simpler and has lower overhead than a cold start. In a hot start, the system brings your activity to the foreground. If all your application’s activities are still resident in memory, then the app can avoid having to repeat object initialization, layout inflation, and rendering. (3)
For collecting compile time, we collect the data from the logcat.
dex2oat : dex2oat took 238.610ms (578.090ms cpu)
dex2oat gives us two times. The first time is the time taken by only the dex2oat. The second time is the total time taken by the CPU.
There are two ways to consistently capture launch times; one way is by using a high-speed camera to capture the frames displayed by the device and calculate the time taken by the device to launch the app by comparing the frames collected by the high-speed camera. The second way is to collect the times from the logcat. We chose to use the second method. In this procedure, we read the data from the ADB (Android debug bridge) logs to measure the first and subsequent launch times. (2) After the app is launched, the script gathers Displayed time from the logcat, as shown below.
ActivityManager: Displayed com.android.myexample/.StartupTiming: +768ms
The time shown above includes the entire time that it took to launch the process (com. android.myexample), It includes the time it took to load the code, initialize the classes that are used at the start time, run layout, and draw the app for the first time.
Below are the steps we have defined to collect the compile time and launch time.
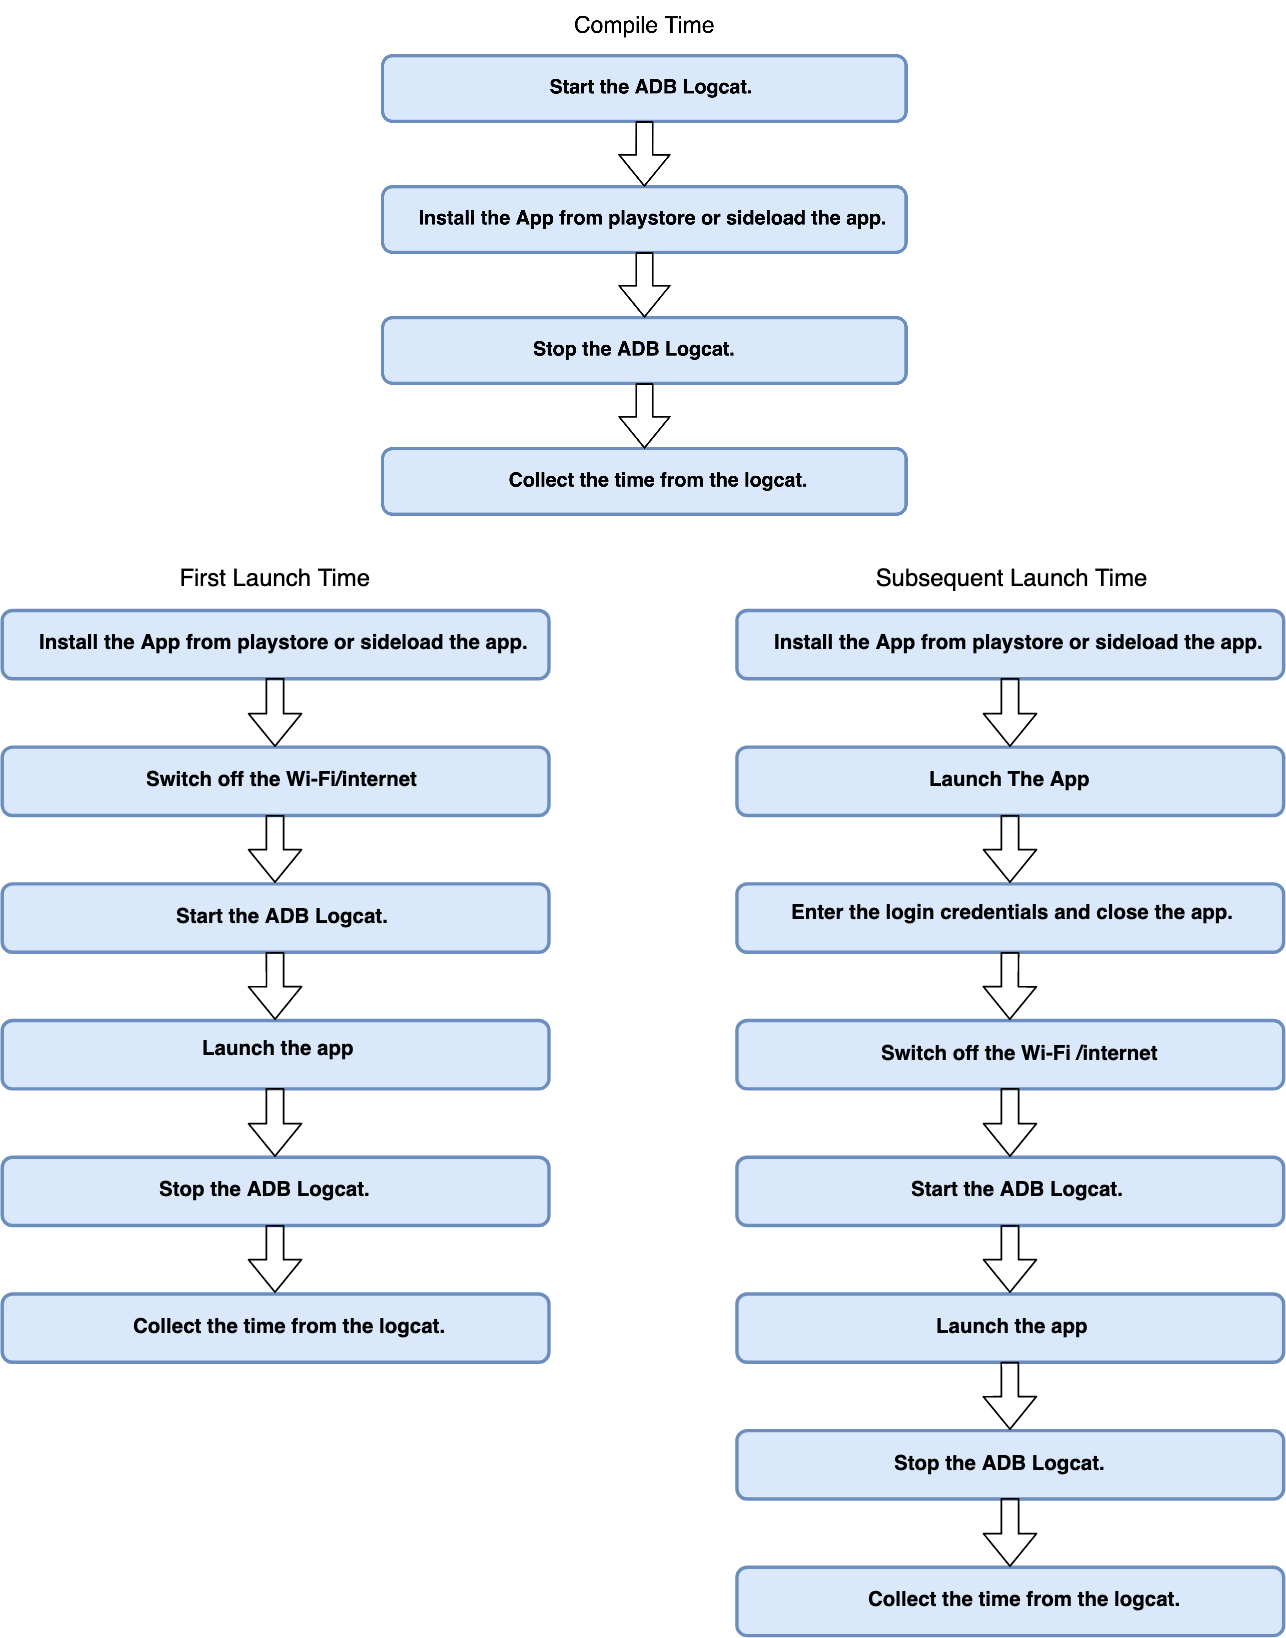
Our approach is a bash script that collects launch time data and compile-time data according to the steps defined above.
The launch and compile-time data collected is not always consistent. To get consistent data we need to detect the outliers and deal with them appropriately. If there are outliers present, then we need to recollect the data and recheck to see if the new data is consistent. These steps are repeated until we get consistent data.
We chose four Android apps to test our script on because these are some of the most commonly and widely used apps in Chromebooks. Refer the below Table 1 for the list of apps.
|
Application |
Category |
|
Adobe Photoshop Lightroom |
Photography |
|
Dropbox |
Storage |
|
Evernote |
Productivity |
|
WeVideo |
Video Players and Editors |
RESULTS
Our evaluation platform is an Intel® NUC KIT NUC715DNHE, which uses an Intel® Core™ i5-7576U processor with two cores. The processor can reach up to 4 GHz frequency in Turbo mode with 8GB RAM. We have ensured that “Internet Speed Test” is executed before collecting the data to confirm the internet bandwidth is same while execution of the tests.
Performance Gain:
Table 2 below shows the time saved by collecting Launch and Compile Time Data using the technique described in the article
|
Metric |
Manual (sec) |
Automation (sec) |
Time Saved |
|
Compile Time |
338 |
85 |
74.85% |
|
Launch Time |
1816 |
443 |
75.61% |
Conclusion
This method has made the collection of launch time and compile time easier and faster. This method can be integrated with regular testing methods so that to evaluate the launch time and compile time performance of various apps on different images.
Email to ask questions, or discuss issues: jaishankar.rajendran@intel.com or biboshan.banerjee@intel.com
TEST CONFIGURATION
Software: Android 9.0, Kernel 4.19, OpenGL ES 3.1 Support, Fast Boot
Hardware: Intel® Core™ i7-7576U Processor, 2x4.0 GHz CPU, 8GB