This article focuses on a new graphical user interface (GUI) of the latest version of the Intel® Advisor 2021. The article helps you enable and use the new GUI and describes new Intel Advisor features.
For detailed description of the new Intel Advisor GUI and features, see the Intel Advisor User Guide.
Run Intel® Advisor with the New GUI
To run the Intel Advisor, set the environment variable as follows:
On Windows* OS:
- Open a command prompt window.
- Run a .bat script to set Intel Advisor environment variables:
<install-dir>\env\vars.bat - Enter advisor-gui to launch Intel Advisor.
On Linux* OS:
- Open a new terninal window.
- Run a shell script to set Intel Advisor environment variables:
<install-dir>/env/vars.sh - Enter advisor-gui to launch Intel Advisor.
NOTE: You can switch back to an old GUI by setting the ADVISOR_EXPERIMENTAL=advixe-gui variable before running the Intel Advisor.
What’s New
Intel® Advisor introduces a new intuitive graphical user interface providing a unified user experience.
Toolbar
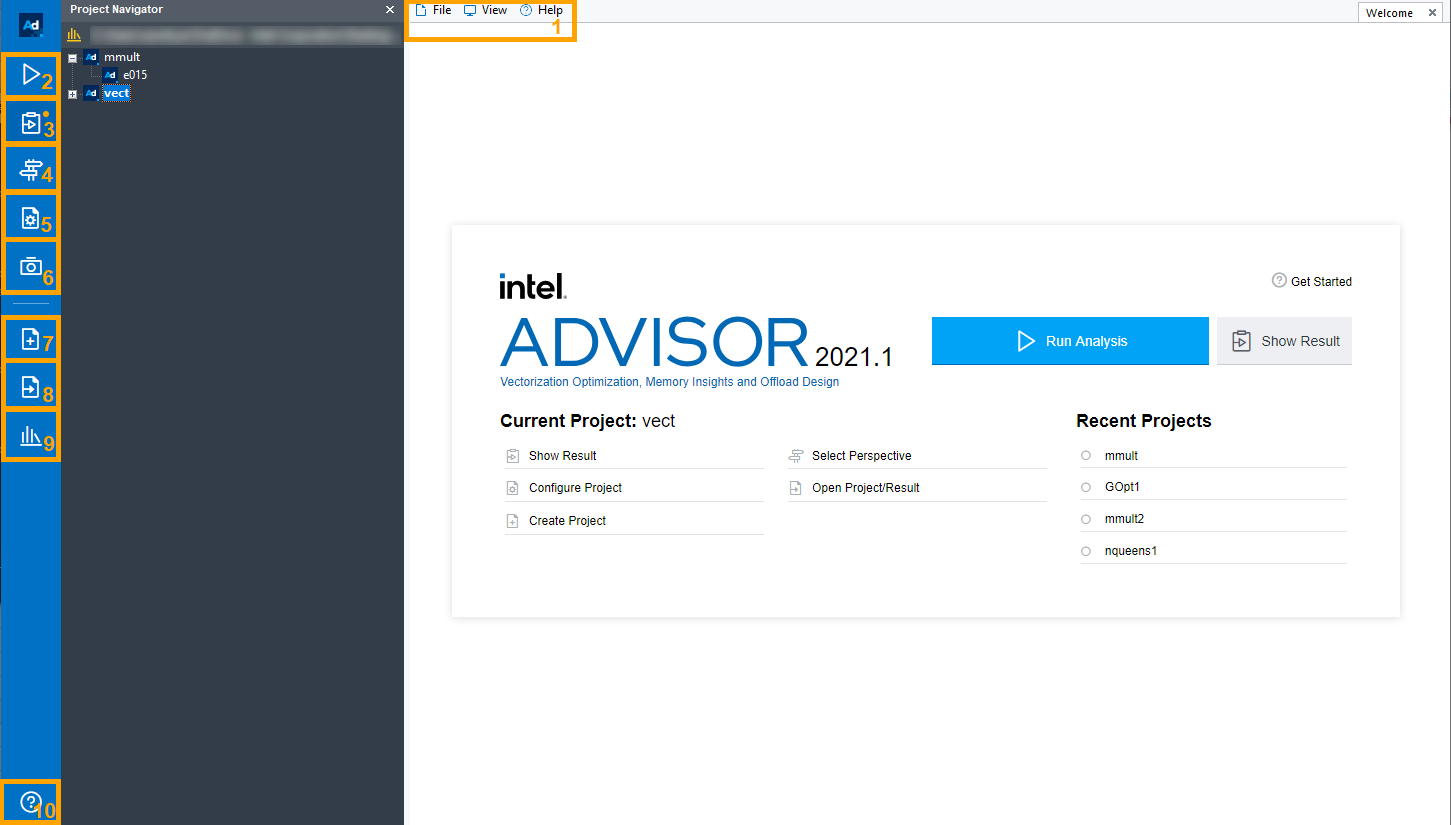
The new GUI comes with an updated horizontal toolbar and a brand-new vertical toolbar. See the table below for details on the functionality of these buttons. In GUI, hover over these buttons to view tips on their functionality.

| 1 | Use the horizontal toolbar menu to create and open projects and analysis results, configure projects, set various options, open new views and panes, and access the Intel Advisor help. |
| 2 | Run the Survey analysis for your project to start collecting data. The Survey data can be reused in each perspective. |
| 3 | Open the Workflow pane. |
| 4 | Open the Perspective Selector window. |
| 5 | Open the Project Properties dialog box. |
| 6 | Create a snapshot for your project. |
| 7 | Create a new project. |
| 8 | Open an existing project. |
| 9 | Open the Project Navigator pane. |
| 10 | Open the Intel Advisor User Guide. |
Perspectives
The new GUI allows you to select a PERSPECTIVE based on the analysis type and workload.
Intel Advisor introduces five perspectives:
- Vectorization, CPU Roofline, and Threading: These perspectives allow you to explore vectorization and threading aspects of an application and analyse performance of the application running on CPU. The functionality covered in these perspectives is the same as in earlier versions of Intel® Advisor. The CPU Roofline is a separate perspective as it provides a different approach to analysis and optimization of workloads.
- Offload Modeling and GPU Roofline: These perspectives allow you to model application performance on an accelerator and analyse performance of your application running on an accelerator. This is a new feature of the Intel Advisor GUI.
Analysis Workflow Tab
The updated Analysis Workflow allows you to configure and run analyses for a current project. From this tab, you can:
- Run a predefined set of analysis types based on the collection accuracy level. NOTE: Higher accuracy level implies higher analysis overhead.
- Start selected analyses with the main Run button.
You can customize each analysis type separately for more specific configurations.
| 1 | From the Perspective Selector pane, you can review and select perspectives available in the Intel Advisor. |
| 2 | Choose a perspective to run for your application. |
| 3 | Use the Analysis Workflow drop-down to select a perspective. |
| 4 | Control execution of a selected perspective: run, start paused, get a command line for a selected configuration. |
| 5 | Select an accuracy configuration preset for a selected perspective. The higher accuracy you select, the more properties are selected for the collection, which helps optimize your application better. |
| 6 | Choose analysis types and analysis properties for a selected perspective. The following analyses are available: Survey, Characterization, Memory Access Patterns, Dependencies, and Performance Modeling. NOTE: Each perspective includes a different set of analyses. |
You can choose a perspective and run it from the Analysis Workflow tab. The analysis results appear once the collection is completed.
Run the Offload Modeling Perspective
The new Intel Advisor GUI introduces a feature to model offloading your application to a target device and visualize the report from the GUI using the Offload Modeling perspective.
To configure the Offload Modeling perspective, use the following panes:
| 1 | Choose the Offload Modeling perspective from Perspective Selector. |
| 2 | Select a Target Platform Model to model your application performance for from the drop-down list. Currently, Intel Advisor supports Gen9 GT2, Gen9 GT3, Gen9 GT4, Gen11 GT2. |
| 3 | Select analyses and analysis properties for the Offload Modeling perspective. You can also select an accuracy level with a pre-defined set of analyses and properties. |
After you configure the perspective, click the ![]() button to run the perspective.
button to run the perspective.
When the execution completes, you will see the Offload Modeling report with a Summary tab opened:
| 1 | Navigate between different tabs of the Offload Modeling report. By default, it opens the Summary page. You can navigate to Accelerated Regions or click See Main Offload Modeling View button (7) to explore detailed metrics for performance modelled for your application. |
| 2 | Review the Top Metrics for your application, including total speed-up, number of offloaded code regions. |
| 3 | Review the Program Metrics for the modelled performance of the whole application, including timing of original and accelerated code, time spent on a target device. |
| 4 | Review the distribution of the main factors that bound your application from achieving better performance. |
| 5 | Review the top offloadable regions in your application that can benefit the most from running on a selected target platform. |
| 6 | Review the top non-offloadable regions that cannot benefit from running on the selected target platform. |
| 7 | Go to the Accelerate Regions report to explore detailed metrics for performance modelled for your application. |
For details about the Offload Modeling perspective in the new Intel Advisor GUI, see the Offload Modeling Perspective section in the Intel Advisor User Guide.
Run the GPU Roofline Perspective
The new Intel Advisor GUI introduces a feature to run GPU Roofline and explore several GPU Roofline metrics from the GUI using the GPU Roofline perspective. GPU Roofline measures performance of kernels running on a GPU.
IMPORTANT: To run this perspective, at least one kernel in your application should run on the GPU.
To configure the GPU Roofline perspective, use the following panes:
| 1 | Choose the GPU Roofline perspective from Perspective Selector. |
| 2 | Select analyses and analysis properties for the GPU Roofline perspective. NOTE: Make sure the option Trace OpenCL and Intel Media SDK programs is selected in both Survey and Characterization analyses. This is required to run the perspective. You can also select an accuracy level with a pre-defined set of analyses and properties. |
After you configure the perspective, click the ![]() button to run the perspective.
button to run the perspective.
When the execution completes, you will see the GPU Roofline report with a Summary pane opened:
| 1 | Navigate between different tabs of the GPU Roofline report. By default, it opens the Summary tab. You can navigate to GPU Roofline Regions or click See Main GPU Roofline View button (6) to explore detailed metrics about your application performance. |
| 2 | Review the Program Metrics for the performance of the application part running on GPU. |
| 3 | Review the Program Metrics for the performance of the application part running on CPU. |
| 4 | Review the GPU Roofline chart for kernels running on GPU. |
| 5 | Review the CPU Roofline chart for kernels running on CPU. |
| 6 | Review the top hotspots on CPU and GPU sorted by elapsed time. |
| 7 | Go to the GPU Roofline Regions report to explore detailed metrics about your application performance. |
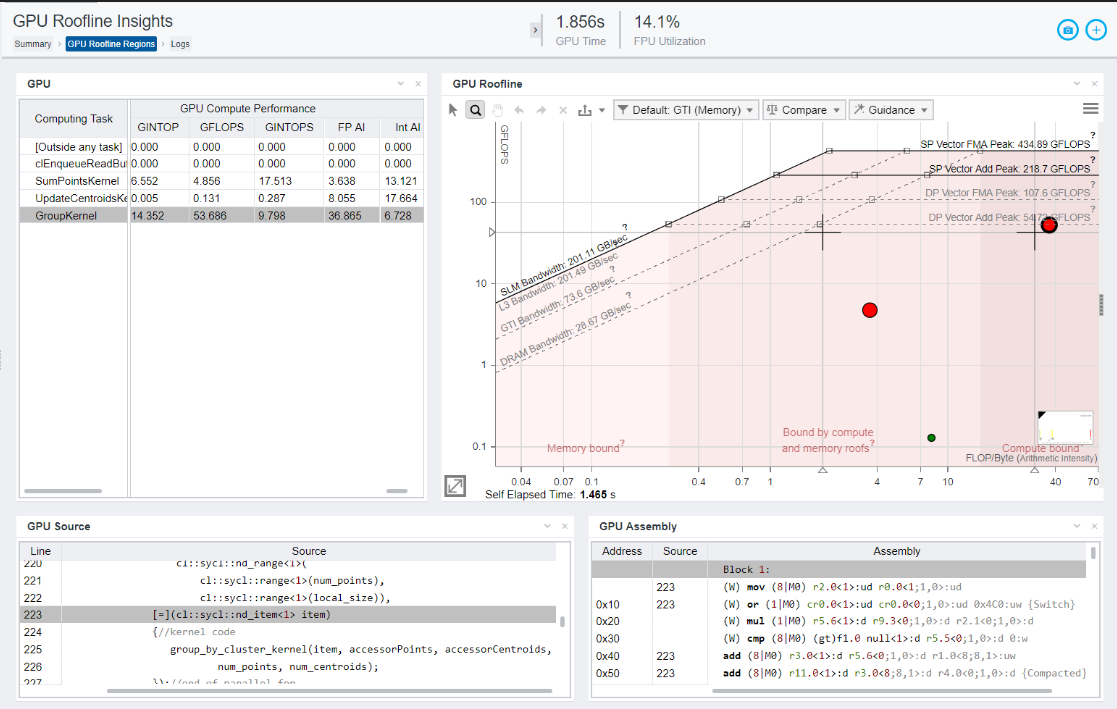
In the GPU Roofline Regions tab, see the detailed GPU Roofline chart and GPU metrics for kernels running on GPU:

In this view, you can select a kernel on the Roofline chart to see the corresponding source and assembly code.
For details about the GPU Roofline perspective in the new Intel Advisor GUI, see the GPU Roofline Perspective section in the Intel Advisor User Guide.
Run the GPU Roofline Perspective from CLI
Alternatively, you can also get a report with the same GPU kernels information in a text or an HTML format from the command line. For the text report, you can use the brand-new Intel Advisor Python* API-based script to dump all GPU kernels metrics (GPU FLOP and bytes, occupancy, instruction mixes, and so on); you can easily customize this script and generate a custom report.
For example, you can run the following command line to generate a report:
advisor-python <install-dir>/pythonapi/examples/survey_gpu.py <work-dir>/<project-name>
In the <work-dir>/<project-name> directory, you should see a TXT file with the output from survey_gpu.py. For example:
============================================================
Main GPU Dataset
============================================================
carm_traffic_gb______________________________: 0.00127996
computing_task______________________________:ZTSZZN11GSimulation5startEvENKUlRN2cl4sycl7handlerEE178_14clES3_EUlvE180_23
computing_task_average_time__________________: 0.0023449
computing_task_id____________________________: 0
computing_task_instance_count________________  : 10
computing_task_purpose_______________________: Compute
computing_task_simd_width____________________ : 32
You can also use a more traditional way to generate a GPU or a CPU Roofline chart as a self-contained interactive HTML using a command line:
advisor --report=roofline --project_dir=<work-dir>/<project-name> --report-out=<work-dir>/report.html
Or export GPU Roofline as HTML directly from the renovated GUI as shown in the screenshot below:

Conclusion
Intel® oneAPI provides a standard, simplified programming model that can run seamlessly on the scalar, vector, matrix, and spatial architectures deployed in CPUs and accelerators. Intel® Advisor 2021, which is part of Intel® oneAPI Base Toolkit, introduces a modern and new user interface. It integrates two latest features – Offload Modelling and GPU Roofline - to its workflow for a unified experience. The new perspective concept provides an intuitive way to explore the right analysis based on the workload.