Say hello to some of the latest improvements for the Intel® Graphics Performance Analyzers (Intel® GPA) tool suite and Intel® GPA Framework.
Graphics Monitor
Enhanced navigation and product onboarding
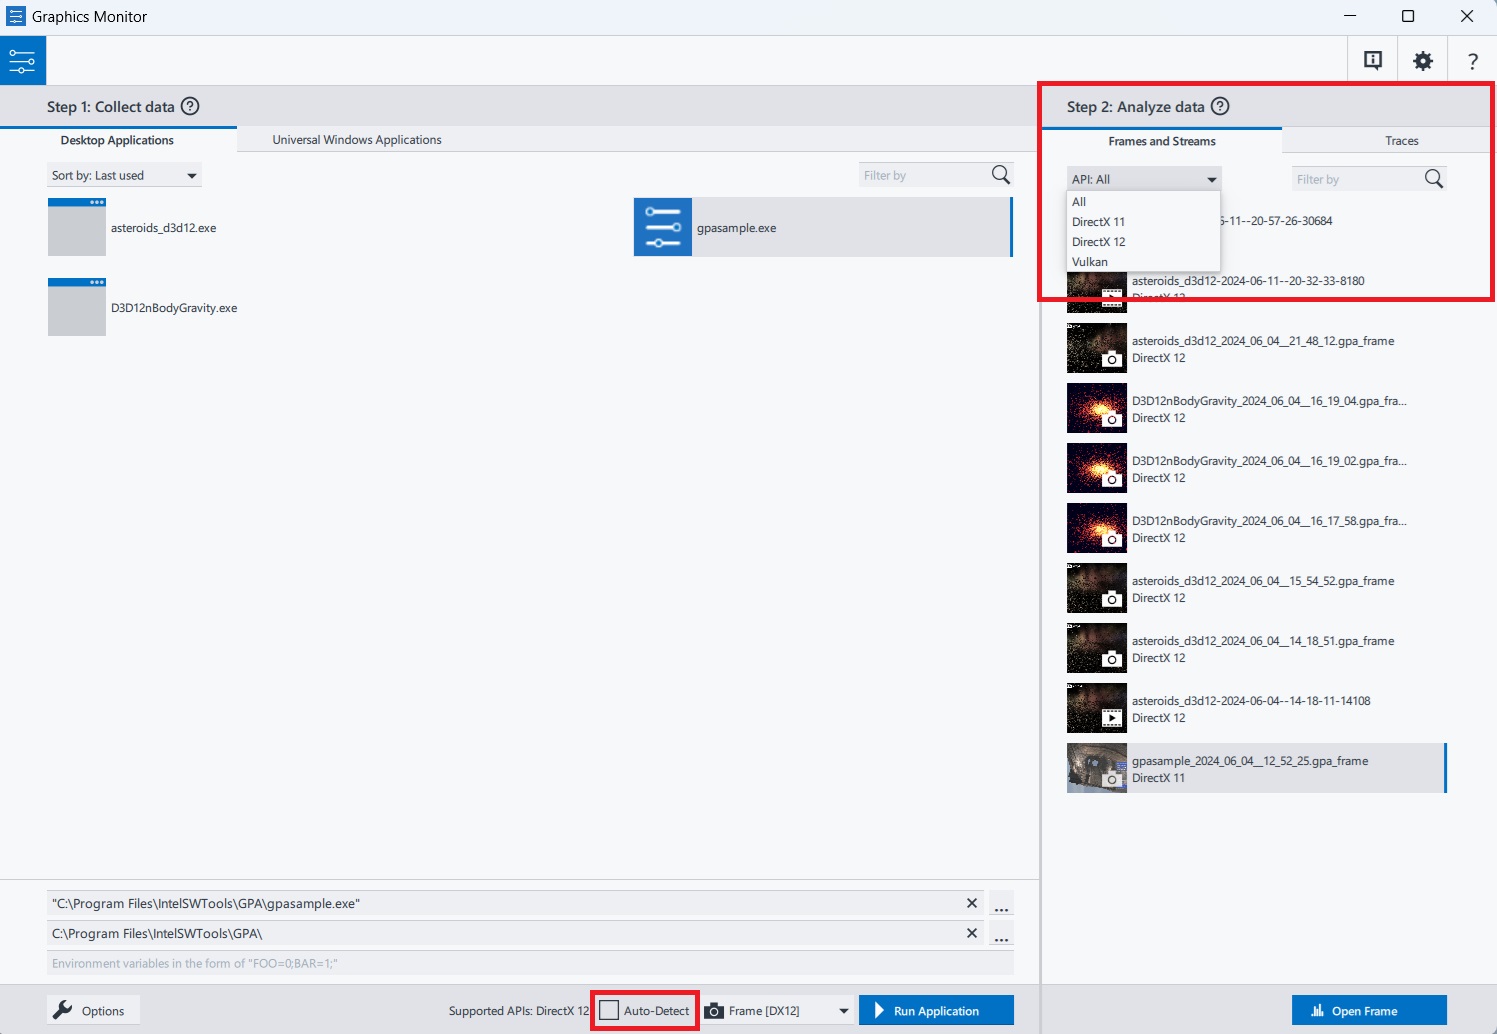
Added Collect data and Analyze data panels titles with quick-access links to the user guide to improve product onboarding. Captured items can now be found in two separate tabs: One for Frames and Streams and another for Traces. They can also be filtered by graphics API and filename. The full application name, along with the date and time of capture, are shown near the preview image. These enhancements will help to identify and manage captures easily. Auto-detect Launch Application option is now available as a checkbox near the application startup mode selection.
Graphics Frame Analyzer
Enhanced shader analysis
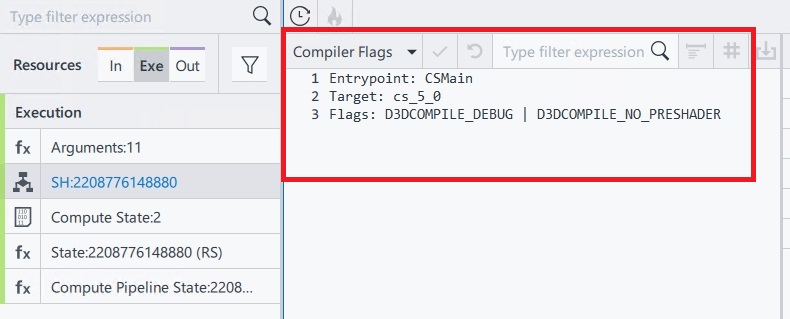
Added Compiler Flags used for shaders in profiled DirectX* 11 and DirectX 12 applications.
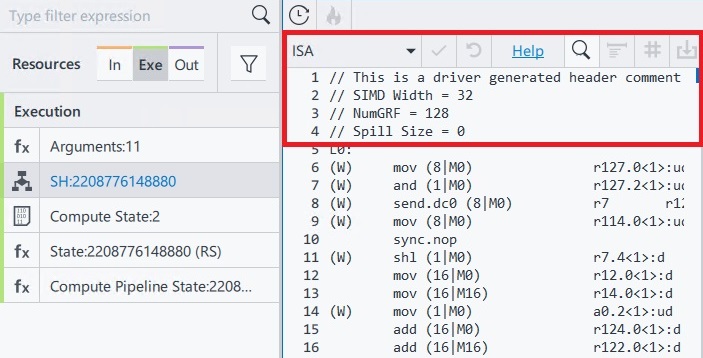
Added the display of ISA assembly headers, including information about SIMD width, number of used GRF registers and Spill Size, for DirectX 12 applications. That information can help understand shader execution and registers usage.
Improved handling of pipeline states
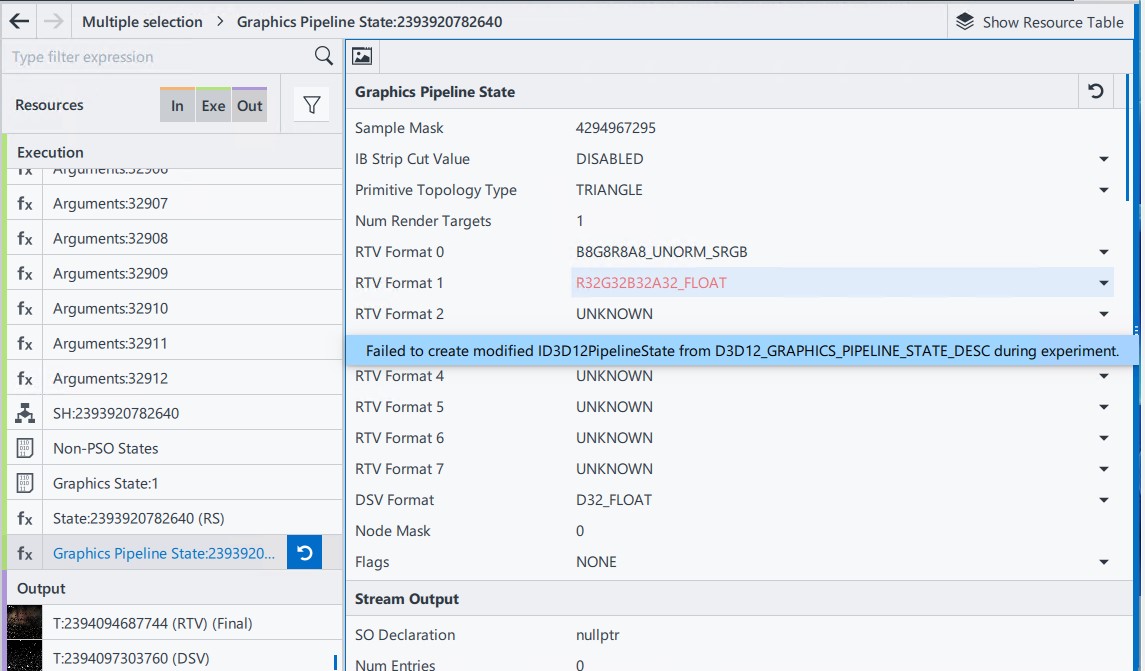
Added highlighting and corresponding error messages for cases where modifications cannot be applied to Pipeline States for DirectX 12 applications.
Accessibility Settings
New Accessibility Settings have been added to the Graphics Frame Analyzer's Frame View. These settings determine the colors used in the bar chart. Three color schemes are available, along with an option to enable patterns. We hope these changes will make the tool more accessible to users with color vision deficiencies.

Intel® GPA Framework
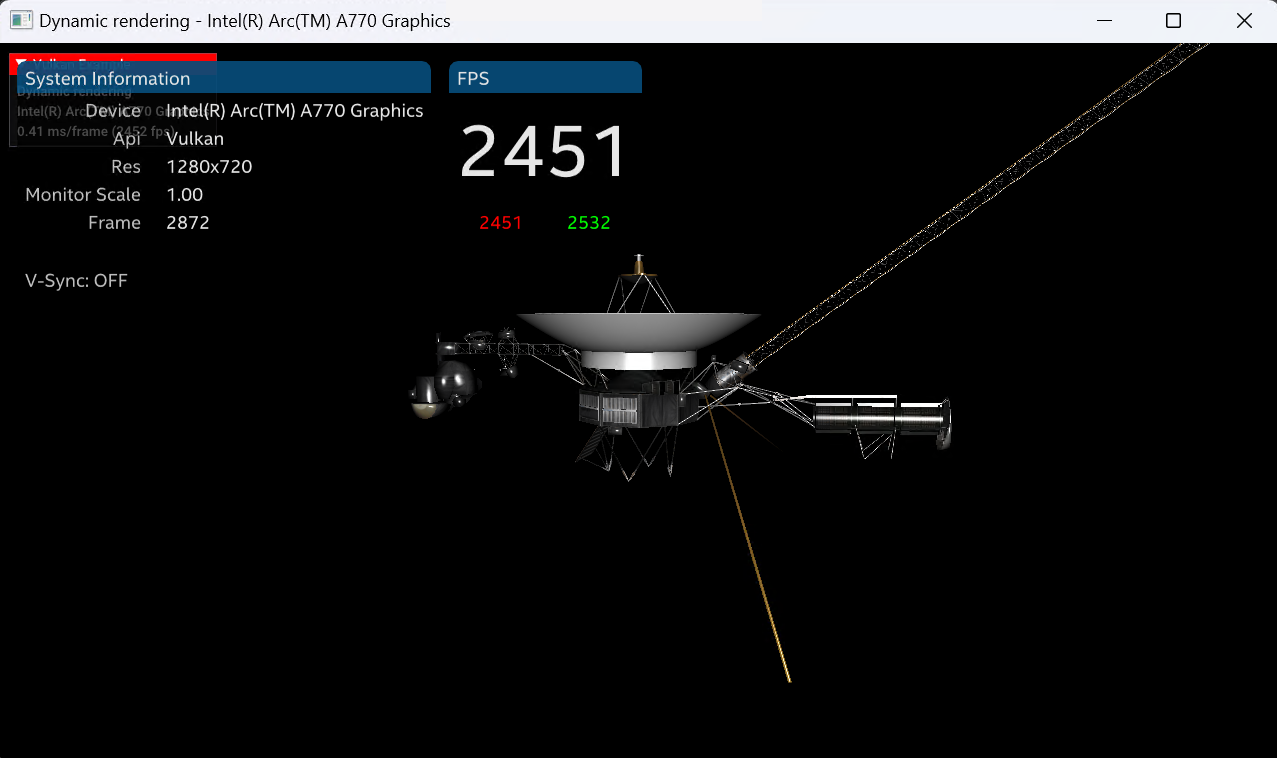
Added preliminary support for the dynamic rendering extension in Vulkan* applications. This extension enables rendering without setting up render pass objects.
