Say hello to some of the latest features for the Intel® Graphics Performance Analyzers (Intel® GPA) tool suite.
Graphics Frame Analyzer
Render Target Dependency Viewer
The new Render Target Dependency Viewer tool for Direct3D* 11 applications in Graphics Frame Analyzer allows you to see the flow of calls organized by render pass, as well as explore dependencies between resources within a frame.
The graph shows how render passes are structured in a frame. In the main window, each pass shows which draw calls are included in that pass and the resource or view type, for example Depth Stencil View, Unordered Access View or Render Target View. There are input and output flow arrows for each pass. Incoming arrows show which passes generate input, and exiting arrows show to which passes the output goes. Also, clicking on a pass will populate related data in the panel on the right.
You can see where render targets are used as well as texture history. For example, clicking on a texture causes all the passes where that texture is used to be indicated with a blue circle.
You would use this graph to get a full view of the flow of resources in the frame. It can help you understand where there might be inefficiencies, for example, you may see passes that can be combined because they process the same texture and have no intermediate dependencies, or you may see branches which should be removed because they lead to terminal nodes without any output to the final render target.
Graphics Trace Analyzer
Render and Present Call Sync

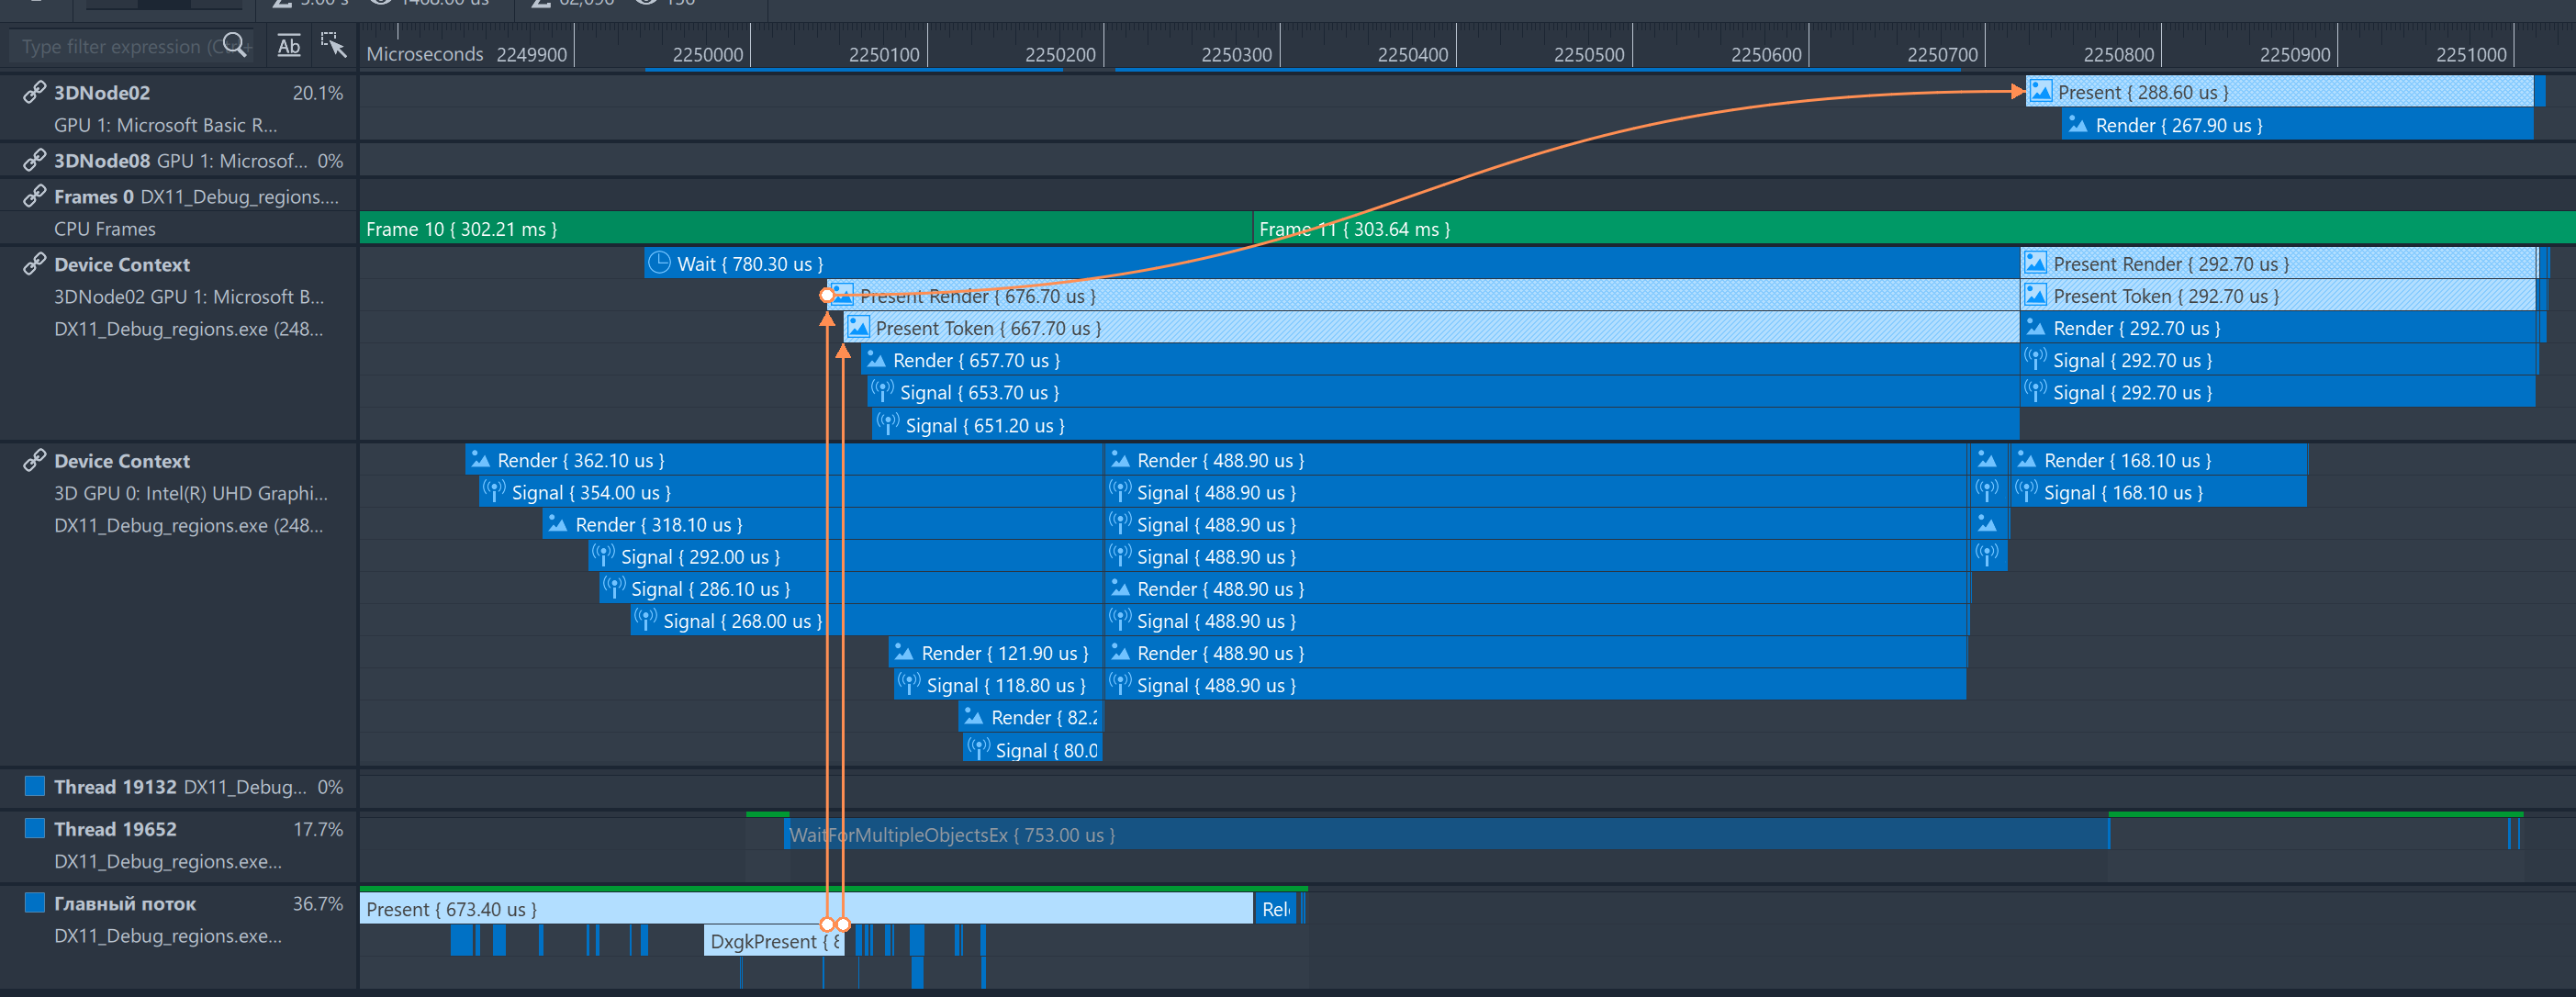
In our last two releases we added functionality in Graphics Trace Analyzer allowing you to visualize the dependencies between Wait and Signal calls. Now, in addition to Wait and Signal visualizations, we have added Render and Present visualizations in the form of highlighting and arrows showing relationships between queue packages, driver events and corresponding graphics API calls from CPU threads.
You can easily see which CPU thread invoked a render packet in the device context queue as well as what that invocation command was, for example, an ExecuteCommandLists call or a Present call. The reverse works as well, when you select a call in a CPU thread, the corresponding package is automatically selected in the Driver and GPU queues.
Graphics Trace Analyzer
Activity Indicators

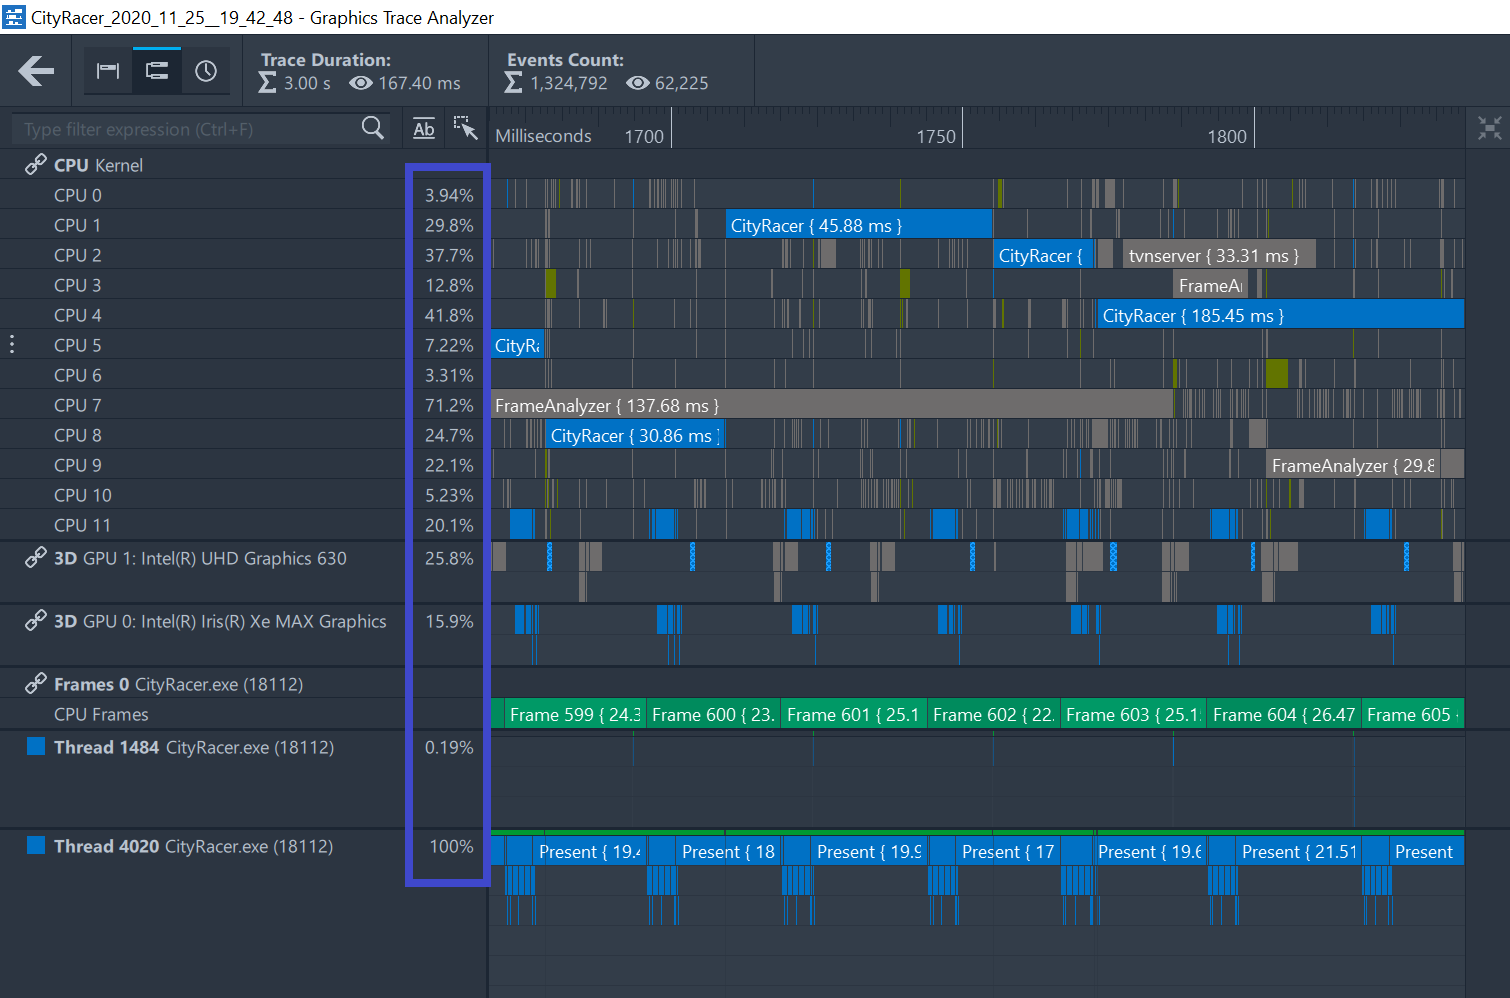
We have added indicators which show utilization of CPU, GPU and thread activity. This new feature shows track activity for the currently visible segment of the trace by either duration or by percent.
For the CPU cores, the GPU queues and the CPU threads, you can see the utilization factors for the current scope you are viewing, meaning, for each of these tracks, in the current scope, how much work is being done on that track. You can toggle between percentage and time by clicking on the clock icon in the top left corner of Graphics Trace Analyzer. If you zoom, either in or out, to see a different segment of the trace, those numbers will change to match the segment of the trace you are viewing.
Intel® GPA Framework
Highlighted Features:
- Multi-frame analysis has been improved for Direct3D 11 (Beta Version).
- Added Direct3D 12 Pipeline Statistics and Time Stamp QueryManager support for copy queues.
- Added support for Direct3D11on12. The underlying Direct3D 12 calls are now collected for Direct3D11on12 commands and stored in a stream.
- Improved support for Direct3D 12 workloads.