Say hello to some of the latest features for the Intel® Graphics Performance Analyzers (Intel® GPA) tool suite.
Graphics Trace Analyzer
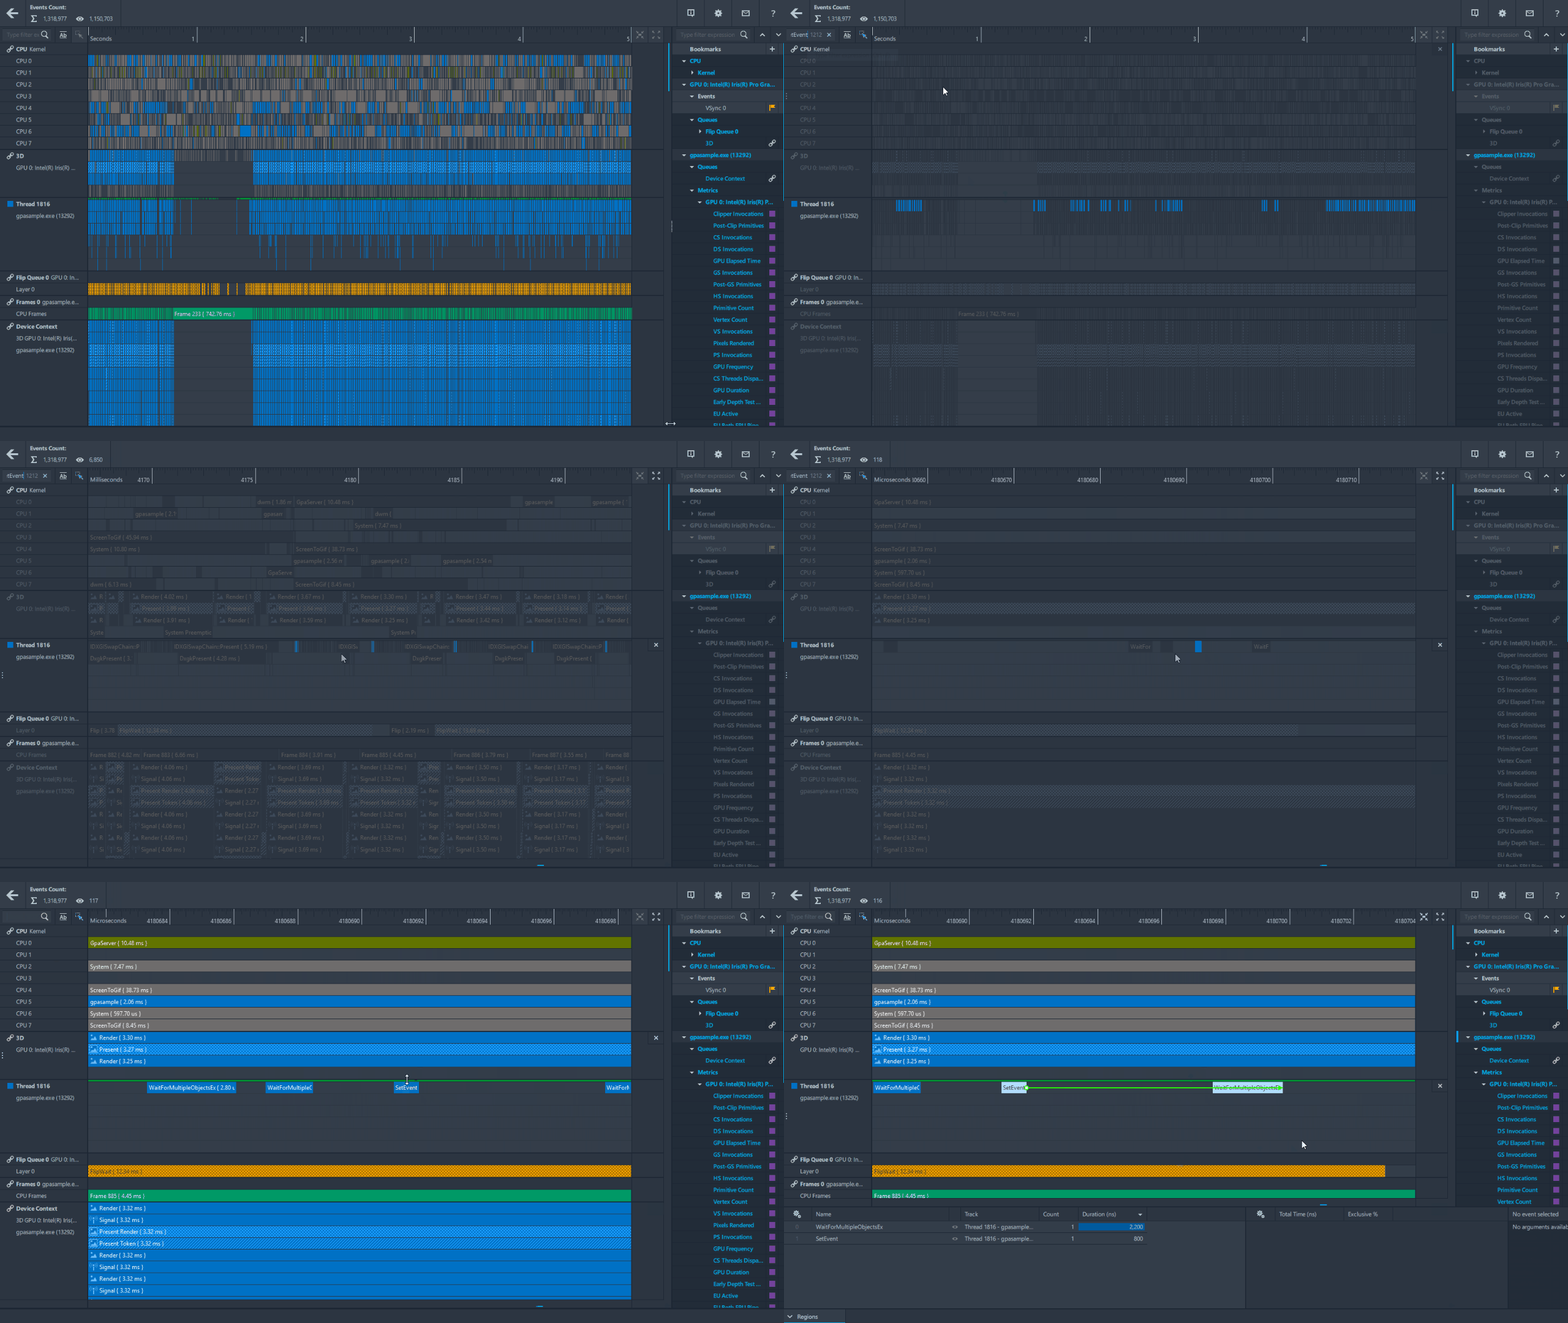
CPU Thread Synchronizations

View CPU thread synchronizations with Bezier curve arrows between dependent packets by selecting a call and viewing its cooresponding synchronization call in the timeline of Intel® Graphics Trace Analyzer. This release allows you to easily identify and resolve synchronization issues for CPU threads by selected a SetEvent or WaitForSingle(Multiple)Object(s) packet from the timeline of the tool and the cooresponding packet will be highlighted in the same CPU thread track with Bezier curves between the dependent packets.
Graphics Frame Analyzer
Enhanced Microsoft DirectX* 12 Multi-Frame Stream Profiling

The multi-frame profiling viewing mode in Graphics Frame Analyzer has significantly been improved for Microsoft DirectX 12 applications. While expanding a frame in the right panel of the multi-frame viewing mode of Graphics Frame Analyzer you can now view Present, Wait and Singal calls in addition to the prexisting ExecuteCommandLists calls. Selecting one of these calls in the right panel of the tool will also select it in the middle panel of the tool. The multi-frame viewing mode of Graphics Frame Analyzer also now displays both CPU and/or GPU timestamps that can be viewed directly above the GPU Time Elapsed track.
Intel® GPA Framework
Highlighted Features:
- Improved support for analyzing Microsoft DirectX* 12 workloads (gold version)
- Improved support for analyzing Microsoft DirectX* 11 workloads (technical preview)
- Add the ability to capture query-based metrics on platforms with multiple Intel GPUs