Introduction
Redis* (Remote Dictionary Server) is an open source (under BSD licenses) memory-based data structure storage, and can serve as a database, cache, and more. Redis supports a variety of data structures, such as strings, hash tables, lists, sets, sorted sets with range queries, bitmaps, HLLs, and geospatial indexes and streams. Redis provides functions such as built-in replications, Lua scripts, LRU evictions, transactions, and disk persistence at different levels. Redis features a high performance and a low latency, and is widely used in gaming, videos, news, location, finance, and other fields. For more information on Redis, please visit: https://redis.io/.
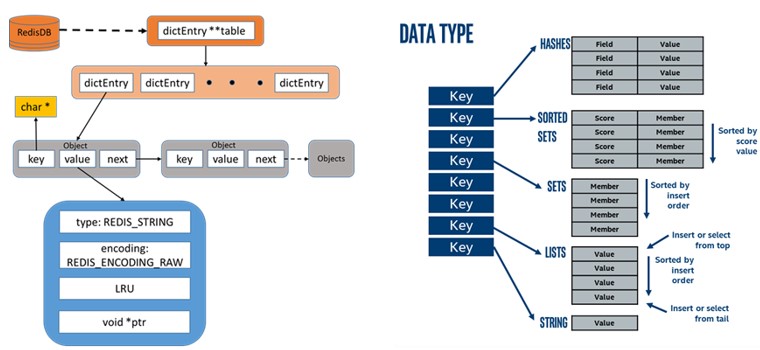
Figure1 Redis Storage Data Diagram
Intel® Optane™ persistent memory (PMem) is an innovative memory technology and is a new category between memory and storage. Intel® persistent memory is similar to DRAM in performance and can store data persistently like an SSD. Intel persistent memory has three single capacities of 128 GB, 256 GB and 512 GB, and up to 4TB Intel persistent memory capacity can be supported per processor per server, which is much larger than that of DDR, and at a lower price.
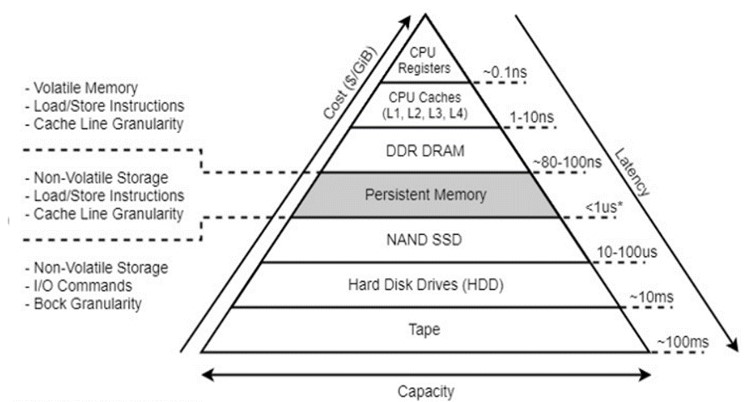
Figure2 Storage Hierarchy
Intel persistent memory supports the following two modes:
1) Memory Mode: the operating system views Intel persistent memory as the system's primary memory, DRAM as the cache for Intel persistent memory. It does not require making any changes to your applications before they run in this large volatile memory pool.
2) App-Direct Mode: Available for both DRAM and Intel persistent memory. In this case, Intel persistent memory is a low latency, byte addressable memory pool, requiring your applications to manage hierarchical data storage, and thus making changes to your applications.
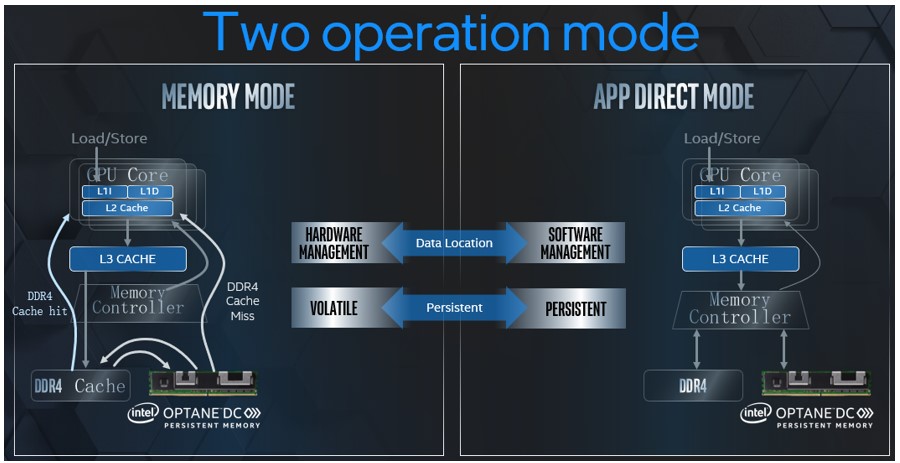
Figure3 Memory Mode and App-Direct Mode
In Memory Mode, your applications can run without any changes required. As it is easy to use, Redis which uses Memory Mode has been widely used.
This document provides suggestions for configuring various performance optimizations when Redis uses Memory Mode.
This document is applicable to 2-socket 3rd Generation Intel® Xeon® Scalable Processor systems & Intel® Optane™ persistent memory 200 series.
Intel Persistent Memory Configuration
Intel PMem DIMM Slot Configuration
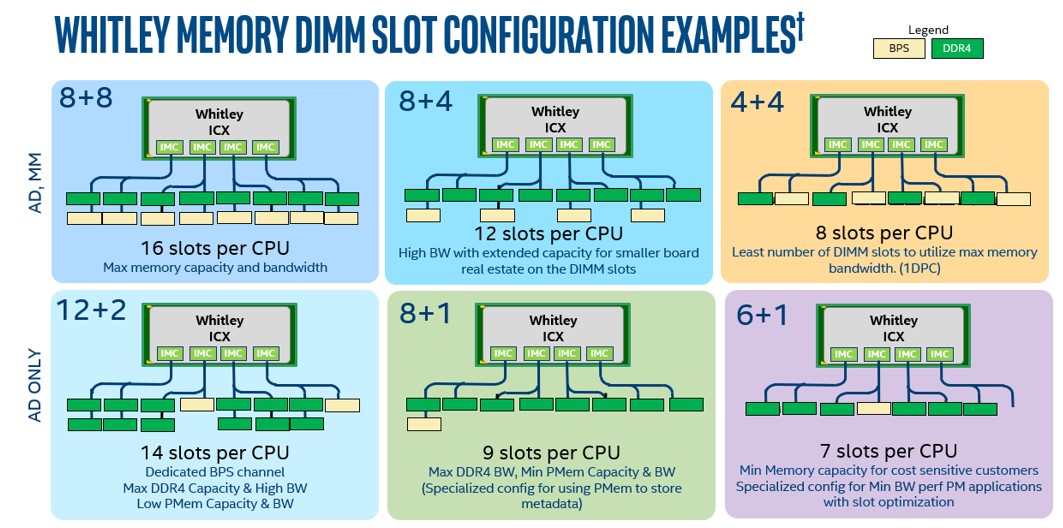
Figure 4 Intel PMem DIMM Slot Configuration
- 3rd Gen Intel Xeon Scalable platforms (codename Ice Lake/Whitley) have 16 DDR4 Slots per CPU
- Intel Optane persistent memory 200 series can be configured up to 16 per CPU
- General ratio (DRAM : PMem) is between 1:4 to 1:16, with minimum 1:2
Memory mode Settings
- Please install ipmctl according to your OS version.
- Check dimm information
$ ipmctl show -dimm
3. Configure Memory Mode
$ ipmctl create -f -goal MemoryMode=100
4. Reboot server
$ shutdown -r now
5. Check current memory size
$ numactl -H
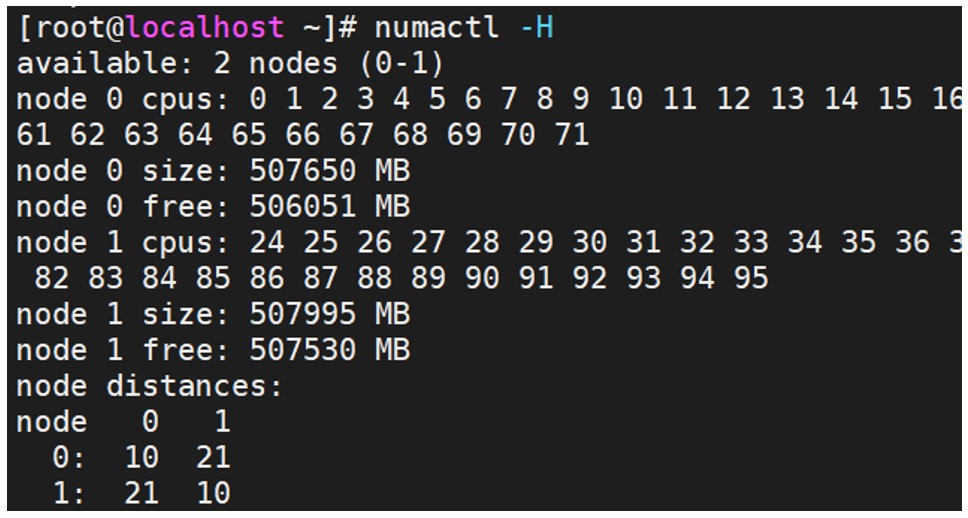
Figure 5 Check current memory size
BIOS Settings
The configuration items and recommended values that can be optimized for BIOS are as follows:
| Configuration item | Recommended value |
| Hyper-Threading | Disable |
| Hardware Prefetcher | Enable |
| L2 RFO Prefetch Disable | Disable |
| Adjacent Cache Prefetch | Enable |
| DCU Streamer Prefetcher | Enable |
| DCU IP Prefetcher | Enable |
| LLC Prefetch | Enable |
| Total Memory Encryption(TME) |
Disable |
| SNC (Sub NUMA) |
Disable |
| UMA-Based Clustering | Hemisphere(2-clusters) |
| 200 Series PMem Memory Bandwidth Boost (MBB) |
18000 |
| 200 Series PMem Turbo/Memory Bandwidth Boost Feature (MBB) Power Limit(in MW) |
18000 |
| PMem QoS | Disable the PMem QoS Feature |
| PMem Performance Setting | BW Optimized |
| PMem FastGo Configuration | Auto |
| Snoop mode for AD | Disable |
| Snoopy mode for 2LM | Disable |
| Boot performance mode | Max Performance |
| Turbo Mode | Enable |
| Hardware P-State | Native Mode |
| Local/Remote Threshold | Auto |
Linux Optimizations
Network Configuration
In the Redis application scenario, performance is usually restricted more by the bandwidth of the network than the performance of memory and Intel persistent memory. Therefore, when you run Redis across networks, you need an NIC with a highest possible network bandwidth. It is recommended that the value is above 10GB/s.
Disk Configuration
- Configure disk readahead size
echo 4096 > /sys/block/sd<x>/queue/read_ahead_kb
CPU Configuration
- Configure performance mode for the CPU
cpupower -c <cpulist> frequency-set --governor performance
- Configure the power-performance gap
x86_energy_perf_policy performance
- Configure the minimum P-State value for the processor
echo 100 > /sys/device/system/cpu/intel_pstate/min_perf_pct
Kernel Configuration
- Configure kernel parameters for the CPU
sysctl -w kernel.sched_domain.cpu<x>.domain0.max_newidle_lb_cost=0

sysctl -w kernel.sched_domain.cpu<x>.domain1.max_newidle_lb_cost=0
- Configure scheduling granularity
sysctl -w kernel.sched_min_granularity_ns=10000000

sysctl -w kernel.sched_wakeup_granularity_ns=15000000
- Configure virtual memory parameters
sysctl -w vm.dirty_ratio = 40

sysctl -w vm.swappiness = 10

sysctl -w vm.dirty_background_ratio=10
Redis Settings
Redis on Memory Mode Setting
In Memory Mode, your application runs without any changes required, so simply download and compile the open source Redis, and run it.
1) Download source code
Github address: https://github.com/redis/redis
2) Compile command (for more details, see https://github.com/redis/redis README.md)
$ make
In addition, for each running Redis instance, in order to reduce access across the Numa node which affects performance, different Redis instances can be bound to different sockets and cores using numactl and taskset.
numactl -C <cpu>./redis-server ./redis.conf > ./redis.log
Related Tools
ipmctl
ipmctl is a platform utility program used to configure and manage Intel Optane PMem, and it supports the following functions:
- Discovery
- Configuration
- Firmware management
- Security management
- Health monitoring
- Performance tracking
- Debugging and troubleshooting
1. For specific usages, refer to:
https://software.intel.com/en-us/articles/quick-start-guide-configure-intel-optane-dc-persistent-memory-on-linux
2. ipmctl requires libsafec as a dependent component. The following are repo files for libsafec and ipmctl
https://copr.fedorainfracloud.org/coprs/jhli/ipmctl/repo/epel-7/jhli-ipmctl-epel-7.repo
https://copr.fedorainfracloud.org/coprs/jhli/safeclib/repo/epel-7/jhli-safeclib-epel-7.repo
3. Installation method:
- Package manager installation:
$ yum install ipmctl
- Source code installation:
Source code download: https://github.com/intel/ipmctl
numactl
The numactl tool can be used to check the configuration and status of the NUMA node of the current server. It binds a process to the specified CPU core which runs the corresponding process.
1. Installation method:
$ yum -y install numactl numastat
2. Command usage examples:
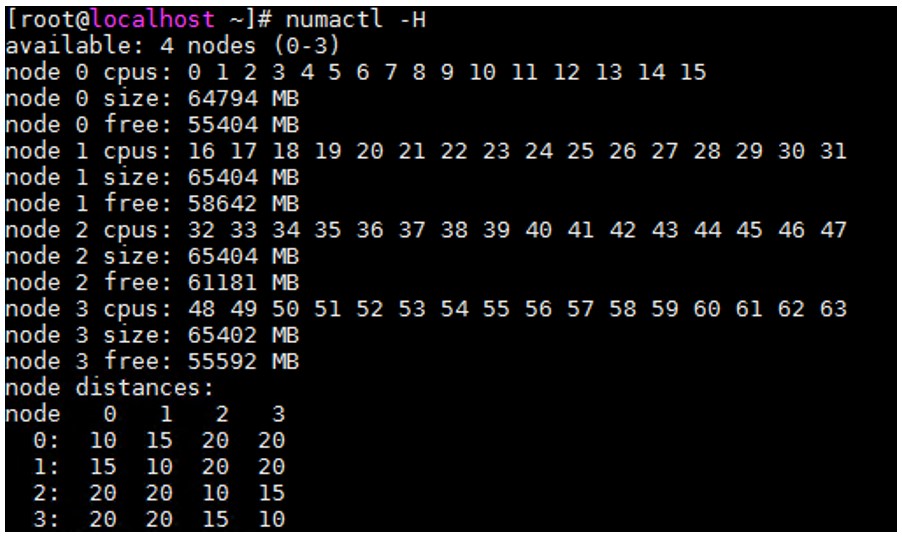
1) Check NUMA configurations of the current server using numactl
The numactl performance results show that the example server is divided into four NUMA nodes. Each node contains 16 CPU cores, and the memory size for each node is about 64 GB. At the same time, this command also provides the distance between different nodes. The farther the distance, the greater latency the memory access across-NUMA nodes. When an application program is running, you should have less memory access across-NUMA nodes.
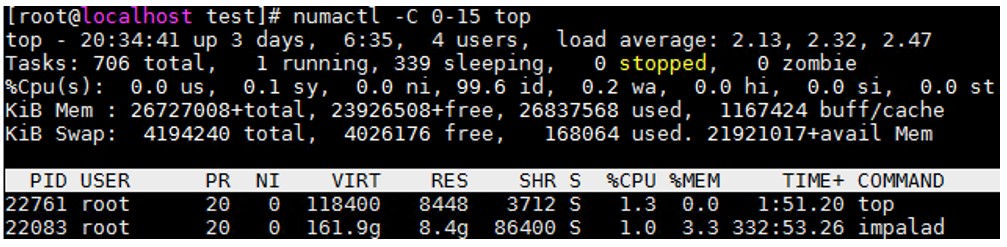
2) Bind a process to the specified CPU core using numactl
Using the "numactl -C 0-15 top" command, you can bind the process "top" to the "0-15 CPU core" that will run the process.
3) Check the memory access hit rate for the current NUMA node using numastat
The numastat command observes the states of various NUMA nodes.
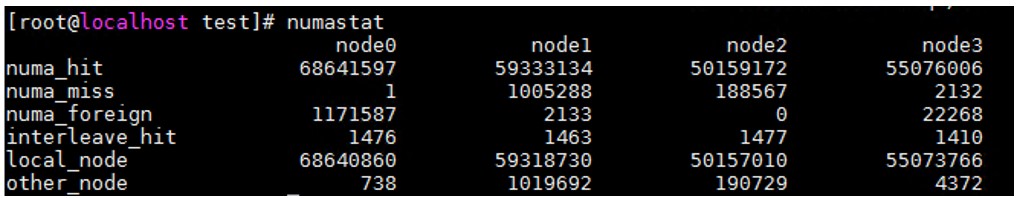
- numa_hit indicates the number of times the CPU core on the node accesses local memory.
- numa_miss indicates the number of times the CPU core on the node accesses the memory for other nodes. Cross-node memory access has a high latency, thereby degrading performance. As a result, the lower the numa_miss value the better. And if it is too high, core binding should be considered.
Performance monitoring tool - PCM
PCM (Processor Counter Monitor) can be used to monitor the performance indicators of the Intel CPU core. PCM is often used to monitor the bandwidth of Intel persistent memory. Download here: https://github.com/opcm/pcm
$ pcm-memory.x -pmm
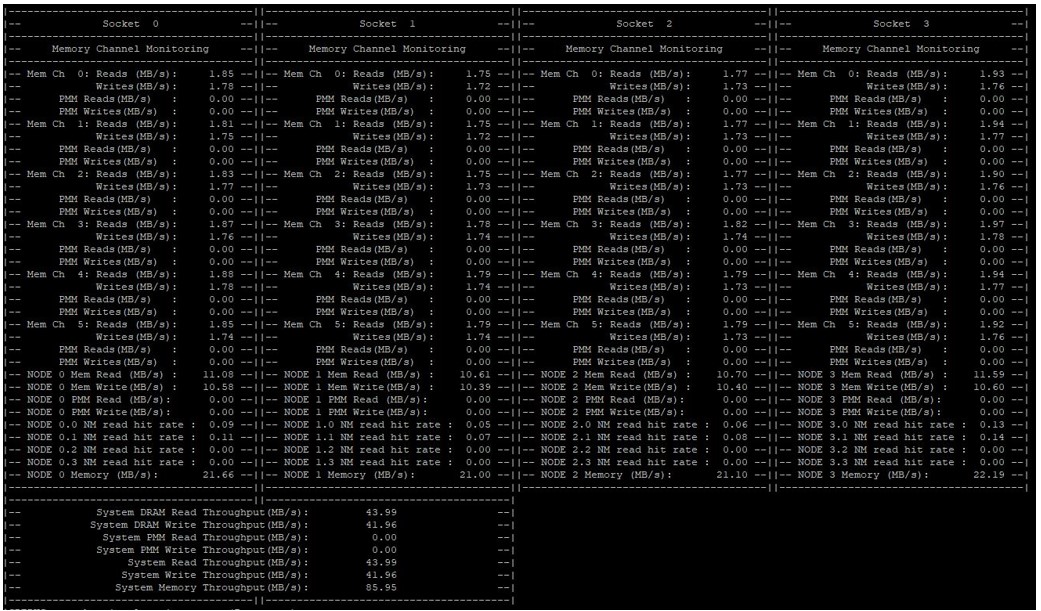
Figure 6 PCM monitoring Persistent Memory bandwidth
Notices & Disclaimers
Intel technologies may require enabled hardware, software or service activation.
No product or component can be absolutely secure.
Your costs and results may vary.
Code names are used by Intel to identify products, technologies, or services that are in development and not publicly available. These are not "commercial" names and not intended to function as trademarks
The products described may contain design defects or errors known as errata which may cause the product to deviate from published specifications. Current characterized errata are available on request.