Introduction
This guide is targeted towards users who are already familiar with Java* based server applications and provides pointers and system setting for hardware and software that will provide the best performance for most situations. This guide by nature is a general look at tuning Java-based applications and is based on recommendations for running the industry standard SPECjbb* 2015 benchmark on 3rd Gen Intel® Xeon® Scalable processors. This may be useful for other similar Java-based server application. However, please note that we rely on the users to carefully consider these settings for their specific scenarios, since Java-based server applications can be deployed in multiple ways and this is a reference to one such use-case.
For more specific recommendations for Java-based server applications, refer to the soon to be released: Spark Tuning Guide for 3rd Generation Intel® Xeon® Scalable Processors Based Platforms.
SPECjbb* 2015 has been developed from the ground up to measure performance of a canonical Java-based server handling several transaction types, data analytics, etc.
Some characteristics of SPECjbb 2015 are that it scales well to use a large number of cores, can work with large or small Java heaps, uses a moderate amount of local networking IO, and little disk IO. SPECjbb 2015 reports a throughput and latency score and can be run in multiple modes. In this document we describe the factors around tuning for Max-jOPS (throughput) in Multi-JVM mode. SPECjbb 2015 is described further down in this document.
3rd Gen Intel Xeon Scalable processors deliver industry-leading, workload-optimized platforms with built-in AI acceleration, crypto acceleration and advanced security capabilities. It provides a seamless performance foundation to help speed data’s transformative impact, from the multi-cloud to the intelligent edge and back. Improvements of particular interest to this workload applications are:
- Enhanced Performance
- More Intel® Ultra Path Interconnect
- Increased DDR4 Memory Speed & Capacity
- Intel® Advanced Vector Extensions
- Intel® Security Essentials and Intel® Security Libraries for Data Center
- Intel® Speed Select Technology
- Support for Intel® Optane™ Persistent Memory 200 series
Tested hardware and software environment for this tuning guide:
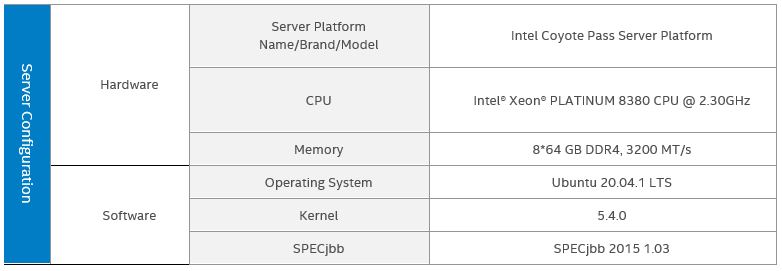
Note The configuration described in this article is based on 3rd Generation Intel Xeon processor hardware. Server platform, memory, hard drives, network interface cards can be determined according to customer usage requirements.
Hardware Tuning
BIOS Setting
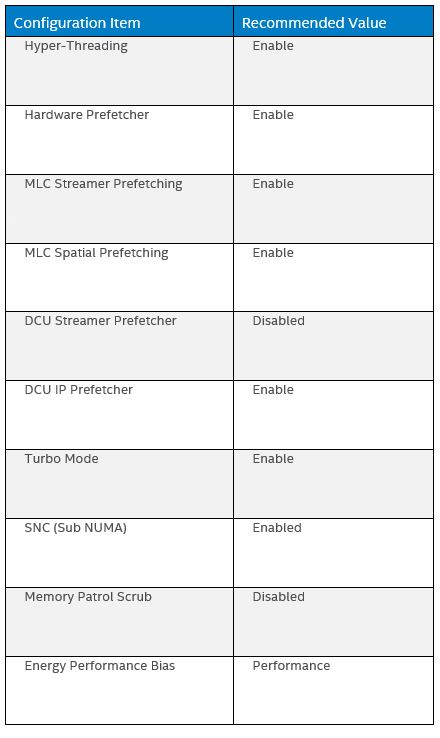
Begin by resetting your BIOS to default setting, then follow the suggestion below for changes:
Description of Settings
Hyper-Threading
Hyper-threading is a feature that is good at masking memory latency for hard to predict workloads, and Java applications often match that profile. If the workload scales with more cores, hyperthreading should stay enabled.
Hardware Prefetching
Intel Xeon processors have several hardware mechanisms to improve memory access latency by prefetching memory predicted to be accessed in the future. These generally work well unless the prefetched data begins to supplant other cached data that is actually used. With a memory intensive application like SPECjbb 2015 it is best to disable the DCU (L1 data cache) Streamer Prefetcher.
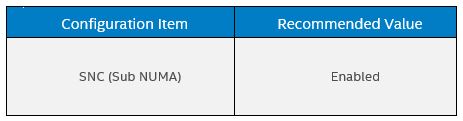
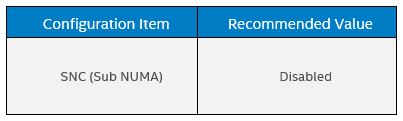
SNC breaks up the last level cache (LLC) into disjoint clusters based on address range, with each cluster bound to a subset of the memory controllers in the system. Each sub-NUMA cluster is exposed by the OS as a “NUMA node”.
SNC improves latency of memory accesses within the cluster at the cost of slightly slower memory accesses across clusters. SNC can be used to improve overall performance when the system workload can be partitioned to run within clusters. See further down in this guide for more details on partitioning Java workloads.
For more information, refer to the BIOS Setup Utility User Guide for the Intel® Server Board D50TNP and M50CYP Family.
Memory Configuration/Settings
For highest performance, memory should be populated in a balanced 1 DIMM per channel configuration. For running SPECjbb 2015 in the suggested configuration, at least 64GB of memory per NUMA node is recommended. If the application requires more memory than can be provided with 1 DIMM per channel, then 2 DIMMs per channel can be used. In either 1 or 2 DIMM per channel configuration it is best to fill each channel with the same size and speed DIMMs.
Storage/Disk Configuration/Settings
<No specific workload setting for this topic>
Network Configuration/Setting
SPECjbb 2015 typically uses localhost networking in the Multi-JVM mode. The following Linux configuration settings can improve performance.
sysctl net.core.wmem_max=12582912
sysctl net.core.rmem_max=12582912
sysctl net.ipv4.tcp_rmem='10240 87380 12582912'
sysctl net.ipv4.tcp_wmem='10240 87380 12582912'
sysctl net.core.netdev_max_backlog=655560
sysctl net.core.somaxconn=32768
sysctl net.ipv4.tcp_no_metrics_save=1
Software Tuning
Software configuration tuning is essential. From the Operating System to SPECjbb 2015 configuration settings, the default configurations are designed for generic usage, and need to be tuned for best performance.
Example Java-based Server Architecture: SPECjbb 2015
SPECjbb 2015 is used in this guide as an example Java-based server application. It models a world-wide supermarket infrastructure running over one or more Java Backend processes. Each Backend supports one or more Supermarkets, one or more Suppliers, and one Headquarters. There are various transactions such as customer purchases and returns, receipts, replenishment orders, data mining, etc. Transaction processing uses the Java Fork/Join framework and is heavily multi-threaded. If there is more than one Backend, then a portion of the transactions are remote between Backends using the Grizzly/NIO framework.
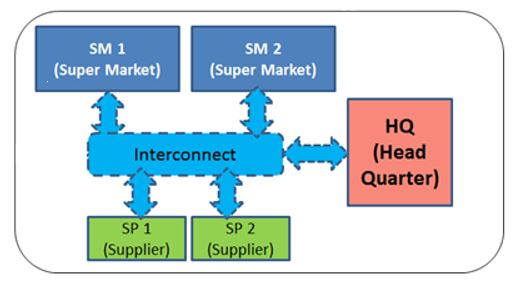
Figure. Business Logic and Data Storage 1
As a benchmark there are two other types of components in the system– there is typically one Transaction Injector per Backend to generate load, and a single Controller that controls all the Backends and Transaction Injectors and records the benchmark run.
SPECjbb 2015 can be run in three types of configurations:
- running the Backend(s), Transaction Injector(s), and Controller in a single Java process (“Composite”)
- running the components in separate Java processes on the same machine (“Multi-JVM”)
- running the components on separate machines (“Distributed”).
For this guide we describe a Multi-JVM configuration.
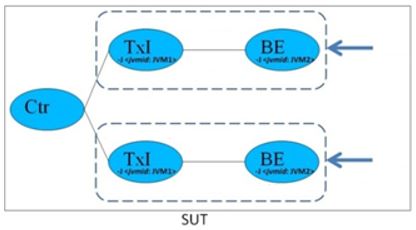
Figure. Multi-JVM configuration 2
The SPECjbb 2015 benchmark gives both a throughput score (max-jOPS) and a latency sensitive score (critical-jOPS) that takes into account throughput under several SLA bands. In this document we focus on tuning for throughput.
To learn more about SPECjbb 2015, you can visit their website.
Linux OS Optimization Settings
There are a several Linux OS settings that improve SPECjbb 2015 performance that may be beneficial for other Java-based server applications.
Reducing System Services
The Linux OS by may have many services running that may not be required for all scenarios. These services can impact throughput and memory usage and can also be a hidden source of unpredictable latency. For SPECjbb 2015 we recommend disabling the following.
systemctl stop systemd-update-utmp-runlevel.service
Thread Scheduling
SPECjbb 2015, like many Java-based server applications, runs with many threads. The following settings can improve the performance of a highly threaded system.
echo 10000 > /proc/sys/kernel/sched_cfs_bandwidth_slice_us
echo 0 > /proc/sys/kernel/sched_child_runs_first
echo 16000000 > /proc/sys/kernel/sched_latency_ns
echo 1000 > /proc/sys/kernel/sched_migration_cost_ns
echo 28000000 > /proc/sys/kernel/sched_min_granularity_ns
echo 9 > /proc/sys/kernel/sched_nr_migrate
echo 100 > /proc/sys/kernel/sched_rr_timeslice_ms
echo 1000000 > /proc/sys/kernel/sched_rt_period_us
echo 990000 > /proc/sys/kernel/sched_rt_runtime_us
echo 0 > /proc/sys/kernel/sched_schedstats
echo 1 > /proc/sys/kernel/sched_tunable_scaling
echo 50000000 > /proc/sys/kernel/sched_wakeup_granularity_ns
Virtual Memory
Tune virtual memory settings to reduce likelihood of paging while enabling reasonable file write caching for applications like SPECjbb 2015 that have a low file write requirements.
echo 3000 > /proc/sys/vm/dirty_expire_centisecs
echo 500 > /proc/sys/vm/dirty_writeback_centisecs
echo 40 > /proc/sys/vm/dirty_ratio
echo 10 > /proc/sys/vm/dirty_background_ratio
echo 10 > /proc/sys/vm/swappiness
Huge Pages
SPECjbb 2015, like many large Java-based server applications, may use gigabytes of memory just for the Java heap. Using “huge pages” can result in better performance. We recommend using static huge pages for the Java heap by allocate memory for hugepages (where ** is the number of 1GB pages available to the JVMs)
echo ** > /sys/kernel/mm/hugepages/hugepages-1048576kB/nr_hugepages
The JVM option -XX:+UseLargePages must be used by the JVM processes that will make best use of the static huge pages. Keep in mind that the JVM may use static huge pages for not just the Java heap, but also the JITted code cache and certain GC data structures.
We recommend also using Transparent Huge Pages by setting the transparent_hugepages/enabled OS property to “always” (e.g. system-wide) as below.
echo always > /sys/kernel/mm/transparent_hugepage/defrag

echo always > /sys/kernel/mm/transparent_hugepage/enabled
This will allow other memory allocations performed by the JVM to potentially benefit from using huge pages.
Alternatively, if there is difficulty in providing a system-wide static allocation of huge pages, transparent huge pages can be used alone – either system-wide as above or per-process by setting the transparent_hugepages/enabled OS property to “madvise” and using the JVM option -XX:+UseTransparentHugePages for the JVM processes that will make best use of the transparent huge pages.
NUMA Balancing
The recommended approach to running multiple Java-based server processes like SPECjbb 2015 is to manually bind processes to NUMA nodes using numactl. The automatic NUMA balancing feature should be disabled in this case. Even when not using numactl, numa_balancing can introduce latency effects that may be undesirable.
echo 0 > /proc/sys/kernel/numa_balancing
Limits
SPECjbb 2015 uses a lot of memory, file descriptors, and sockets. To get the best performance we recommend changing Linux limits to something like the following:
ulimit -n 131072

ulimit -v 800000000

ulimit -m 800000000

ulimit -l 800000000
Allocating CPUs and Memory to Java Processes
3rd Gen Intel Xeon Scalable processors are designed to give relatively balanced performance whether running a very large process that span sockets or running several processes sharing a machine. But when running several Java-based processes on a machine, as in the SPECjbb MultiJVM mode, we can improve performance by manually deploying Java processes to the machine using the numactl tool or similar.
We describe the techniques for doing this on a “bare-metal” machine. Managing systems using containers or virtual machines is beyond the scope of this document, but those scenarios will have similar issues.
The basic strategy is to avoid having processes cross machine boundaries at the socket and Sub-NUMA Cluster (SNC) levels, as well as avoid having processes share cores (directly or via Hyperthreads). This can reduce latency within the process as well as optimize memory bandwidth and cache utilization.
Hardware Configuration with Numactl
This example shows a 2-socket machine with 32 core 3rd Gen Intel Xeon Scalable processors and SNC enabled. This is exposed to the OS as a 4-node machine, where nodes 0-1 are running on socket 0 and nodes 2-3 are on socket 1. Each node shows 32 “cpus”, which correspond to 32 Hyperthreads running on 16 cores.
> numactl --hardware

available: 4 nodes (0-3)

node 0 cpus: 0 1 2 3 4 5 6 7 8 9 10 11 12 13 14 15 64 65 66 67 68 69 70 71 72 73 74 75 76 77 78 79

node 0 size: 128383 MB

node 0 free: 57497 MB

node 1 cpus: 16 17 18 19 20 21 22 23 24 25 26 27 28 29 30 31 80 81 82 83 84 85 86 87 88 89 90 91 92 93 94 95

node 1 size: 129017 MB

node 1 free: 59974 MB

node 2 cpus: 32 33 34 35 36 37 38 39 40 41 42 43 44 45 46 47 96 97 98 99 100 101 102 103 104 105 106 107 108 109 110 111

node 2 size: 128979 MB

node 2 free: 58776 MB

node 3 cpus: 48 49 50 51 52 53 54 55 56 57 58 59 60 61 62 63 112 113 114 115 116 117 118 119 120 121 122 123 124 125 126 127

node 3 size: 129014 MB

node 3 free: 59519 MB
Hyperthreads
Note that each node’s “cpus” list contains two ranges, such as 0-15 and 64-79. The first range corresponds to the first set of hyperthreads on the cores in the node, and the second range the remaining hyperthreads. So, on this hardware “cpus” 0 and 64 are hyperthreads that share the same core. If it is desirable to further partition a node between processes, it’s recommended that you avoid having processes share a core. For example, on this machine numactl with the “--physcpubind” option should specify cpus 0-7,64-71 for one process and 8-15,72-79 for the other process.
Numactl vs. JVM UseNUMA Option
The JVM has a UseNUMA option that optimizes memory locality when threads allocate Java objects. It works well on NUMA systems when the JVM process has to span multiple NUMA nodes. It is recommended to not specify the UseNUMA option on a system with only one node or with a Java process that is already allocated to a particular NUMA node.
SPECjbb 2015 Settings
The recommendation for SPECjbb 2015 is to match the number of SPECjbb “groups” to the number of NUMA nodes in the system, and use numactl to bind a BackEnd and Transaction Injector to each node:
numactl --cpunodebind=$NewNode –localalloc <command to launch BE or TxI>
Java Virtual Machine Settings
Java (JDK) Version
Intel collaborates with and contributes to the OpenJDK* open-source community to enhance Java performance on Intel processors. These enhancements get delivered as part of new JDK releases. The latest JDK releases will have newer optimizations and may enable Java support for more Intel processor features. An example of optimizations includes:

JVM Options
General Options
These are the general JVM options recommended for SPECjbb 2015 performance.
Page Size and Page Initialization Options
As described in the Huge Pages section, we recommend using the -XX:+UseLargePages option when using static huge pages, or alternatively you may want to try the -XX:+UseTransparentHugePages option. The -XX:LargePageSizeInBytes=1G option can be used to specify a requested huge page size.
For long running applications, we recommend using the -XX:+AlwaysPreTouch option to reduce latency at the expense of startup time.
-XX:+UseLargePages -XX:LargePageSizeInBytes=1G -XX:+AlwaysPreTouch
GC/Heap Size Options
GC tuning is a complex subject. There are currently four major options for GC algorithm (ParallelGC, G1GC, ZGC, and optionally ShenandoahGC), each with their costs, benefits, and tuning options. You can find a more complete description of the issues in the HotSpot Virtual Machine Garbage Collection Tuning Guide among other places.
Parallel and Concurrent GC Thread Tuning
One subtlety in GC tuning is configuring the number of Parallel GC threads (the GC threads that run while application is stopped to do GC) and Concurrent GC threads (the GC threads that run concurrently with the application).
We’ll focus on the Parallel and G1 collectors here. ZGC and Shenandoah have similar constraints. The JVMs handling of GC threads has been improving with newer versions, but the details listed here are current as of JDK 16.
The JVM option ParallelGCThreads specifies the maximum number of parallel GC threads used by ParallelGC and G1GC. The JVM option ConcGCThreads specifies the maximum number of concurrent GC threads used by G1GC. The default value for ConcGCThreads is ¼ ParallelGCThreads. We’ll focus on ParallelGCThreads for the rest of this section.
The default value of ParallelGCThreads for a Java process is approximately 63% the number of hyperthreads available to the process. If the Java process is sharing a large machine (without being constrained to a subset of the hyperthreads), this could result in way too many GC threads. This can compound if other processes on the machine are also Java processes with too many GC threads. The effect of too many GC threads is the memory overhead of the threads and the contention resulting from threads fighting over too little work to do (which can increase GC pauses).
By default, the JVM dynamically limits the actual number of parallel GC threads to account for the number of Java application threads and current Java heap size:
= MIN( MAX((current number of Java threads * 2), (current Java heap size / HeapSizePerGCThread
(32MB))),

ParallelGCThreads)
Depending on the performance and number of vCPUs this could also result in too many GC threads.
If you specify ParallelGCThreads on the command line, then the actual number of parallel GC threads used is simply the number specified (it’s not dynamically adjusted).
The simplest work-around is, as part of allocating cpus to your Java processes using numactl (or similar), to also specify the ParallelGCThreads option. If your application has a relatively large Java heap it is recommended that you set ParallelGCThreads to the same value as the number of vCPUs that are dedicated to the Java process.
For smaller Java heaps you can experiment with reducing the value of ParallelGCThreads until you detect GC pause times rising. An alternative to specifying ParallelGCThreads is to similarly experiment with increasing HeapSizePerGCThread until you detect GC pause times rising, and let the dynamic GC thread controller manage the actual thread count.
Compiler Options
For large, long running Java applications like SPECjbb 2015 we recommend adjusting some of the JIT compiler and software prefetching options for better performance.
-XX:InlineSmallCode=10k -XX:-UseCountedLoopSafepoints -XX:LoopUnrollLimit=20

-XX:AllocatePrefetchLines=3 -XX:AllocateInstancePrefetchLines=2 -XX:AllocatePrefetchStepSize=128

-XX:AllocatePrefetchDistance=384
Memory/GC Options for SPECjbb 2015 Tuned for Throughput
SPECjbb 2015 has a relatively small footprint for long-lived objects, and many short-lived objects. When focused on throughput performance, using Parallel GC, a Java heap < 32GB (which enables the “CompressedOops” optimization), a large young generation (-Xmn), and some manual size tuning results in better performance.
The number of ParallelGCThreads for each Backend should be set to the number of HW threads in the system (vCPUs) divided by the number of groups. With an Intel® Xeon® Platinum 8380 the number of threads per NUMA node is 40 (with SNC enabled).
-XX:+UseParallelGC -XX:-UseAdaptiveSizePolicy -XX:SurvivorRatio=28 -XX:TargetSurvivorRatio=95
-XX:MaxTenuringThreshold=15 -verbose:gc -Xms31744m -Xmx31744m -Xmn29696m
-XX:ParallelGCThreads=XX
Related Tools
Intel® Memory Latency Checker (Intel® MLC) is a free tool used to measure memory latencies and bandwidth, and how they change with increasing load on the system. It also provides several options for more fine-grained investigation where b/w and latencies from a specific set of cores to caches or memory can be measured as well.
An important factor in determining application performance is the time required for the application to fetch data from the processor’s cache hierarchy and from the memory subsystem. In a multi-socket system where Non-Uniform Memory Access (NUMA) is enabled, local memory latencies and cross-socket memory latencies will vary significantly. Besides latency, bandwidth (b/w) also plays a big role in determining performance. So, measuring these latencies and b/w is important to establish a baseline for the system under test, and for performance analysis. Learn more about Intel MLC from Intel’s website.
Conclusion
The performance of Java-based server applications is highly dependent on hardware configurations, software configurations and the characteristics of the workload. For hardware aspects, the processor, the memory capacity, the network bandwidth, and I/O bandwidth are most important aspects to balance for best performance. For software configurations, the placement of Java processes on the machine, tuning of JVM options including memory and GC, and the tuning the specific Java-based application, such as SPECjbb 2015 in this document, are all important considerations. With 3rd Generation Intel Xeon Scalable processor, Intel takes it even further by optimizing the platform as a whole -- CPU, memory, storage, and networking working together for the best user experience.
References
- Business Logic and Data Storage from https://www.spec.org/jbb2015/docs/designdocument.pdf on 8/06/2021
- Multi-JVM configuration from https://www.spec.org/jbb2015/docs/userguide.pdf on 8/06/2021
Appendix: SPECjbb 2015 Tuning
In this appendix we collect all the recommended tunings for SPECjbb 2015 to optimize either throughput or latency on a 2-socket Intel® Xeon® Platinum 8380 (40 core) system.
Tuned for Throughput (max-jOPS)
BIOS Settings
In the max-jOPS tuning we recommend the settings in BIOS Setting, in particular:
OS Settings
ulimit -n 131072

sysctl net.core.wmem_max=12582912

sysctl net.core.rmem_max=12582912

sysctl net.ipv4.tcp_rmem='10240 87380 12582912'

sysctl net.ipv4.tcp_wmem='10240 87380 12582912'

sysctl net.core.netdev_max_backlog=655560

sysctl net.core.somaxconn=32768

sysctl net.ipv4.tcp_no_metrics_save=1

systemctl stop systemd-update-utmp-runlevel.service

echo 10000 > /proc/sys/kernel/sched_cfs_bandwidth_slice_us

echo 0 > /proc/sys/kernel/sched_child_runs_first

echo 16000000 > /proc/sys/kernel/sched_latency_ns

echo 1000 > /proc/sys/kernel/sched_migration_cost_ns

echo 28000000 > /proc/sys/kernel/sched_min_granularity_ns

echo 9 > /proc/sys/kernel/sched_nr_migrate

echo 100 > /proc/sys/kernel/sched_rr_timeslice_ms

echo 1000000 > /proc/sys/kernel/sched_rt_period_us

echo 990000 > /proc/sys/kernel/sched_rt_runtime_us

echo 0 > /proc/sys/kernel/sched_schedstats

echo 1 > /proc/sys/kernel/sched_tunable_scaling

echo 50000000 > /proc/sys/kernel/sched_wakeup_granularity_ns

echo 3000 > /proc/sys/vm/dirty_expire_centisecs

echo 500 > /proc/sys/vm/dirty_writeback_centisecs

echo 40 > /proc/sys/vm/dirty_ratio

echo 10 > /proc/sys/vm/dirty_background_ratio

echo 10 > /proc/sys/vm/swappiness

echo 0 > /proc/sys/kernel/numa_balancing

echo always > /sys/kernel/mm/transparent_hugepage/defrag

echo always > /sys/kernel/mm/transparent_hugepage/enabled

ulimit -v 800000000

ulimit -m 800000000

ulimit -l 800000000
JVM Settings
For max-jOPS we intentionally restrict the heap size of the Backends to just below the 32GB limit required for compressed-Oops. For best results, use the largest heap size possible. Garbage Collection (GC) is related to the live object size, which for SPECjbb 2015 is around 600MB-1500MB. GC Pause time is relatively constant regardless of heap size, so any increase in heap size will only aid in extending duration between GC cycles.
Backend Options:
The number of ParallelGCThreads for each Backend should be set to the number of HW threads in the system (vCPUs) divided by the number of groups. With an Intel® Xeon® Platinum 8380 the number of threads per NUMA node is 40 (with SNC enabled).
Full BE JVM Options:
-showversion -XX:+UseParallelGC -XX:+UseLargePages -XX:+AlwaysPreTouch
-XX:-UseAdaptiveSizePolicy -XX:SurvivorRatio=28 -XX:MaxTenuringThreshold=15 -XX:InlineSmallCode=10k -verbose:gc -XX:UseAVX=0 -XX:-UseCountedLoopSafepoints -XX:LoopUnrollLimit=20 -server -XX:TargetSurvivorRatio=95 -XX:LargePageSizeInBytes=1G -XX:AllocatePrefetchLines=3 -XX:AllocateInstancePrefetchLines=2 -XX:AllocatePrefetchStepSize=128 -XX:AllocatePrefetchDistance=384 -Xms31744m -Xmx31744m -Xmn29696m -XX:ParallelGCThreads=XX
Controller JVM Options:
-server -Xms2g -Xmx2g -Xmn1536m -XX:UseAVX=0 -XX:+UseLargePages -XX:LargePageSizeInBytes=1G –

XX:+UseParallelGC -XX:ParallelGCThreads=2
Injector JVM Options:
-server -Xms2g -Xmx2g -Xmn1536m -XX:UseAVX=0 -XX:+UseLargePages -XX:LargePageSizeInBytes=1G –

XX:+UseParallelGC –XX:ParallelGCThreads=2
SPECjbb 2015 Settings
We recommend using these options in the SPECjbb2015.props file:
specjbb.controller.type = HBIR_RT

specjbb.controller.rtcurve.start = .0

specjbb.forkjoin.workers.Tier1=248

specjbb.forkjoin.workers.Tier2=8

specjbb.forkjoin.workers.Tier3=50

specjbb.group.count=4

specjbb.comm.connect.client.pool.size=232

specjbb.customerDriver.threads=75

specjbb.customerDriver.threads.probe=69

specjbb.customerDriver.threads.saturate=85

specjbb.mapreducer.pool.size=223

specjbb.comm.connect.selector.runner.count=1

specjbb.comm.connect.worker.pool.max=81

specjbb.comm.connect.worker.pool.min=24

specjbb.comm.connect.timeouts.connect=600000

specjbb.comm.connect.timeouts.read=600000

specjbb.comm.connect.timeouts.write=600000
Correlation between threads and Tiers
When T = total # of threads per group is given then to have significant impact on performance it is advised to set:
Tier1 = 6.2*T, Tier2 = .2*T, Tier3 = 1.25*T
With SPECjbb2015 the workload should be able to saturate the CPU to above 95%. If you are failing at a lower utilization, you may be able to tune the Tier sizes to increase the utilization
Tuned for Latency (crit-jOPS)
BIOS Settings
In the crit-jOPs tuning we recommend the values in BIOS Setting, with this change:
OS Settings
ulimit -n 131072

sysctl net.core.wmem_max=12582912

sysctl net.core.rmem_max=12582912

sysctl net.ipv4.tcp_rmem='10240 87380 12582912'

sysctl net.ipv4.tcp_wmem='10240 87380 12582912'

sysctl net.core.netdev_max_backlog=655560

sysctl net.core.somaxconn=32768

sysctl net.ipv4.tcp_no_metrics_save=1

systemctl stop systemd-update-utmp-runlevel.service

echo 10000 > /proc/sys/kernel/sched_cfs_bandwidth_slice_us

echo 0 > /proc/sys/kernel/sched_child_runs_first

echo 16000000 > /proc/sys/kernel/sched_latency_ns

echo 1000 > /proc/sys/kernel/sched_migration_cost_ns

echo 28000000 > /proc/sys/kernel/sched_min_granularity_ns

echo 9 > /proc/sys/kernel/sched_nr_migrate

echo 100 > /proc/sys/kernel/sched_rr_timeslice_ms

echo 1000000 > /proc/sys/kernel/sched_rt_period_us

echo 990000 > /proc/sys/kernel/sched_rt_runtime_us

echo 0 > /proc/sys/kernel/sched_schedstats

echo 1 > /proc/sys/kernel/sched_tunable_scaling

echo 50000000 > /proc/sys/kernel/sched_wakeup_granularity_ns

echo 3000 > /proc/sys/vm/dirty_expire_centisecs

echo 500 > /proc/sys/vm/dirty_writeback_centisecs

echo 40 > /proc/sys/vm/dirty_ratio

echo 10 > /proc/sys/vm/dirty_background_ratio

echo 10 > /proc/sys/vm/swappiness

echo 0 > /proc/sys/kernel/numa_balancing

echo always > /sys/kernel/mm/transparent_hugepage/defrag

echo always > /sys/kernel/mm/transparent_hugepage/enabled

ulimit -v 800000000

ulimit -m 800000000

ulimit -l 800000000
JVM Settings
Backend Options:
The number of ParallelGCThreads for each Backend should be set to the number of HW threads in the system (vCPUs) divided by the number of groups. With an Intel® Xeon® Platinum 8380 the number of threads per NUMA node is 80 (with SNC disabled).
The heap size for the Backend can be quite a bit larger when optimizing for latency. In many cases the “full” GC can be avoided by arrange for a large young generation. A recommendation is to allocate up to ((Total machine RAM – 5GB) / Number of Groups) per backend, and around 90-95% of the Java heap to the young generation (with the -Xmn option).
Full BE JVM Options:
-showversion -XX:+UseParallelGC -XX:+UseLargePages -XX:+AlwaysPreTouch -XX:-UseAdaptiveSizePolicy -XX:SurvivorRatio=28 -XX:MaxTenuringThreshold=15 -XX:InlineSmallCode=10k -verbose:gc -XX:UseAVX=0 -XX:-UseCountedLoopSafepoints -XX:LoopUnrollLimit=20 -server -XX:TargetSurvivorRatio=95 -XX:LargePageSizeInBytes=1G -XX:AllocatePrefetchLines=3 -XX:AllocateInstancePrefetchLines=2 -XX:AllocatePrefetchStepSize=128 -XX:AllocatePrefetchDistance=384 -Xms220g -Xmx220g -Xmn200g -XX:ParallelGCThreads=XX
Controller JVM Options:
-server -Xms2g -Xmx2g -Xmn1536m -XX:UseAVX=0 -XX:+UseLargePages -XX:LargePageSizeInBytes=1G –XX:+UseParallelGC -XX:ParallelGCThreads=2
Injector JVM Options:
-server -Xms2g -Xmx2g -Xmn1536m -XX:UseAVX=0 -XX:+UseLargePages -XX:LargePageSizeInBytes=1G –XX:+UseParallelGC –XX:ParallelGCThreads=2
SPECjbb 2015 Settings
For best critical-jOPs we recommend running 4 Groups in multi-JVM mode, best performance coming when we bind two groups (Backend and Injector), to each NUMA Node using tools similar to numactl. Having two Groups per node increases the number of transactions at the lower latencies used to calculate the critical-jOPS.
We recommend using these options which need to be placed in the SPECjbb2015.props file:
specjbb.controller.type = HBIR_RT

specjbb.controller.rtcurve.start = .0

specjbb.forkjoin.workers.Tier1=248

specjbb.forkjoin.workers.Tier2=8

specjbb.forkjoin.workers.Tier3=50

specjbb.group.count=4

specjbb.comm.connect.client.pool.size=232

specjbb.customerDriver.threads=75

specjbb.customerDriver.threads.probe=69

specjbb.customerDriver.threads.saturate=85

specjbb.mapreducer.pool.size=223

specjbb.comm.connect.selector.runner.count=1

specjbb.comm.connect.worker.pool.max=81

specjbb.comm.connect.worker.pool.min=24

specjbb.comm.connect.timeouts.connect=600000

specjbb.comm.connect.timeouts.read=600000

specjbb.comm.connect.timeouts.write=600000
Correlation between threads and Tiers
When T = total # of threads per group is given then to have significant impact on performance it is advised to set:
Tier1 = 6.2*T, Tier2 = .2*T, Tier3 = 1.25*T
With SPECjbb 2015 the workload should be able to saturate the CPU to above 95%. If you are failing at a lower utilization, you may be able to tune the Tier sizes to increase the utilization
Notices & Disclaimers
Intel technologies may require enabled hardware, software or service activation.
No product or component can be absolutely secure.
Your costs and results may vary.
Code names are used by Intel to identify products, technologies, or services that are in development and not publicly available. These are not "commercial" names and not intended to function as trademarks
The products described may contain design defects or errors known as errata which may cause the product to deviate from published specifications. Current characterized errata are available on request.
© Intel Corporation. Intel, the Intel logo, and other Intel marks are trademarks of Intel Corporation or its subsidiaries. Other names and brands may be claimed as the property of others.