This guide provides quick steps to create, build, debug, and analyze OpenCL™ applications with the Intel® SDK for OpenCL™ Applications, available as:
- Standalone distribution
- Intel® System Studio
- Intel® Media Server Studio
Intel® SDK for OpenCL™ Applications for Windows* provides integrated development environment for Microsoft* Windows* applications for mobile and desktop client systems. If you wish to target your OpenCL applications for Linux* systems or other server and embedded configurations, you can use Intel® SDK for OpenCL™ Applications for Linux*, Intel® System Studio for Linux*, or Intel® Media Server Studio. Additional Intel SDK for OpenCL Applications options are available at https://software.intel.com/en-us/intel-opencl.
About the Intel® SDK for OpenCL™ Applications
Intel® SDK for OpenCL™ Applications is a software tool suite that enables development of OpenCL applications via well-known integrated development environments, targeting the Intel® Architecture processors with the Intel® Processor Graphics.
Intel SDK for OpenCL Applications has the following capabilities:
- OpenCL C kernel code compilation and analysis
- OpenCL C kernel and host code debugging and performance profiling
- Integration into Microsoft* Visual Studio* and Eclipse* IDEs for application development
Which Version of the Intel® SDK for OpenCL™ Applications Should I Use?
Depending on your target operating systems and hardware set, select between the Microsoft* Windows* or Linux* versions of the Intel® SDK for OpenCL™ Applications.
The Intel SDK for OpenCL Applications provides the following features:
- Tools to build, debug, and analyze:
- Microsoft* Visual Studio* and Eclipse* IDEs integration
- OpenCL C kernel development framework
- OpenCL 2.1 development environment
- OpenCL C kernel debugging
- OpenCL API debugging and tracing
- OpenCL API and kernel performance analysis capabilities
- Latest standards support:
- OpenCL 2.1, 2.0 & 1.2
- SPIR, SPIR V
- Portability between operating systems and devices:
- Intel® processors and Intel® Processor Graphics support
- Windows Linux host development environment
- Windows and Linux targets
- Intel® Architecture optimizations with graphics compute:
- New Intel® Core™ M, 6th, 7th, and 8th Generation Intel® Core™ processors
- Intel® Atom™ processors
- On-die heterogeneous computing with shared virtual memory
For a full list of features, refer to the Intel® SDK for OpenCL™ Applications Release Notes.
Are you looking for more configurations, like OpenCL support for Intel® Processor Graphics for Linux* OS? Use the Intel SDK for OpenCL Applications available with the Intel® System Studio or Intel® Media Server Studio. See additional configurations at https://software.intel.com/en-us/intel-opencl.
Prerequisites
The following components must be installed on the system to ensure the Intel® Code Builder for OpenCL™ API components work:
- For OpenCL™ support on Intel® Processor Graphics, use machines with the 3rd Generation Intel® Core™ processors, Intel® Atom™ processors previously known as "Bay Trail", and higher versions of the hardware
- Intel® Graphics Driver version 15.33 and higher
- OpenCL on Intel® Processor Graphics is not available in virtual environments. In this case, as well as with older versions of Intel processors, you have to manually pre-install the Intel® SDK for OpenCL™ - CPU only runtime package 15.1 for CPU devices. Refer to the Intel SDK for OpenCL - CPU only runtime package release notes for a full list of supported hardware
- Optional: Microsoft Visual Studio* 2015 or 2017 or Eclipse* (Luna, Mars, Neon, and Oxygen) IDEs.
For help on installing the product refer to the "Installation Guidelines" sections in release notes.
Getting Started with the Intel® Code Builder for OpenCL™ API Tools
A simple way to get started with the Intel® SDK for OpenCL™ Applications is to use its Microsoft Visual Studio* plug-in: Intel® Code Builder for OpenCL™ API.
Check OpenCL™ Platform Availability
Right after installing the Intel® SDK for OpenCL™ Applications, you can check availability of the OpenCL platform on your system. To do so,
- Run Visual Studio*.
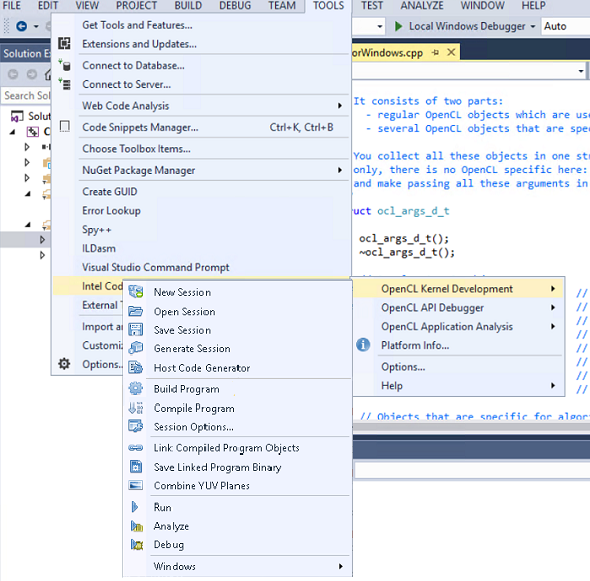
- Go to Tools > Intel Code Builder for OpenCL API > Platform Info…
As a result you should see the Platform Info window with the list of available platforms and your hardware properties.
Build an OpenCL™ Kernel
Next step is to build an OpenCL™ kernel using the Microsoft Visual Studio* plug-in.
In this example we use a ready code sample from the list of Intel’s OpenCL code samples to test the plug-in.
To build a sample application
- Download the OpenCL Platform Capabilities Viewer Sample or any other available code sample.
- Unpack the archive to the destination of your choice.
- In Visual Studio*, open the solution file corresponding to your Visual Studio* version.
- Press Build > Build Solution.
In case of a successful build operation, you receive the following output:
In case of a failure, you receive error messages. For example:
You can develop an OpenCL kernel yourself.
See the Developer Guide for more information about developing kernels using the Code Builder plug-in for Visual Studio.
Create, Run and Validate OpenCL™ Kernels
Intel® SDK for OpenCL™ Applications provides native integrated development environment in the Microsoft Visual Studio* and Eclipse* IDEs that enables you to build, run, validate and analyze OpenCL™ kernels.
To use Kernel Development Framework, go to Tools > Intel Code Builder for OpenCL API> OpenCL Kernel Development.

You can create a new session or load an existing one, build it, assigned inputs to the kernel, test its correctness and analyze kernel performance based on group size, build options, and target device.
Use the following link to parts of the Intel® Code Builder for OpenCL™ API Developer Guide for more information about each of the Kernel Development Framework.
Debug and Analyze OpenCL™ Applications
You can debug OpenCL™ applications using the OpenCL C Kernel debugger and API debugging capabilities of the Intel® Code Builder for OpenCL™ API plug-in for Microsoft Visual Studio* IDE.
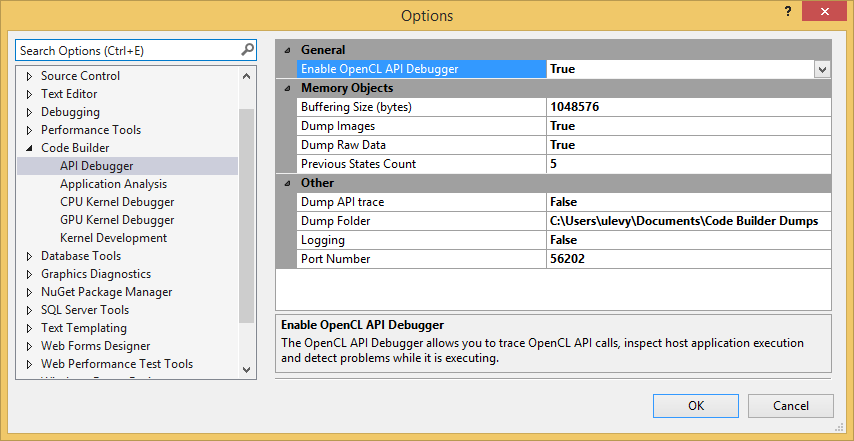
To start debugging API calls of an OpenCL application, you need to configure the API debugger:
- Start Visual Studio.
- Go to Tools > Intel Code Builder for OpenCL API > Options...
- Go to API Debugger and set Enable OpenCL API Debugger to True.

Now you can toggle breakpoint in the application on OpenCL API call and start debugging in the standard way - with F5.
The API Debugger provides multiple views of the API calls. To open the views of your interest, just go to Tools > Intel Code Builder for OpenCL API > OpenCL API Debugger.

Use the following links to parts of the Intel® Code Builder for OpenCL™ API Developer Guide for more information about each of the API Debugger views:
- Trace View
- Objects Tree View
- Properties View
- Command Queue View
- Problems View
- Image View
- Data View
- Memory Tracing
For the full list of Intel Code Builder for OpenCL API plug-in capabilities as well as instructions for using them, see to the Intel® SDK for OpenCL™ Applications - Developer Guide.
Debug OpenCL™ Kernel Code
Intel® SDK for OpenCL™ Applications delivers a seamless debugging experience that enables you to debug both CPU and GPU portions of your application simultaneously.
The source-level kernel debugger enables you to debug OpenCL™ kernels running on the CPU and Intel® Processor Graphics through Microsoft Visual Studio* 2015.
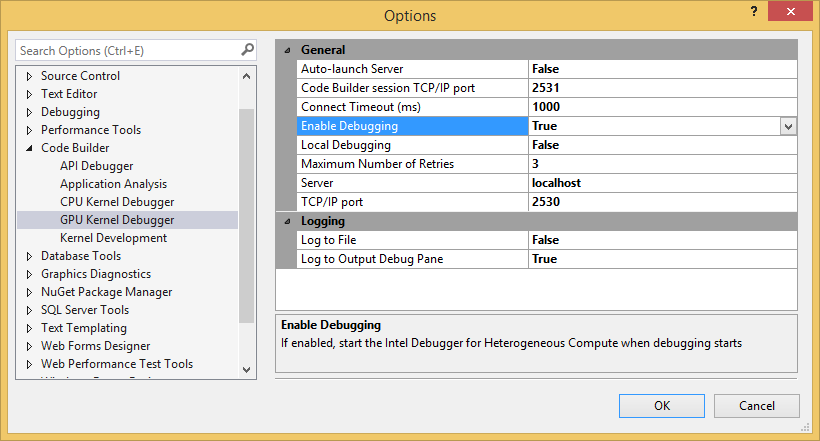
To enable the OpenCL kernel debugger go to: Tools > Intel Code Builder for OpenCL API > Options...
In the CPU Kernel Debugger settings set the “Enable OpenCL CPU Kernel Debugger” property to true and in the GPU Kernel Debugger settings respectively and set the “Enable Debugging” property to True.

For the full list of Intel Code Builder for OpenCL API plug-in capabilities as well as instructions for using them, see the Intel® SDK for OpenCL™ Applications - Developer Guide.
Analyze an OpenCL™ Application
Once you finish with application development, you can start gathering analysis data to improve the application performance.
To start the analysis:
- Go to Tools > Intel Code Builder for OpenCL API > OpenCL Application Analysis > New Analysis Session....
- Select the application and the application parts that you wish to analyze.
- Check the Start Automatically on Process Launch check box and click Launch.
Your application is launched and the Code Analyzer starts to collect data. - When the application finishes running, a new analysis session appears in the Analyze Sessions Explorer window and a results view appears in the Microsoft Visual Studio* main area.
The analysis result view contains an analysis home page and an analysis progress bar with several steps to review the analysis results:
Browse through the report menus to view all the analysis information.
Documentation and Resources
Consider the following documents and web articles to get started with the Intel® Code Builder for OpenCL™ API:
- OpenCL™ 2.0 Specification – contains basic information about the OpenCL technology
- Khronos* OpenCL Registry – all official information about OpenCL provided by Khronos*
- Intel® SDK for OpenCL™ Applications Developer Guide - full set of information on using the product tools, features, OpenCL™ runtime, and also guidelines for optimizing OpenCL applications
- OpenCL Code Samples – publically available OpenCL code samples developed by Intel Corporation