This article details how Intel® GPA was used to improve the Galactic Civilizations video game. It is showcases how 2 of the Intel® GPA tools, Graphics Trace Analyzer and Graphics Frame Analyzer are used to identify performance issues within the GPU queue, visualizing activity in the GPU queue and the CPU cores. Follow along on the profiling journey, seeing how the Intel® GPA tool suite was used to find these bottlenecks and detail the importance of using profiling tools during game development.
While Intel® GPA tools have been updated since this article was written, the following process is relevant and can be referenced as a case study to understand the advantages of incorporating profiling into your development process. This case study will guide game devs through the profiling process documenting the profiling that was done to optimize Galactic Civilizations* 3 before it's release in 2015.
Download Document (Note: In this document Graphics Trace Analyzer was referred to as Platform Analyzer.)
Galactic Civilizations* 3 (GC3) is a turn-based 4X strategy game developed and published by Stardock Entertainment that released on May 14th, 2015. During the early access and beta periods, we profiled and analyzed the rendering performance of the game. One of the big performance improvements made was the removal of several CPU-GPU sync stalls that were responsible for losing some parallelism between the CPU and GPU. This article describes the issue and the fix and emphasizes the importance of using performance analysis tools during development, while keeping their strengths and limitations in mind.
Spotting the issue
We started the rendering performance analysis with Intel® Graphics Performance Analyzers' Graphics Trace Analyzer (formerly Platform Analyzer). The screenshot below is a trace capture from the game (without v-sync) before improvements were made. The GPU queue has several gaps within and between frames, with less than one frame's worth of work queued up at any time. If the GPU queue is not fully loaded by the CPU, it will have gaps, causing the application to fail to leverage the visible idle time. Hence, there is opportunity to improve performance, i.e. visual fidelity and/or fps.
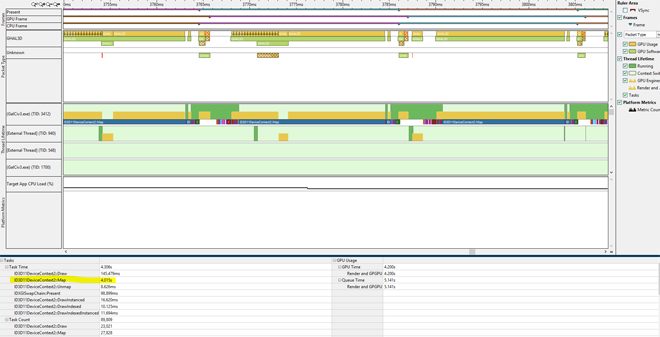
Before Profiling: Frame time = ~21 ms; Less than 1 frame queued; Gaps in the GPU queue; Very long Map call
Graphics Trace Analyzer also shows the time spent processing each Direct3D* 11 API call (i.e., application -> runtime -> driver and back). In the screenshot above, you can see an ID3D11DeviceContext::Map call that takes ~15 ms to return, during which the application's main thread does nothing.
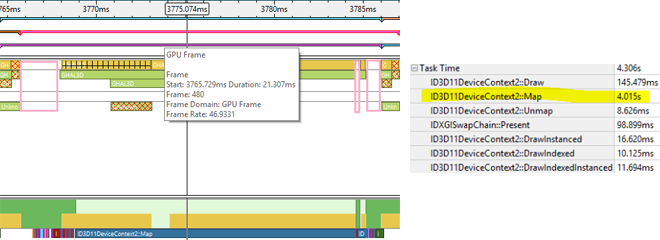
The image below shows a zoom into one frame’s timeline, from CPU start to GPU end. The gaps are shown in pink boxes, amounting to ~3.5 ms per frame. Graphics Trace Analyzer also tells us the cumulative duration of various API calls for the trace, with Map taking 4.015 seconds out of the total 4.306 seconds!
It’s important to note that while you can analyze a single, or multiple, frames with Graphics Frame Analyzer, this tool cannot spot the long Map call with a frame capture. Graphics Frame Analyzer uses GPU timer queries to measure the time for an erg, which consists of state changes, binding resources, and the draw. The Map however happens on the CPU, with the GPU unaware of it.
Debugging the issue
(See the Direct3D resources section at the end for a primer on using and updating resources.)
Driver debug revealed the long Map call to be using DX11_MAP_WRITE_DISCARD (Graphics Trace Analyzer doesn't show you the arguments of the Map call) to update a large vertex buffer that was created with the D3D11_USAGE_DYNAMIC flag.
This is a very common scenario in games to optimize the data flow to frequently updated resources. When mapping a dynamic resource with DX11_MAP_WRITE_DISCARD, an alias is allocated from the resource's alias-heap and returned. An alias refers to the memory allocation for the resource each time it is mapped. When there is no room for aliases on the resource's current alias-heap, a new shadow alias-heap is allocated. This continues to happen until the resource’s heap limit is reached.
This was precisely the issue in GC3. Each time this happened (which was multiple times a frame for a few large resources that were mapped several times), the driver waited on a draw call using an alias of the resource (which was allocated earlier) to finish, so it could reuse it for the current request. This wasn’t an Intel-specific issue. It occurred on NVIDIA's driver too and was verified with GPUView to confirm what we found with Graphics Trace Analyzer.
The vertex buffer was ~560 KB (size was found via the driver) and was mapped ~50 times with discard in a frame. The Intel driver allocates multiple heaps on demand (each being 1 MB) per resource to store its aliases. Aliases are allocated from a heap until they no longer can be, after which another 1 MB shadow alias-heap is assigned to the resource and so on. In the long Map call's case, only one alias could fit in a heap; thus, each time Map was called on the resource, a new shadow heap was created for that alias until the resource's heap limit was reached. This happened every frame (which is why you see the same pattern repeat), wherein the driver was waiting for an earlier draw call (from the same frame) to be done using its alias, in order to reuse it.
We looked at the API log in Graphics Frame Analyzer to filter resources that were mapped several times. We found several such cases, with the UI system being the lead culprit, mapping a vertex buffer 50+ times. Driver debug showed that each map updated only a small chunk of the buffer.
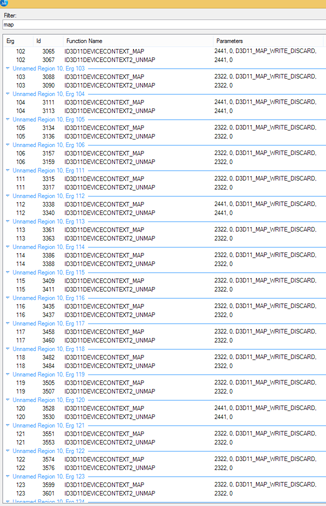
Same resource (handle 2322) being mapped several times in a frame
Fixing the issue
At Stardock, we instrumented all their rendering systems to get additional markers into the Graphics Trace Analyzer’s timeline view, in part to verify that the UI system was behind the large call and for future profiling.
We had several options for fixing the issue:
- Set the Map flag to D3D11_MAP_WRITE_NO_OVERWRITE instead of D3D11_MAP_WRITE_DISCARD:
The large vertex buffer was being shared by several like-entities. For example, most of the UI elements on the screen shared a large buffer. Each Map call updated only a small independent portion of the buffer. The ships and asteroids that used instancing also shared a large vertex/instance data buffer. D3D11_MAP_WRITE_NO_OVERWRITE would be the ideal choice here since the application guarantees that it won't overwrite regions of the buffer that could be in use by the GPU. - Split the large vertex buffer into several smaller ones:
Since alias allocation was the reason behind the stall, considerably reducing the vertex buffer size allows several aliases to fit in a heap. GC3 doesn't submit too many draw calls, and hence, reducing the size by a factor of 10 or 100 (560 KB to 5-50 KB) would fix it. - Use the D3D11_MAP_FLAG_DO_NOT_WAIT flag:
You can use this flag to detect when the GPU is busy using the resource and do other work before remapping the resource. While this lets the CPU do actual work, it'd make for a really bad fix in this case.
We went with the second option and changed the constant used in the buffer creation logic. The vertex buffer sizes were hardcoded for each subsystem and just needed to be lowered. Several aliases could now fit into each 1 MB heap, and with the comparatively low number of draw calls in GC3, the issue wouldn’t crop up.
Each rendering subsystem fix magnified the issue in another one, so we fixed it for all the rendering subsystems. A trace capture with the fixes and instrumentation, followed by a zoomed-in look at one frame, is shown below:
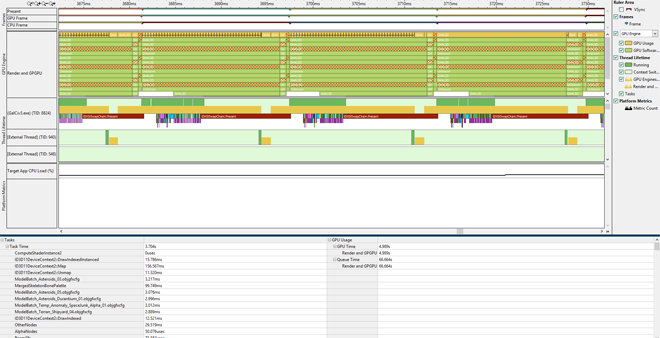
After: Frame time = ~16 ms – 3 frames queued – No gaps in GPU queue – No large Map calls
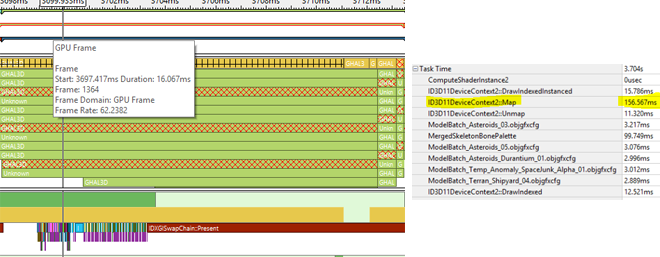
The total time taken by Map went down from 4 seconds to 157 milliseconds! The gaps in the GPU queue disappeared. The game had 3 frames queued up at all times and was waiting on the GPU to finish frames to submit the next one! The GPU was always busy after a few simple changes. Performance went up by ~24% with each frame taking ~16 ms instead of ~21 ms.
Importance of GPU profiling tools during game development
Here’s what Stardock had to say:
Without tools like GPA Platform Analyzer [now Graphics Trace Analyzer] or GPUView, we wouldn't have known what was happening on the GPU because the information we get back from DirectX is only if the call succeeded or not. Traditionally, we would have disabled systems, or parts of systems, to try to isolate where the performance costs are coming from. This is a very time consuming process, which can often consume hours or days without any practical benefit, especially, if the bottlenecks aren’t in the systems you expect.
Also, measuring isolated systems can often miss issues that require multiples systems to interact to cause the problem. For example, if you have a bottleneck in the animation system you may not be able to identify it if you have enough other systems disabled that the animation system (which is your performance problem) now has enough resources to run smoothly. Then you spend time troubleshooting the wrong system, the one you removed, instead of the source of the actual problem.
We have also tried to build profiling tools into our games. Although this works, we only get measurement data on the systems we explicitly measure, again making us unable to see issues from systems we wouldn’t expect. It is also a lot of work to implement and has to be maintained through the games development to be usable. And we need to do it over again with each game we make. So we get partial information at a high development cost. Because of this, issues can be hard to detect just by looking over the code, or even stepping through it, because it may appear correct and render properly, but, in reality, it is causing the GPU to wait or perform extra work.
This is why it is important to understand what is happening on the GPU.GPU profiling tools are critical for quickly showing developers where their code is causing the GPU to stall or where the frame is spending the most time. Developers can then identify which areas of the code would benefit the most from optimization, so they can focus on making improvements that make the most noticeable changes to performance.
Conclusion
Optimizing the rendering performance of a game is a complex beast. Frame and Trace capture-replay tools provide different and important views into a game’s performance. This article focused on CPU-GPU synchronization stalls that required a trace tool like GPA Graphics Trace Analyzer or GPUView to locate.
Credits
Thanks to Derek Paxton (Vice President) and Jesse Brindle (Lead Graphics Developer) at Stardock Entertainment for the great partnership and incorporating these changes into Galactic Civilizations 3.
Special thanks to Robert Blake Taylor for driver debug, Roman Borisov and Jeffrey Freeman for GPA guidance, and Axel Mamode and Jeff Laflam at Intel for reviewing this article.
About the author
Raja Bala is an application engineer in the game developer relations group at Intel. He enjoys dissecting the rendering process in games and finding ways to make it faster and is a huge Dota2* and Valve fanboy.
Direct3D* resources primer
The Direct3D API can be broken down into resource creation/destruction, setting render pipeline state, binding resources to the pipeline, and updating certain resources. Most of the resource creation happens during the level/scene load.
A typical game frame consists of binding various resources to the pipeline, setting the pipeline state, updating resources on the CPU (constant buffers, vertex/index buffers,…) based on simulation state, and updating resources on the GPU (render targets, uavs,…) via draws, dispatches, and clears.
During resource creation, the D3D11_USAGE enum is used to mark the resource as requiring:
(a) GPU read-write access (DEFAULT - for render targets, uavs, infrequently updated constant buffers)
(b) GPU read-only access (IMMUTABLE - for textures)
(c) CPU write + GPU read (DYNAMIC - for buffers that need to be updated frequently)
(d) CPU access but allowing the GPU to copy data to it (STAGING)
Note that the resource's D3D11_CPU_ACCESS_FLAG needs to also be set correctly to comply with the usage for c & d.
In terms of actually updating a resource's data, the Direct3D 11 API provides three options, each of which is used for a specific usage (as described earlier):
(i) Map/Unmap
(ii) UpdateSubresource
(iii) CopyResource / CopySubresourceRegion
One interesting scenario, where implicit synchronization is required, is when the CPU has write access and GPU has read access to the resource. This scenario often comes up during a frame. Updating the view/model/projection matrix (stored in a constant buffer) and the (animated) bone transforms of a model are examples. Waiting for the GPU to finish using the resource would be too expensive. Creating several independent resources (resource copies) to handle it would be tedious for the application programmer. As a result, Direct3D (9 to 11) pushes this onto the driver via the DX11_MAP_WRITE_DISCARD Map flag. Each time the resource is mapped with this flag, the driver creates a new memory region for the resource and lets the CPU update that instead. Thus, multiple draw calls that update the resource end up working on separate aliases of the resource, which, of course, eats up GPU memory.
For more info on resource management in Direct3D, check:
John McDonald's "Efficient Buffer Management" presentation at GDC
Direct3D 11 Introduction to resources
Direct3D 10 Choosing a resource
UpdateSubresource v/s Map