Graphics and Visualization Researchers
 Data visualization plays a critical role in the analysis of a wide variety of data from fields like biomedical sciences, physics, medicine, or astronomy. For more than a decade, VIDI, the visualization lab at UC Davis has been a leading force in data visualization research with many notable contributions across the visualization and rendering community.
Current requirements for efficient storage and rendering of scientific data—especially volumetric data—often exceed the capabilities of the hardware available to researchers and consumers. It is essential to develop targeted solutions to tackle these restrictions.
With the help of cross-architecture Intel® oneAPI toolkits, researchers at VIDI were able to develop two techniques that will help render and store volumetric scientific data more efficiently than previously possible. This resulted in up to 3x improvement in rendering performance and more than 100x less storage requirements compared to baseline methods.
Volume Storage Optimization with Instant Neural Representation
With the help of instant neural representations, the team was able to significantly reduce the storage requirements of volumetric data. By leveraging small neural networks, the tool can represent gigabytes of volume data implicitly in the form of a trained network, which takes just a few megabytes to store on disk. This allowed the researchers at VIDI to achieve compression rates of several hundred times (Figure 1). The team implemented a new compression mechanism that uses a combination of positional encoding (Figure 2) and multilayer perceptrons (Figure 3) to learn a mapping from sampling positions to volume densities.

Figure 1. A comparison of training results between our proposed method and two state-of-the-art techniques: fV-SRN, which was adjusted to match our models’ compression ratios, and tthresh, which was adjusted to match our models’ PSNRs after 20k steps of training. Our models were trained on a Windows* machine with RTX 3090, while fV-SRN models were trained on a Linux* machine with a faster RTX 3090Ti and Intel® Xeon® Scalable processor (E5-2699)due to operating system compatibility issues. The tthresh experiments were run on an 88-core Linux server with 256 GB of memory because tthresh is a CPU-based algorithm. The table also indicates experiments that ran out of memory (as OOM). Our method outperforms state-of-the-art techniques, with the best and worst results within each category highlighted in red and gray, respectively.

Figure 2. Comparing similar-sized networks with different input encoding methods. For hash grid, an 8-level input encoding with 4 features per level (8×4) is used. For dense grid, we can only use a 2×2 encoding to meet the parameter count requirement. This led to a reduction in quality. Detailed network and training configurations are specified in the appendix. Generally, grid-based encodings are faster to train. Compared with dense grid, hash grid can support more encoding layers and thus achieve better quality in equal conditions.
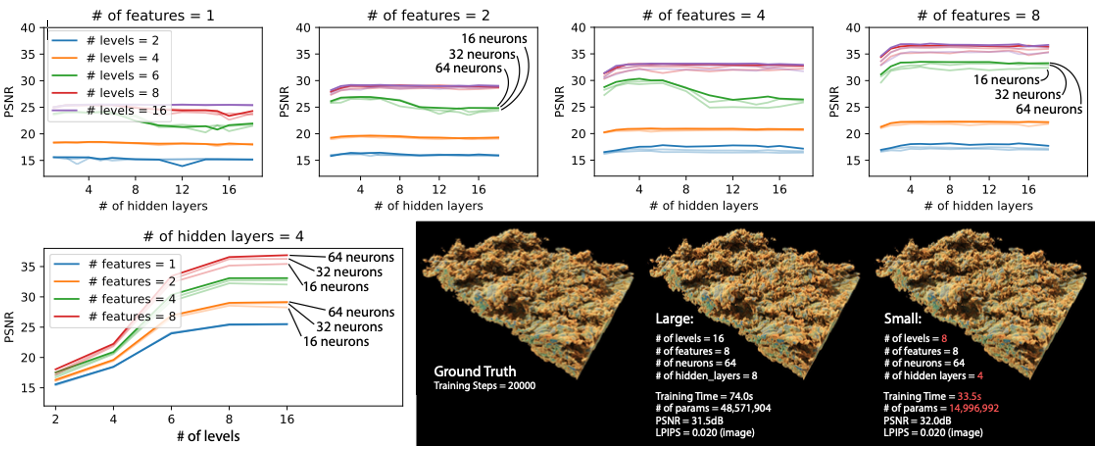
Figure 3. Hyperparameter study. We used the same hash table size T = 219 and scanned the number of encoding levels, number of features per level, number of MLP hidden layers, and number of neurons per layer. We show all the results in the top row. We also show the result for four-hidden-layer cases differently. Then, we picked an optimal configuration and compared it with a larger, naively picked model. We compared their training times parameter counts, volume reconstruction qualities, and rendering qualities.
With the help of Intel® Open Volume Kernel Library (Intel® Open VKL), representations of extreme-scale volumes (tera-scale) are possible. Intel Open VKL allows for efficient host-side out-of-core sampling of volumes that otherwise do not fit working memory (Figure 4). Most such representations can be created in less than a minute and the training speed and output quality can be adjusted as needed (Figure 3). Once trained they can be used to reconstruct the full volume or even render them directly from the representation (Figure 5). To improve upon naïve sampling in the rendering process, the researchers implement specialized traversal and sampling mechanisms to gather only the relevant sampling points and make every neural inference count (Figure 6). The resulting renderings are almost indistinguishable from the (magnitudes larger) ground truth datasets (Figures 1, 7, 8).
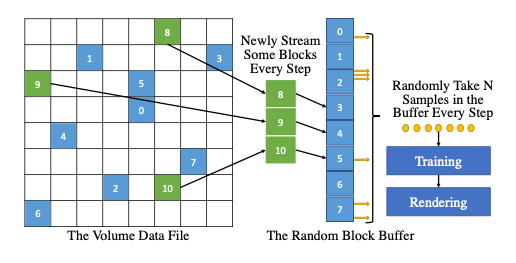
Figure 4. Our out-of-core sampling method works by maintaining a random block buffer in the system memory. We sample and asynchronously update this buffer every frame. Then, we transfer sampled results to GPU for training.

Figure 5. Comparison of frame rates between fV-SRN and our method for three rendering methods: ray marching, ray marching with single shot shadows, and path tracing. MC stands for macro-cell, IS for in-shader inference, and SS for sample streaming. Note that some fV-SRN trainings ran out of memory, thus marked as OOM. Fastest frame rates within each category are highlighted in red, while the slowest frame rates are highlighted in gray. Intel® Xeon® Scalable processor (E5-2699) and RTX 3090 was used to render all the models.
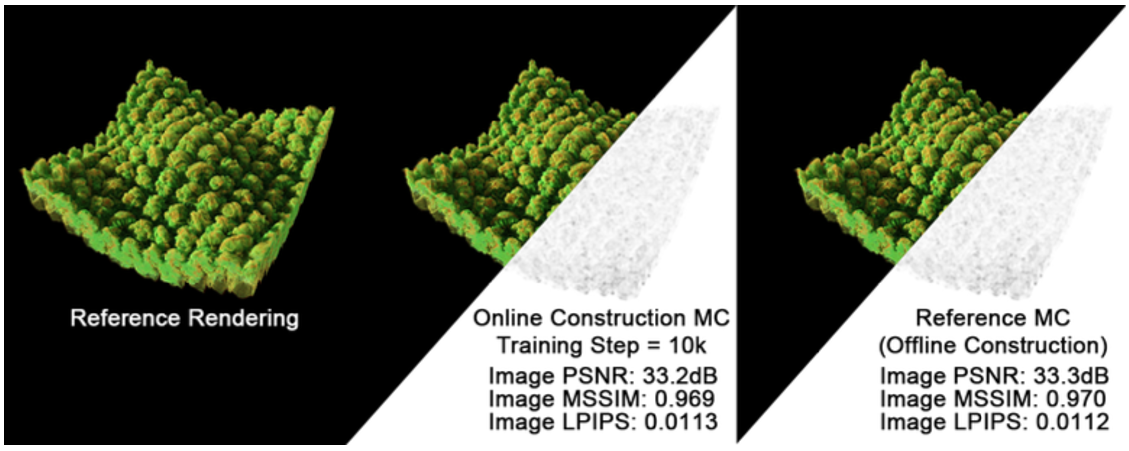
Figure 6. To save resources when inferring the network, we want to take as few samples as possible. We use a technique digital differential analyzer (DDA) to create optimization structures called macro cells. This is a general rendering concept and is technology independent. We did use CUDA* to realize this due to GPU accelerated rendering speed.
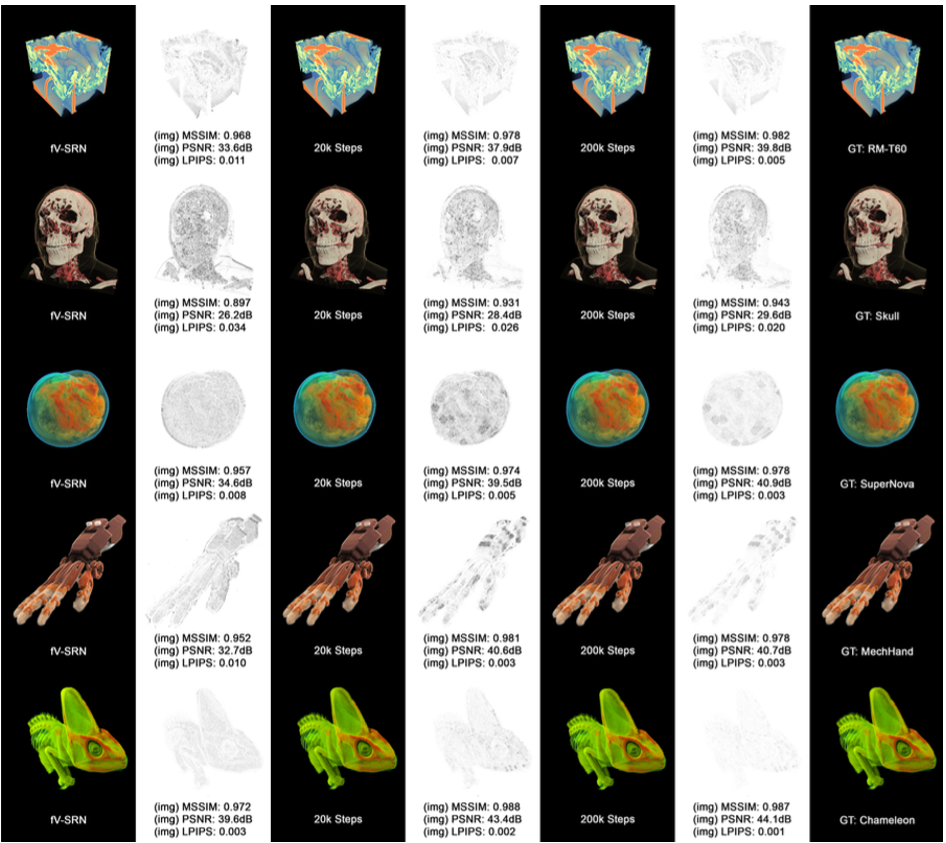
Figure 7. Rendering quality comparison. We rendered each neural representation by exactly 200 frames. The image space PSNR, SSIM, and LPIPS were computed against reference renderings.
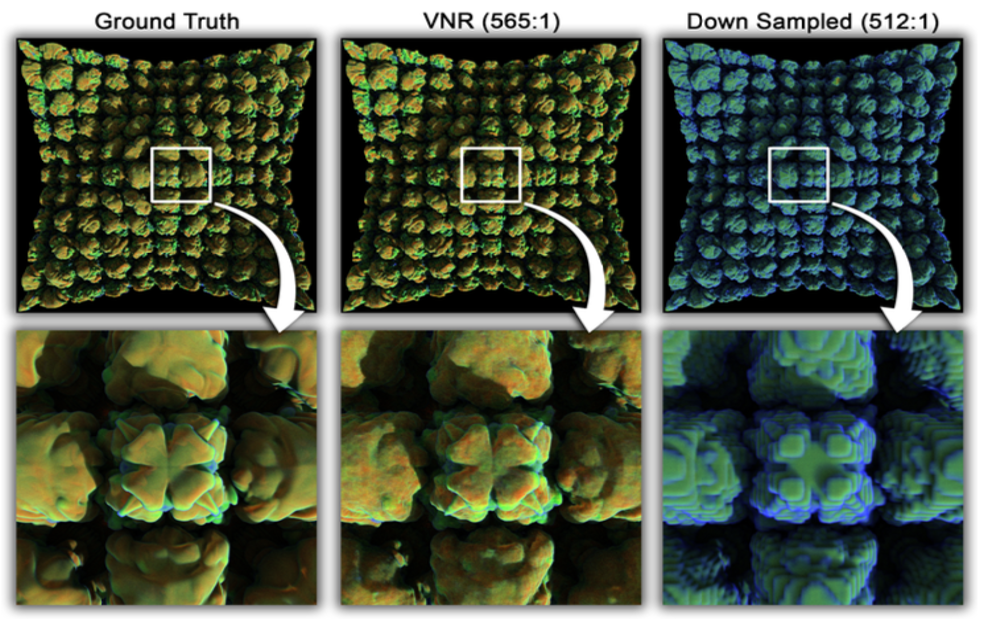
Figure 8. Rendering quality comparison between ground truth data and a trained volumetric neural representation (10k training steps, same transfer function). Left: the ground truth rendering (using Intel® Xeon® Scalable processor and RTX8000 as the volume is too large). Middle: path tracing of the neural representation (VNR). Artifacts are relatively small. Right: the rendering of the 8× down-sampled volume (to match the VNR compression ratio). The down-sampled volume produced very significant artifacts.
Faster Volume Rendering with FoVolNet
FoVolNet helps improve rendering performance for resource intensive volume rendering applications like ray marching with accurate global illumination effects. The researchers at VIDI train a deep neural network (Figure 9) to reconstruct partially rendered frames (Figure 10). This allows users to reduce the number of computations needed to compute a frame and replace the remaining work by a cheap (easy to compute) neural network inference, leading to rendering performance multiple times faster than the baseline method (Figures 12, 11, 13).

Figure 9. The reconstruction network comprises two U-Net stages D and K. All Conv2D layers are configured with a stride and padding of 1 and no dilation. Network D uses a 3 × 3 kernel size while K uses 1 × 1 kernels. Upsample2D layers use bilinear interpolation for filtering. Skip connection are not shown in favor of readability. Network D performs coarse reconstruction through direct prediction while the second stage K uses D’s hidden state to predict convolutional kernels which are subsequently applied to D’s output to produce the final frame.

Figure 10. Overview of FoVolNet’s components. The rendering pipeline loads a volume and renders it sparsely saving time by skipping pixels in the periphery. Then, the sparse rendering is reconstructed by a neural network, which takes constant time. The output of the rendering pipeline is the full-frame rendering.
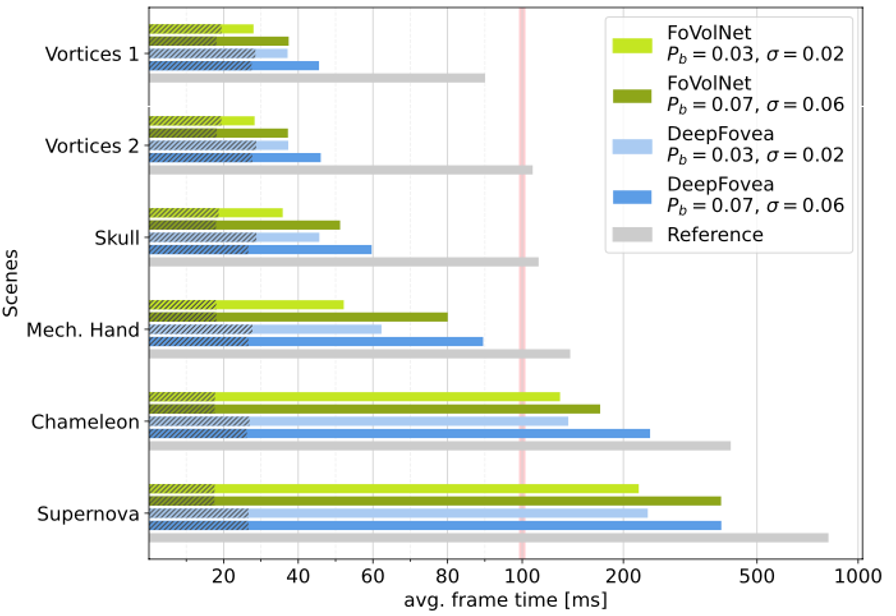
Figure 11. Average frame times from fly-through renderings of different datasets. Each dataset was rendered for 500 frames. The camera movement was frame rate-independent. We compare against DeepFovea as specified by the authors. Note that the x-axis scales logarithmically past frame 100 to accommodate long frame times.

Figure 12. The per-frame timings of different pipeline components during a camera fly-through of VORTI-CES 2. We compare times for FoVolNet using fp16 precision with conventional DVR as the reference. Thumbnails show the camera position at that specific point in the run.

Figure 13. Relative speed-up times when compared to the baseline ray-marching renderer.
The system leverages perceptually favorable noise patterns to construct sparse, foveated sampling masks (Figure 14). These masks are then used by a renderer to render parts of the frame (Figure 15). This sparse frame is then processed by neural reconstruction network (Figure 9) to produce the final image output. The team has shown that reconstructed frames can be produced multiple times faster than the baseline renderer (Figures 12, 11, 13) while preserving the visual quality of the fully rendered image (Figures 16, 17).

Figure 14. Sampling maps are generated using a spatio-temporal blue noise (left). The area around the focal point is sampled more densely using an exponential fall-off to preserve details (middle). The volume is sparsely sampled using the sampling map (right).
With the help of Intel® OSPRay, Intel® oneAPI Deep Neural Network Library (oneDNN), and the power of Intel® Developer Cloud, the team was able to efficiently produce training data, train the reconstruction model (Figure 9), and produce sparse frames (Figures 14, 15) to showcase the tool’s functionality. SYCL* with the Intel® oneAPI DPC++ Compiler was used for custom modules to enable sparse rendering (Figures 14, 15).

Figure 15. The renderer first creates a sampling map, which is compacted into a small frame buffer. The volume is sampled according to each pixel’s ray direction in the full-size frame. After rendering, the resulting color values are projected back to the initial frame.

Figure 16. Visual comparison of reconstruction quality using our method. For each dataset, we show the area around the fovea in blue and a part of the periphery in yellow.

Figure 17. We propose a novel rendering pipeline for fast volume rendering using optimized foveated sparse rendering and deep neural reconstruction networks. FoVolNet can faithfully reconstruct visual information from sparse inputs. With FoVolNet, developers are able to significantly improve rendering time without sacrificing visual quality
What Software and Hardware Is Used?
Software
- Intel oneAPI Deep Neural Network Library (oneDNN)—Used for network training of FoVolNet on CPU server and Intel Developer Cloud cluster
- Intel Open VKL—Used for sample generation in the Instant Neural Representation project
- Intel OSPRay—Used for rendering sparse frames in parts of our demos
- Intel® Developer Cloud—Used for network training in the FoVolNet project
Hardware
An Intel® Xeon® Scalable processor (E5-2699) with 256 gigabytes of memory were the 88-core/176-thread workhorses used to render datasets and train the machine learning models that powered these projects.
Learn More
Intel oneAPI—A simplified, unified, cross-architecture programming model
Intel® Developer Cloud—An accessible platform, for large-scale, cross-architecture development and service deployment
Why It Matters
Using Intel technologies has helped the researchers to produce a majority of the data needed to train the various neural networks involved in the project. Furthermore, they have contributed to creating the renderings that showcase their results and have helped drive benchmarks and interactive rendering applications around this research. The ease of using Intel® oneAPI toolkits has greatly contributed to the successful development of these projects.
Conclusion
The researchers at VIDI continue to explore the avenues of using machine learning to improve the performance and quality of scientific visualization applications. With the support of Intel oneAPI and the power of the upcoming Intel® Arc™ GPUs, we are convinced that more amazing tools and projects are soon to come.