Broken supply chains, restrictions related to COVID-19, and unfavorable economic conditions are just some of the challenges retailers are facing. At each stage of the business process, entrepreneurs must make decisions that determine the revenue, competitiveness, or future path of the company. Developing the best solutions is time-consuming, demanding, and error-prone.
Making decisions should be supported by historical data. However, it is difficult for a human to analyze huge amounts of data from thousands of orders and deliveries. The decision-making process should, therefore, be supported or completely replaced by automatic mechanisms using machine learning (ML). ML is a process where a machine analyzes and gets better (learns) with the more data it sees. Millions of entries are not a problem. Based on the relationships found between the data, a mathematical model is created, which is later used to predict behavior, results, prices, delivery times, etc.
Solving a problem using ML requires looking at it from a different angle. For the company’s processes to be supported by artificial intelligence algorithms, appropriate models must first be prepared. This, however, requires the use of appropriate tools. That’s why Intel and Red Hat are constantly working on new solutions to facilitate ML-related processes. Products such as Red Hat OpenShift* Data Science improve data transport, data mining, training, process automation, and model deployment. At the same time, Intel offers optimized hardware and software such as Intel® Extension for Scikit-learn* (a part of Intel® AI Analytics Toolkit) to improve computational efficiency.
Problem Statement
One of the growing problems is delivery date estimation. Supply shortages can increase costs while reducing earnings. That is why it is important to control the processes and manage the risks associated with them. In the example presented below, we show how to use historical data to predict whether a delivery will be delayed. A high probability of a delay may, for example, result in a decision to launch additional stock from the warehouse, use a substitute part, or even change the supplier.
Approach Description
Late delivery prediction is a type of classification problem. In this case, the goal is to predict whether delivery will be late or on time based on a set of inputs, such as past delivery history or traffic data. Those features are used to train a model. Once trained, it can be used to make predictions on new, previously unseen data. This approach allows using one simple, fast model that “scans” all orders for potential delays. Risky orders can be subjected to further analysis (e.g., using other algorithms that indicate a potential reason for the delay).
Technologies
Red Hat OpenShift Data Science
Red Hat OpenShift Data Science is a service for data scientists and programmers of intelligent applications, available as a self-managed or managed cloud platform. It offers a fully supported environment where ML models may be developed, trained, and tested quickly before being deployed in a real-world setting. Teams can deploy ML models in production on containers—whether on-premises, in the public cloud, in the data center, or at the edge—thanks to the ease with which they can be exported from Red Hat OpenShift Data Science to other platforms.
There are many benefits to using Red Hat OpenShift Data Science for ML. The platform includes a wide range of commercially available partners and open-source tools and frameworks—such as Jupyter Notebooks*, TensorFlow*, PyTorch*, and scikit-learn*—for data scientists to use in their workflows. Red Hat OpenShift Data Science provides a secure and scalable environment.
Intel® AI Analytics Toolkit
Intel AI Analytics Toolkit provides a set of Intel-optimized AI software, libraries, and frameworks, such as XGBoost*, scikit-learn, TensorFlow, and PyTorch. It helps to accelerate end-to-end data science and analytics pipelines on Intel® architectures. The toolkit is intended to speed up and simplify the creation of AI applications. It also supports model deployment across multiple platforms.
The Synergy
To develop the example shown below, we used Intel AI Analytics Toolkit and the Jupyter Notebook kernel built into Red Hat OpenShift Data Science. This is a simple and elegant way to provide a stable development environment for data science and analytics.
Reference Implementation
The process of creating a ML solution typically involves several steps:
- Define the problem
- Data acquisition
- Prepare your environment and choose tools
- Data preprocessing and feature engineering
- Preparing the training data
- Choosing the best ML algorithm
- Training
- Model validation
- Model distribution and deployment
Define the Problem
First, decide what type of problem you want to resolve. The likelihood of finding a solution decreases with the problem’s complexity. Although this isn’t a general rule, we should always start by trying to simplify the issue. In the example, we need a simple solution that indicates potential delivery issues before the delivery even starts.
Data Acquisition
When you know what kind of answer you need, look for the data that might contain it. Sometimes, it requires looking into multiple databases or files and joining them together into one, unified set. (All examples in this article are based on publicly available, open-source data from the Kaggle* platform.) In the following example, we assume that the company has a CSV file with historical records that contains the following features:
- Order ID
- Order Date
- Delivery Date
- Shipping Mode
- Ordering Party (ID, name)
- Customer Segment (Consumer, Corporate...)
- City, State, and Country of delivery
- Market Symbol (US, APAC...)
- Region
- Product (ID, category)
- Order (price, quantity, discounts, delivery costs)
- Order Priority
Figure 1 shows a slice of the data.
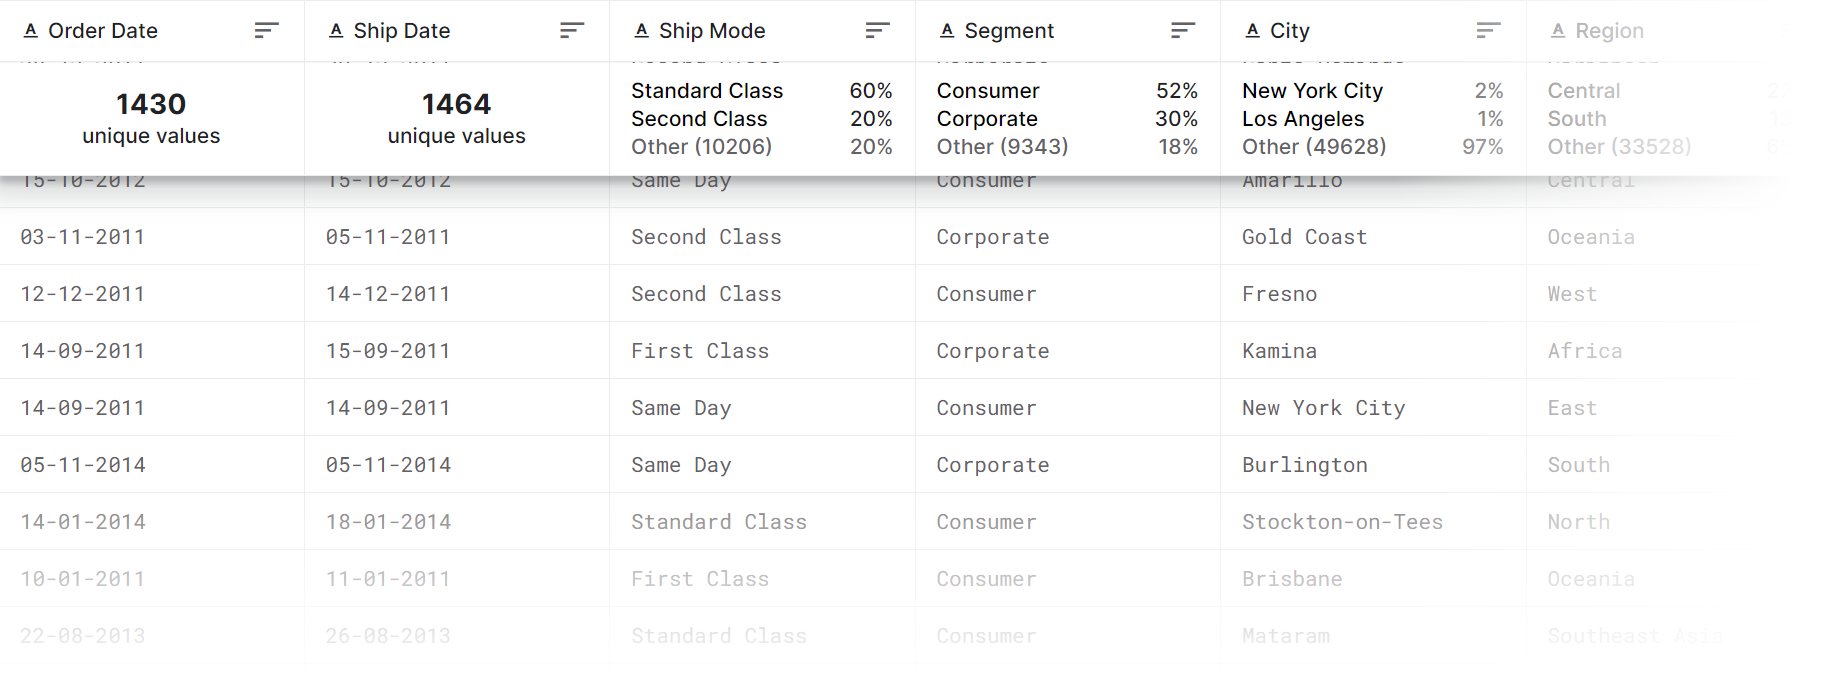
Figure 1. Dataset visualization
There’s also a Service Level Agreement (SLA) signed with a shipping company. The delivery time should be in line with the provisions contained therein:
- Same-day delivery for packages with a “Ship Mode” equal to “Same Day”
- Next-day delivery for “First Class”
- Three-day delivery for “Second Class”
- Five-day delivery for “Standard Class”
Prepare Your Environment and Choose Tools
Use tools supporting the development process, such as Jupyter Notebooks, to facilitate work on the project. The Red Hat OpenShift Data Science UI allows launching such an environment quickly (Figure 2). Intel-optimized software is already integrated. Therefore, creating and managing an environment will be easy.

Figure 2. Creating a Jupyter* Notebook with the Red Hat OpenShift* Data Science interface
Choose an AI framework for the solution. Scikit-learn, a popular open-source ML library, provides a wide range of algorithms for supervised and unsupervised training. The Intel Extension for Scikit-learn improves its performance on Intel® hardware (see Intel Gives scikit-learn the Performance Boost Data Scientists Need). Enabling it inside an Intel AI Analytics Toolkit container is as easy as adding two lines of code:
from sklearnex import patch_sklearn
patch_sklearn()
Our example is based on Red Hat OpenShift Data Science with Intel Extension for Scikit-learn libraries installed. The architecture of the proposed solution is presented in Figure 3.
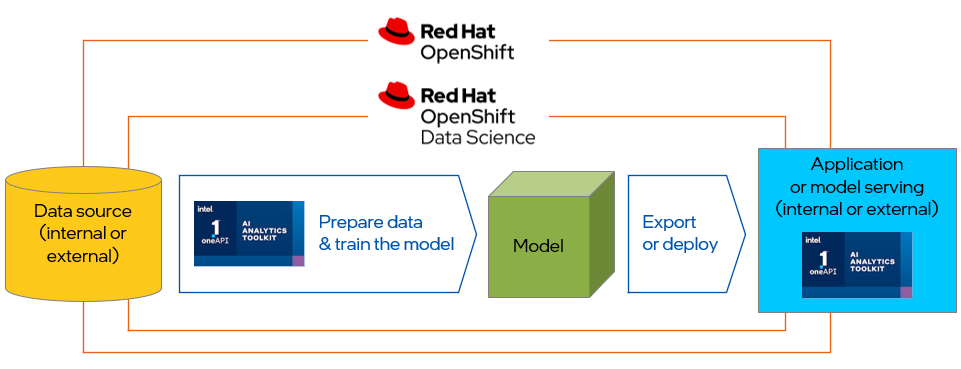
Figure 3. Example solution architecture
Data Preprocessing and Feature Engineering
Having all data collected, decide how to handle them. Preprocessing involves cleaning and formatting the dataset. This may include removing missing values and inconsistencies, dealing with outliers, and scaling the set. Then, decide what features to use during training. Feature engineering involves the selection and transformation of the data into new features. The point is to better represent patterns and relations in the data. In our example, there’s no straightforward answer to our problem. However, knowing the order date, delivery date, shipping mode, and SLA conditions, we can calculate the delay.
First, we read the data and store them in the pandas DataFrame format:
df = pd.read_csv(DATA_PATH, encoding=‘latin-1’, parse_dates=True)
We need to convert the date to a more convenient format, then calculate the delivery time in days:
df[‘Order Date’] = pd.to_datetime(df[‘Order Date’], format="%d-%m-%Y")
df[‘Ship Date’] = pd.to_datetime(df[‘Ship Date’], format="%d-%m-%Y")

df[‘Delivery Time’] = (df[‘Ship Date’] - df[‘Order Date’]).dt.days
Having this data and knowing the SLA, we can calculate the delay. We create a new column with the labels: delayed (1) or on time (0):
df[‘SLA’] = df[‘Ship Mode’].map({
    ‘Same Day’: 0,
    ‘First Class’: 1,
    ‘Second Class’: 3,
    ‘Standard Class’: 5,
})

df[‘Delay in Days’] = (df[‘Delivery Time’] - df[‘SLA’]).map(lambda d: d if d > 0 else 0)

df[‘Delay’] = df[‘Delay in Days’].map(lambda d: 1 if d > 0 else 0)

df[‘Delay’].value_counts()
0 31741
1 19549
Name: Delay, dtype: int64
The “Delay” value is the answer. In this case, there are 31,741 deliveries on time and 19,549 delayed deliveries. The “Delay” column should be used as the target (i.e., the value to predict) during training.
Preparing Data for Training
Previous processes focused on building a collection that contains the necessary features. More operations—like data balancing, categorization, or shuffling—might still be needed to produce a valid model. Then we need to divide the data into training and test sets. In our example, the ratio of delayed to non-delayed deliveries is about 2:3, which is acceptable. However, we must categorize the data:
# what columns should be categorized
CATEGORIZE = [
    ‘Ship Mode’,
    ‘Customer ID’,
    ‘Segment’,
    ‘City’,
    ‘State’,
    ‘Country’,
    ‘Postal Code’,
    ‘Market’,
    ‘Region’,
    ‘Product ID’,
    ‘Category’,
    ‘Sub-Category’,
    ‘Order Priority’,
]

pd_categories = {}

for c in CATEGORIZE:
    pd_categories[c] = pd.Categorical(df[c])
    df[c] = pd_categories[c]
    df[f’{c}-cat’] = df[c].cat.codes

df.head()
Now, we randomly split the data into training and testing sets.
m = np.random.rand(len(pds)) < 0.8

ds_train = pds[m]
ds_test = pds[~m]
Choosing the Best Algorithm
Depending on the problem, a supervised or unsupervised algorithm can be used. It is important to consider the type of data, goal, performance, and accuracy while making this decision. To evaluate and compare algorithms, we can use known metrics, like prediction accuracy or Area Under Curve (AUC). AUC is calculated as the area under the plot of true positive vs. false positive predictions. Therefore, it is always a number between 0 and 1 (higher is better).
We’ll do a quick check to see which algorithm is best for our application. We train and evaluate models from six different classifiers: Gaussian Naive Bayes, Random Forest, Light Gradient Boosting Machine, Decision Tree, Extreme Gradient Boosting, and KNeighbors. For each algorithm, we calculate the mean AUC and time across 20 iterations (Figure 4). The best model for our data is Random Forest, so that’s what we’ll use.
from statistics import mean

NUMBER_OF_ITERATIONS = 20

time_results = {}
roc_auc_results = {}

for _ in range(NUMBER_OF_ITERATIONS):
    models = [
        ("NB",      GaussianNB()),
        ("RF",      RandomForestClassifier()),
        ("lgbm",    lgb.LGBMClassifier()),
        ("Dtree",   DecisionTreeClassifier()),
        ("XGB",     xgb.XGBClassifier()),
        ("KN",      KNeighborsClassifier()),
    ]

    for name, model in models:
        start_time = time()
        kf = KFold(shuffle=True, random_state=7919)
        cv_result = cross_val_score(model, ds_train_features, ds_train_target, cv=kf, scoring="roc_auc")
        stop_time = time()

        mean_cv_results = mean(cv_result)
        print(name, cv_result, mean_cv_results)

        total_t = stop_time - start_time
        try:
            time_results[name].append(total_t)
        except KeyError:
            time_results[name] = [total_t]

        try:
            roc_auc_results[name].append(mean_cv_results)
        except KeyError:
            roc_auc_results[name] = [mean_cv_results]

Figure 4. Results of a quick evaluation
Training
ML training finds patterns in the data that map the input features to the target. The resulting model contains those dependencies, so it can try to predict future values. While developing the solution, depending on the selected algorithm and library, we can change the settings of a training process. Tuning those settings may improve or worsen the model, so it is worth experimenting with different values. In our example, we set the class_weight parameter to compensate for the slight imbalance in the data. Besides that, training with the default parameters gave the best results.
rfc = RandomForestClassifier(
    class_weight={0:2, 1:3}
)

rfc.fit(ds_train_features, ds_train_target)
Validating the Final Model
Validating a ML model is the process of evaluating its accuracy on previously unseen data. It is a crucial step because it enables data scientists to find and fix problems before deploying the model in a real-world setting. Too low or very high accuracy may indicate potential issues, such as too little data, lack of important features, data leakage, or under- or over-fitting. For the basic evaluation, you can use the accuracy and AUC metrics mentioned above. The code we use to start the validation process and collect data is provided below:
ds_test_features = ds_test[FEATURES]
ds_test_target = ds_test[TARGET]

preds = rfc.predict(ds_test_features)
preds_prob = rfc.predict_proba(ds_test_features)[:, 1]

acc_score = accuracy_score(ds_test_target, preds)
auc_score = roc_auc_score(ds_test_target, preds_prob)

print(f’acc: {acc_score} | auc: {auc_score}’)
acc: 0.8664118396550035 | auc: 0.9381309986948686
We achieved an accuracy of about 86%, and the AUC is above 0.93. Your result might vary slightly because of a random factor in the data preparation phase (e.g., shuffling).
We do a sanity check by calculating the baseline for our solution. We simulate a model that answers “0” every time and calculate its accuracy.
accuracy_score(ds_test_target, np.zeros_like(ds_test_target)),
roc_auc_score(ds_test_target, np.zeros_like(ds_test_target))
(0.6153169873986519, 0.5)
The base accuracy is about 62%, so we observe significant improvement compared to the baseline.
We can use charts to visualize the results. One of them is a receiver operating characteristic (ROC) curve. Figure 5 presents the ROC curve for our experiment. As you might have guessed, the area under this curve is the AUC value.
%matplotlib inline

fpr, tpr, thresholds = roc_curve(ds_test_target, preds_prob)

plt.plot(fpr, tpr)
plt.show()
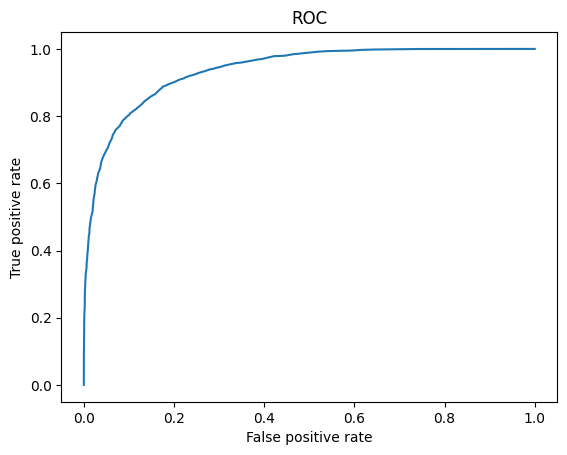
Figure 5. ROC curve for our experiment
We can also visualize what features cause the biggest output changes (Figure 6).
std = np.std([tree.feature_importances_ for tree in rfc.estimators_], axis=0)

forest_importances = pd.Series(importances, index=FEATURES)

fig, ax = plt.subplots()
forest_importances.plot.bar(yerr=std, ax=ax)
fig.tight_layout()
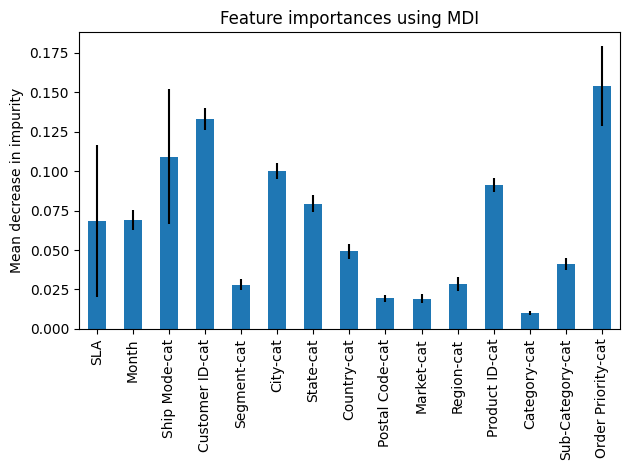
Figure 6. Example feature importance diagram
Running Inference: Simple Usage
For a quick sanity check, try to use the model inside the same Jupyter Notebook. We choose one row from the validation data, and prepare a sample:
INPUT_DATA = {
    ‘Customer ID’:      ’AA-00000’,
    ‘Order Date’:       ‘12-07-2022’,
    # …
    ‘Quantity’:         ‘12’,
    ‘Order Priority’:   ‘Medium’,
}
To use our model, we need to transform input data the same way we did for the training phase. It’s important that we use the same categories that were used during training! For example, if “New York” was mapped to 129, we need to use the same number now.
INPUT_DATA[‘Postal Code’] = float(INPUT_DATA[‘Postal Code’])

input_d = pd.DataFrame(data={k: [v] for k, v in INPUT_DATA.items()})

udf = pd.DataFrame()

# SLA
udf[‘SLA’] = input_d[‘Ship Mode’].map({
    ‘Same Day’: 0,
    ‘First Class’: 1,
    ‘Second Class’: 3,
    ‘Standard Class’: 5,
})

# Month
udf[‘Month’] = pd.to_datetime(input_d[‘Order Date’], format="%d-%m-%Y").dt.month

# Ship Mode-cat
for c in CATEGORIZE:
    try:
        udf[f’{c}-cat’] = pd_categories[c].categories.get_loc(INPUT_DATA[c])
    except KeyError:
        udf[f’{c}-cat’] = -1

udf.head()

Run a prediction:
if_delay = not rfc.predict(udf)[0]
proba_of_delay = rfc.predict_proba(udf)[:, 1][0]
proba_of_delay = (1 - proba_of_delay if if_delay else proba_of_delay) * 100

print(‘We expect’ + (‘ no’ if if_delay else ‘‘) + f’ delay (with probability ~{proba_of_delay:.0f}%)’)
We expect no delay (with probability ~93%)
Concluding Remarks
Entrepreneurs nowadays face difficulties such as broken supply chains, COVID-19-related constraints, and adverse economic conditions. Retailers must make choices at every level of the business process that will affect revenue, competitiveness, or future course of the company’s development. ML can significantly simplify the decision-making process and improve its accuracy. The example presented in this article shows how to detect delays in retail deliveries.
Using techniques and algorithms, based on historical data, companies can create solutions that warn of potential delivery delays. This approach allows us to scan all deliveries quickly and with high accuracy. Problematic orders might be analyzed further. For example, you could try to answer questions such as how long the delay will take, what factors will affect it the most, or which supplier will be able to provide parts or services on time. In further analysis, you can use different algorithms depending on the product, category, or data provided by the supplier and produce multiple models to increase prediction accuracy.
Red Hat OpenShift Data Science and Intel Extension for Scikit-learn are a powerful combination that can be used to improve data science and analytics processes. Thanks to the Jupyter Notebook built into Red Hat OpenShift Data Science with a kernel containing Intel-optimized libraries, preparation of the environment is quick and hassle-free.
The Parallel Universe Magazine
Intel’s quarterly magazine helps you take your software development into the future with the latest tools, tips, and training to expand your expertise.