Introduction
This article provides a number of Memory Bandwidth Monitoring (MBM) example proof points and discussion fitting with the usage models described in previous articles. Prior articles in this series have included an overview of the MBM feature and architecture and usage models. Information software support is briefly discussed in this blog and provided in more detail in subsequent articles.
MBM is part of a larger series of technologies called Intel® Resource Director Technology (Intel® RDT). More information on the Intel RDT feature set can be found here, and an animation illustrating the key principles behind Intel RDT is posted here.
Example Memory Bandwidth Monitoring Proof Points: Intel® Resource Directory Technology Utility from 01.org
An example of the real-time monitoring that MBM provides is available with the Intel RDT utility from 01.org (and GitHub*). This utility works with generic Linux* operating systems to provide per-thread monitoring and control via associating Resource Monitoring IDs (RMIDs) and Classes of Service (CLOS) with each hardware thread. The utility provides an operating mode similar to the Linux Top* utility, which is shown below:
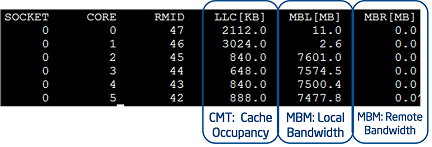
Figure 1: Monitoring output of the Intel® Resource Directory Technology utility from 01.org, including Cache Monitoring Technology and metrics.
As shown in Figure 1, the utility has associated RMIDs 47–42 to cores 0–5 respectively, enabling per-core monitoring. Traditional Cache Monitoring Technology (CMT) readings are provided, indicating that the application on core[0] is currently consuming around 2.1 MB of last-level cache, and the application on core[1] is consuming around 3 MB. The two columns at the far right provide MBM counters, including local and remote bandwidth. Since this example system was running with a single processor, no remote bandwidth is used. On cores 2–5 it is evident that streaming applications are consuming a large amount of memory bandwidth, around 7.5 GB/s each, and these may interfere with other applications running on the system. The Intel RDT utility from 01.org provides real-time visibility and can be used to support telemetry, characterization and noisy neighbor detection usages, or the functionality can be compiled as a library for inclusion in other applications. The code is open source and provided under the BSD license.
Another example of the real-time monitoring capabilities is provided by the AppFormix monitoring suite, which works with containers and VMs and is discussed in the previous usage models article.
Example MBM Proof Points: Real-Time Monitoring with Intel® Performance Counter Monitor and KSysGuard*
As described in the software support blog, the Intel® Performance Counter Monitor (Intel® PCM) tool includes support for CMT and MBM, and can provide readings for analysis, performance debug, profiling and other usages. Notably, an early version of this tool, which will be released soon, can also be integrated with KSysGuard (KDE System Guard) graphical monitoring tool, which provides visualization of the metrics (documentation on the integration process is available in the Intel PCM documentation), and integration with the Windows* performance monitoring tools is also supported.
Once integrated, KSysGuard retrieves monitoring data using the Intel PCM tool as a back-end, and then plots the resulting data. Figure 2 shows an example with CMT, where a number of applications are introduced in the system (with a 35 MB total cache), and as more applications are introduced the cache is shared across more threads, and the cache available for each reduces:
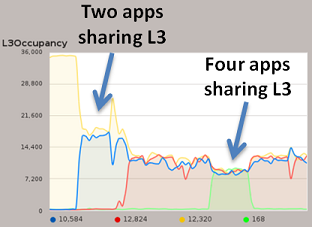
Figure 2: Cache Monitoring Technology occupancy metrics as reported by Intel® Performance Counter Monitor with KSysGuard*. This was an early test version of the software and will be released soon (see text for details).
The addition of MBM support enables memory bandwidth to be monitored; in the same way that more bandwidth-intense applications are added, total memory bandwidth is split across these threads, and this trend can be monitored in real time as shown in Figure 3.
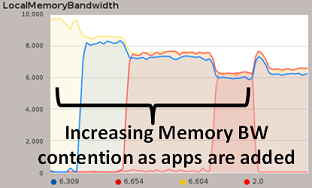
Figure 3: MBM occupancy metrics as reported by Intel® Performance Counter Monitor with KSysGuard*. This was an early test version of the software and will be released soon (see text for details).
MBM provides per-thread bandwidth monitoring as well as attribution of bandwidth into two classes: local and total. These distinct event codes enable improved NUMA-aware scheduling and detecting cross-socket data traffic problems. For instance, in a dual-processor configuration as shown in Figure 4, an application running on core[0] of processor[0] accesses memory on a remote processor, which may incur higher latency than local memory accesses. In the course of scheduling applications such conditions may arise for instance when one socket runs out of memory capacity, and the OS must place the compute threads of an application on a different processor from the memory image. With MBM these cases can be detected and mitigated, for instance migrating the application threads closer to its memory image to reduce cross-processor traffic and latency, which in turn improves performance.
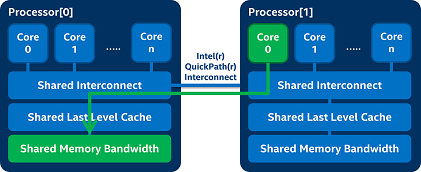
Figure 4: An example of a non-optimal scheduling case, where an application on a core and its memory image are not colocated on the same socket (a non-optimal NUMA scheduling case). The local/total event codes provided by MBM can be used to detect such scenarios so that mitigating action can be taken to improve performance.
As an example of how multi-socket scheduling scenarios can benefit from MBM, Figure 5 shows an example from the perspective of processor[0] in Figure 4. In this case the new application on processor[1] is introduced and begins consuming memory bandwidth, so approximately 5.5 GB/s of bandwidth on processor[0] is used to support the application on processor[1]:
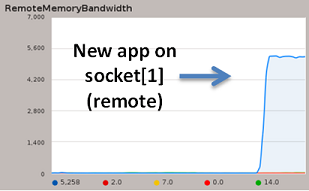
Figure 5: An example of detecting a remote application consuming bandwidth from the local socket, as detected with MBM, and visualized using the KSysGuard* and Intel® Performance Counter Monitor tools. This was an early test version of the software and will be released soon.
With MBM, the OS or VMM scheduler can detect such cases and reschedule the applications in a NUMA-aware way in order to minimize each application’s latency to its data in memory and potentially improve overall performance.
Conclusion
MBM provides new visibility into application resource utilization, enabling enhanced application profiling, telemetry, and techniques such as bandwidth-aware scheduling as discussed in this article. The next article in the series discusses software support, and prior articles in the series are linked at the top of this article.