Introduction
Intel® Advisor is a tool with full automation of Cache Aware Roofline Model (CARM) generation for code characterization which proved to be helpful as unified performance model for domain experts and performance experts in HPC. The performance characterization with a Roofline chart gives user a combined picture plotting application kernels against platform compute and memory peaks. CARM model gives a high-level picture of the fundamental compute or memory limitation for the types of codes used in the application and what are all above roofs that deserve attention. It allows easily to determine clear compute-bound and clear memory-bound codes positioned on the leftmost and rightmost side of the Arithmetic Intensity scale.
Cache Aware Roofline Model (CARM) represents cumulative (L1+L2+LLC+DRAM) traffic-based Arithmetic Intensity for application kernels. Memory movements are extracted by instrumentation, Intel® Advisor looking for instructions moving data to registers. In this design, whether the data is coming from DRAM or any cache level doesn't change anything. Such arithmetic intensity (AI) are invariant for the given code / platform combination. CARM has an affordable overhead (around 7x) but interpretation of results can be challenging for many reason. In order to efficiently interpret a CARM, the user needs to have some deep knowledge about the application. For a given kernel, if the performance is far from the roofline, many reasons can be involved (bottleneck from L2, L3, DRAM, lack of vectorization or poor threading). Then the user must be able to adapt the reading of the CARM based on its application characteristics. Even if CARM can be difficult to interpret in order to optimize an application, it is still a very powerful tool to characterize algorithms on a given platform as arithmetic intensity will be stable across different optimizations of the same algorithm.
The Integrated Roofline Model proposes a more detailed analysis, showing directly where the bottleneck comes from.
Keep in mind that all the features presented in this article are in development and they will evolve across the future version of Intel® Advisor. The processes described in this document are working for Intel® Advisor 2019 Gold release.
How does it work?
For the Integrated Roofline Model, Intel® Advisor collects integrated traffic data for all traffic types using cache simulation: CPU<->Memory subsystem (L1 + NTS memory accesses). L1 cache <-> L2 cache etc. LLC <-> DRAM. Default configuration for caches is borrowed from the analyzed system. And the hits, misses, cache evictions are simulated on all cache levels in the hierarchy. With this data, Intel® Advisor counts the amount of data transfers for a given cache level and compute specific AI for each loop and each memory level. This analysis step is time costly and in order to reduce the overhead, Intel® Advisor doesn't simulate the overall cache system. The simulation is only realized on a subset of the whole cache. After the simulation, Intel® Advisor extrapolates the results for the whole cache.
By observing the changes of this traffic from one level to another and comparing it to respective roofs representing the best possible bandwidths for these levels, it is possible to pinpoint the memory hierarchy bottleneck for the kernel and determine optimization steps based on this information.
 An advantage of Integrated Roofline model is that each loop can be observed at different cache level and arithmetic intensities can be compared to understand where performance drop appears. However, cache simulation introduces greater slowdown in the analysis compared to default CARM model.
Running Integrated Roofline analysis in Intel® Advisor

Turn on the experimental capability for getting Integrated Roofline in Intel® Advisor by setting environmental variable ADVIXE_EXPERIMENTAL=int_roofline. Intel® Advisor experimental Integrated Roofline feature estimates memory traffic distribution for each loop and function based on cache simulation technology. After setting the experimental variable and launching the GUI, the cache simulation is enabled in the GUI by checking the appropriate checkbox in the Trip Counts section of the Intel® Advisor project properties, where an entry field is also provided for cache configurations.
On the command line, it is required to add the -enable-cache-simulation flag during a trip counts analysis (as well as exporting ADVIXE_EXPERIMENTAL=int_roofline). Configurations can be specified using the -cache-config=yourconfighere flag. When no specific cache configuration set, Intel® Advisor will use system caches hierarchy for the modeling. But optionally it can be set to simulate a specific cache configuration. The format for a configuration is the specifications for each cache level, strung together with slashes, starting with level 1. The same format is used in GUI and CLI interfaces for setting cache hierarchy. Each level’s specification is formatted as count:ways:size.
For example, 4:8w:32k/4:4w:256k/16w:6m is the configuration for
- four eight-way 32KB level 1 caches
- four four-way 256KB level 2 caches
- sixteen-way 6MB level 3 cache
Note that the number of sets in every cache should be multiple of 64 (this is also a hardware limitation).
These advanced settings open up a whole bunch of new possible analyses for studying application memory traffic distribution for different memory hierarchies on some future hardware.
Using these settings now you should be able to run a Roofline analysis in CLI and GUI. For GUI analysis choose Run Roofline button on the Workflow window. Use the command line similar to the following for CLI analysis:
advixe-cl –collect roofline -enable-cache-simulation -- application_executable
For the applications with complex launching scripts and other setup required, it is not always possible to use the shortcut command “-collect roofline”. Also, this command may not be used to collect data on Intel® MPI applications; the Survey and FLOPS must be collected separately. Here is the commands sequence used to get the Integrated Roofline data with two analyses runs of Survey and FLOPS:
advixe-cl -collect survey -project-dir MyResults – application_executable
advixe-cl -collect tripcounts -enable-cache-simulation -flop -project-dir MyResults -- application_executable
Example command lines for performing Integrated Roofline analysis on Intel® MPI application:
mpirun -n 1 -gtool "advixe-cl -collect survey -project-dir MyResults:0" application_executable
mpirun -n 1 -gtool "advixe-cl -collect tripcounts -enable-cache-simulation -flop -project-dir MyResults:0" application_executable
Review the results: traffic, bandwidth, loads and stores in Roofline and Loop Analytics
Integrated Roofline analysis based on cache simulation provides the following useful metrics for application memory behavior. The underlying ideas of this analysis are described in the following scholar paper developed in collaboration between leading institutes and the US national laboratories and the industry “A Novel Multi-Level Integrated Roofline Model Approach for Performance Characterization”.
Loop analytics in the integrated Roofline
For a single loop, it is possible to get detailed statistics such as related compute operations, operations per second, Arithmetic Intensity (Flop related section) or the data transfers for the loop, its instances and iterations (Data Transfers and Bandwidth section). Reviewing exact simulated traffic numbers between different memory levels.

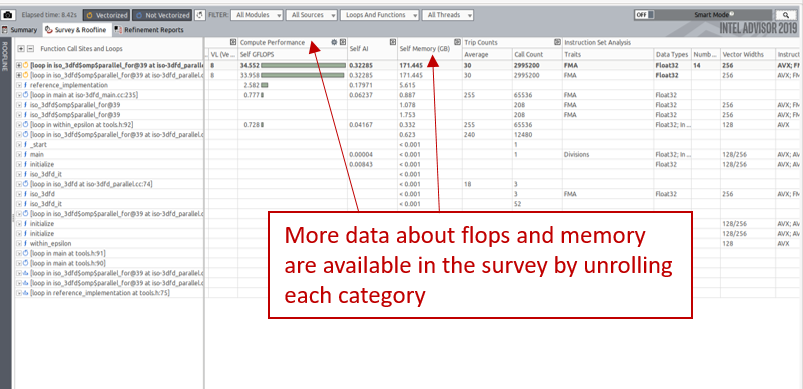
More data, specific to each kernel are also available from the survey grid as shown on the next picture. It is for example possible to display the amount of data loaded in L2, stored in L3, etc.
Interpreting the results
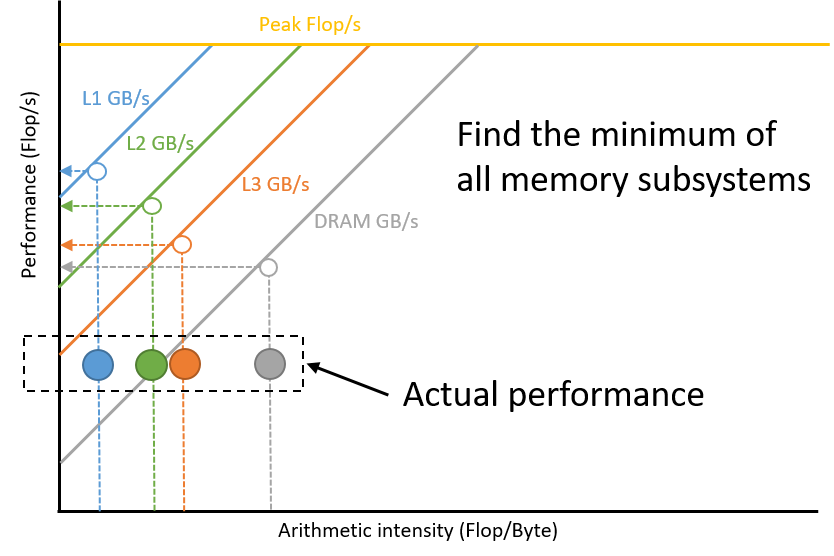
Finding what is your current performance upper bound can be done by looking at each memory subsystem and projecting the arithmetic intensity on the appropriate roofline. The upper bound performance is the minimum of all your projections. This step has not been implemented in Intel® Advisor yet but it is possible to do it by looking at the Roofline model as shown in the next picture. Better performance can still be obtained by optimizing the memory accesses on the memory subsystem limiting your performance. For example, if your limitation comes from the DRAM, optimizing the transfers between DRAM and L3 will increase the DRAM arithmetic intensity.
Display Integrated Roofline data
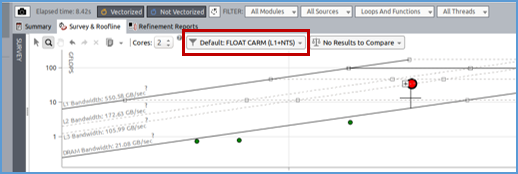
The Integrated Roofline allows to display several dots for a single kernel based on which memory level the data transfers are observed. It is possible to select a specific memory level in the GUI by clicking on the select box highlighted in red in the next picture.
Then, you can select which memory subsystem to use for computing the arithmetic intensity of your kernels.
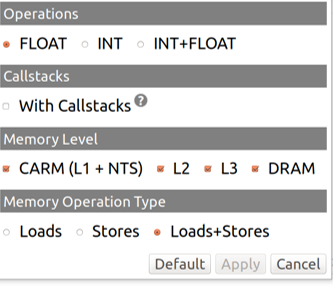
It is possible to display several dots per kernel, each one having its AI computed using the traffic of different cache levels.
Comparing the different arithmetic intensity for a single kernel based on different cache level can bring interesting information as explained in the next section.
As requesting different cache levels at the same time usually make visualization more complex, it is possible to filter only on the desired kernel. This can be done by right clicking on one kernel and pressing "Filter in Selection". When doing this manipulation, Intel® Advisor will only show data related to the kernel you selected. To remove the filtering, right click on the Roofline model and click on "clear filters".
Observing carefully the Integrated Roofline Model can highlight some bottleneck.
Potential vectorization or threading improvements
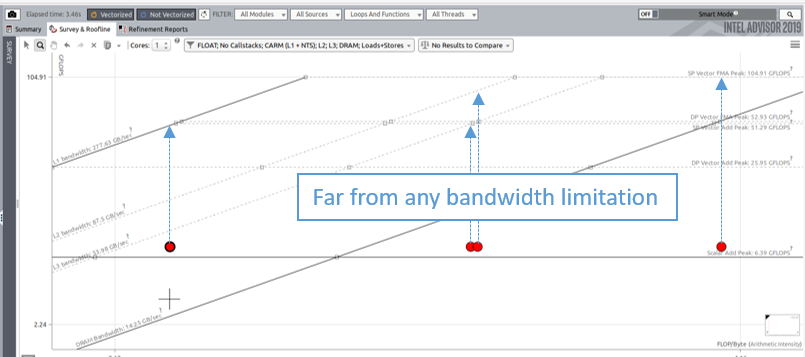
The following image demonstrate a problem related to vectorization or threading. When all dots from a single kernel are far enough from their respective bandwidth limitation, it usually means that some improvement can be done regarding the threading or the vectorization. In the case of vectorization, Intel® Advisor's survey should give additionnal details on how to get a more efficient vectorization.
Cache blocking based optimization
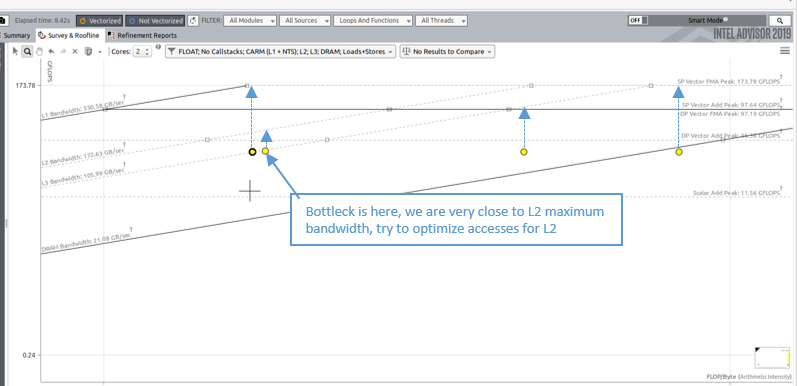
The integrated roofline model allows to detect cache problems in your application. It is even possible to detect which cache level is behaving as a bottleneck. The following picture gives an example of performance limited by accesses of data on the L2. Improving the arithmetic intensity for this dot will give more space to get a better performance. This change in L2 arithmetic intensity can be done by implementing cache blocking with sizes that advantages data reusage from L1 (for this example).
The overall guidance for possible memory optimizations inspired by Integrated Roofline data is shown in the table. More details on the loop blocking technique can be found in the article “How to Use Loop Blocking to Optimize Memory Use on 32-Bit Intel® Architecture“.
| Maximizing L1 Performance |
Maximizing L2 Performance |
Maximizing L3 Performance |
Maximizing DRAM Performance |
| Usually, being close to the CARM roofline means that your algorithm is fully optimized and that any new optimization will not bring any performance boost (CARM) |
Increase L2 AI by optimizing cache blocking for L1 |
Increase L3 AI by optimizing cache blocking for L2 |
Improve data access (unit stride), Improve L3 Cache blocking |
Keep in mind that not all codes allow efficient loop blocking or tiling for better filling the caches.
Inefficient access patterns
When running the Integrated Roofline Model and displaying all the cache levels at the same time for a single kernel, you should see from left to right
- CARM arithmetic intensity
- L2 arithmetic intensity
- L3 arithmetic intensity
- DRam arithmetic intensity
This left to right order (CARM, L1, L2, L3, DRAM) might not be respected if your application has inefficient memory accesses. In that case, L2 dot could be on the left hand side compared to the CARM one. For example, in the case where you are doing random memory accesses, for every access in the L1, if the data is not in the cache, a full cache line needs to be stored in the L1. In the case where you only use a single element in this cache line, you are expecting to count more data transfer between your L1 and L2 than what you will do in your registers. If you observe this behavior in the integrated roofline model, it is possible to identify the type of memory access you are doing by running the Memory Access Pattern Analysis (MAP) from Intel® Advisor.
A strong usage of Non Temporal Store (NTS) can also result in a different order in the memory subsystems arithmetic intensity (see dedicated section).
Non Temporal Stores
Before writing a data in a cache line, the processor needs to read it to maintain cache consistency. In some cases, the read is not necessary when we know that the data meant to be written is not going to be used in a close future. In that case, the compiler can generate non-temporal stores. Then, instead of writing the data in a cache line, the data is directly written to the memory. Usage of NTS also modify aritmetic intensity for the different memory subsystems. Writing the data is not seen at the cache level but only on the CARM and DRAM level. This can result in a DRAM AI lower than the L3 AI for example.
Based on your kernels, Advisor might recommend to use NTS. This can usually be seen in the recommendation section.
Conclusion
Analyzing how hot loops and functions utilize the whole memory hierarchy is a non-trivial programming task that can be solved with some statistical observation (counting, sampling) or simulations techniques. For many codes, like all codes with medium and low Arithmetic Intensity on the AI scale it is crucial to know how specific parts of code are using memory subsystem to determine the optimization strategies. A useful addition to existing Intel® Advisor Roofline is the experimental Integrated Roofline feature estimating the memory traffic between all memory levels in the current hardware or possible future hardware memory hierarchy. This powerful tool allows users to determine what are the exact memory bottlenecks worth tacking in the code