Quartus® Prime Pro Edition User Guide: Timing Analyzer
2.5.6. Report Clocks and Clock Network
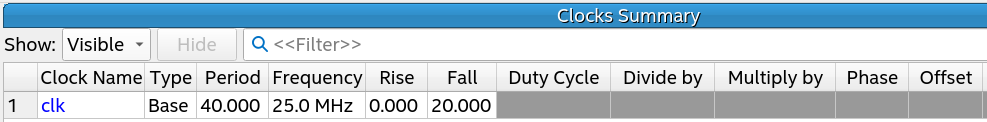
Report Clocks generates the Clock Summary report that lists details about all of the signals with clock setting constraints in the design.
Similarly, you can click the Reports > Clocks > Report Clock Network... command to generate a custom report that helps you identify and evaluate advanced clock structures, such as clock muxes, clock gates, and clock dividers.
| Option | Description |
|---|---|
| Report target | Specifies the collection of clocks and nodes that you want to analyze and report. |
| Expand clock path | Displays all subordinate nodes in expanded view. The default display collapses trivial nodes in the report. |
| Include potential clock paths | Includes nodes in the report that are not on a clock path, but are upstream of a register clock port. |
| Report panel name | Specifies the name that appears in the report panel title bar. |
| File name | Specifies the name of an optional output file to contain report data. |
| Tcl command | Displays the Tcl syntax that corresponds with the GUI options you select. You can copy the command from the Console into a Tcl file. |
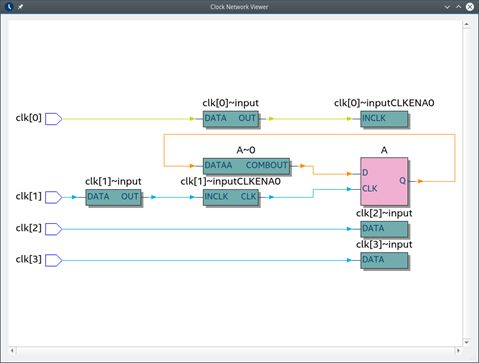
This report shows the nodes on the clock network hierarchically, starting from the input clock ports, followed by any other nodes that transform or route the clocks to the clock loads. The Join Points indicate whether the clock network has convergence, such as with clock muxes. The Statistics Table provides more details about the signals that you select in the report, such as the relationships between the incoming and outgoing clocks of this node.
The Schematic View tab displays a graphical representation of the clock domains. Use this graphical view to determine which clocks drive portions of the design. The color for each clock connection edge indicates the clock types. To identify the clock types for each color, right click on any signal to display the Color Legend.
The display shows a truncated signal name by default. Hover the mouse over the clock signals to display the full signal name. Click the Zoom controls to view more detail. You can export the schematic view as a PDF from the right-click menu.
You can also right-click and choose Report Paths from Node, Report Paths Thru Node, Report Paths To Node, or Focus On Node to rerun the report on the selected node.