Quartus® Prime Pro Edition User Guide: Timing Analyzer
ID
683243
Date
12/04/2025
Public
1.1.1. Timing Path and Clock Analysis
1.1.2. Clock Setup Analysis
1.1.3. Clock Hold Analysis
1.1.4. Recovery and Removal Analysis
1.1.5. Multicycle Path Analysis
1.1.6. Metastability Analysis
1.1.7. Timing Pessimism
1.1.8. Clock-As-Data Analysis
1.1.9. Multicorner Timing Analysis
1.1.10. Time Borrowing
2.1. Using Timing Constraints throughout the Design Flow
2.2. Timing Analysis Flow
2.3. Applying Timing Constraints
2.4. Timing Constraint Descriptions
2.5. Timing Report Descriptions
2.6. Scripting Timing Analysis
2.7. Using the Quartus® Prime Timing Analyzer Document Revision History
2.8. Quartus® Prime Pro Edition User Guide: Timing Analyzer Archive
2.4.4.5.1. Default Multicycle Analysis
2.4.4.5.2. End Multicycle Setup = 2 and End Multicycle Hold = 0
2.4.4.5.3. End Multicycle Setup = 2 and End Multicycle Hold = 1
2.4.4.5.4. Same Frequency Clocks with Destination Clock Offset
2.4.4.5.5. Destination Clock Frequency is a Multiple of the Source Clock Frequency
2.4.4.5.6. Destination Clock Frequency is a Multiple of the Source Clock Frequency with an Offset
2.4.4.5.7. Source Clock Frequency is a Multiple of the Destination Clock Frequency
2.4.4.5.8. Source Clock Frequency is a Multiple of the Destination Clock Frequency with an Offset
2.5.1. Report Fmax Summary
2.5.2. Report Timing
2.5.3. Report Timing By Source Files
2.5.4. Report Data Delay
2.5.5. Report Net Delay
2.5.6. Report Clocks and Clock Network
2.5.7. Report Clock Transfers
2.5.8. Report Metastability
2.5.9. Report CDC Viewer
2.5.10. Report Asynchronous CDC
2.5.11. Report Logic Depth
2.5.12. Report Neighbor Paths
2.5.13. Report Register Spread
2.5.14. Report Route Net of Interest
2.5.15. Report Retiming Restrictions
2.5.16. Report Register Statistics
2.5.17. Report Pipelining Information
2.5.18. Report Time Borrowing Data
2.5.19. Report Exceptions and Exceptions Reachability
2.5.20. Report Bottlenecks
2.5.21. Check Timing
2.5.22. Report SDC
2.5.23. Design Closure Summary
3.1.1. CDC Timing Overview
3.1.2. Identifying CDC Timing Issues Using Design Assistant
3.1.3. Identifying CDC Timing Issues Using Timing Reports
3.1.4. Debug CDC Example 1—Incorrect SDC Definition
3.1.5. Debug CDC Example 2—Additional Logic in the Crossing
3.1.6. Debug CDC Example 3—CDC Depending on Two Simultaneous Clock Domains
2.5.20. Report Bottlenecks
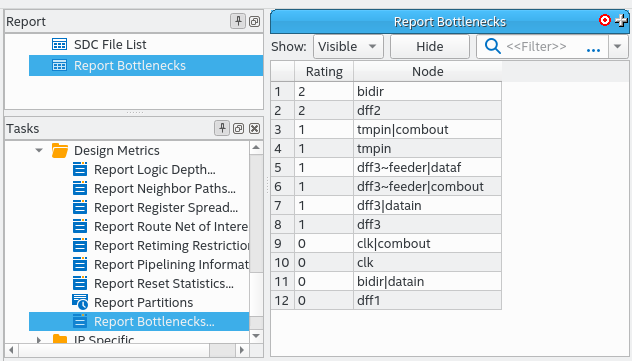
You can run the Timing Analyzer's Reports > Design Metrics > Report Bottlenecks... command to list all nodes in a design ranked by specified criteria. The equivalent scripting command is report_bottleneck.
The following ranking criteria are pre-defined:
- num_fpaths—the number of paths that fail timing through a node.
- num_fanins—the number of fan-in edges from a node.
- num_fanouts—the number of fan-out edges from a node.
- num_paths—the number of paths through a node.
- tns—the total negative slack of all the paths through a node.
When using scripting, you can specify the paths for analysis by passing the result of any get_timing_paths call as the last argument to report_bottleneck. When using the GUI, the Report Bottlenecks dialog box handles this argument automatically. If you specify no paths, report_bottleneck analyzes the worst 1000 setup paths in the design by default.
You can direct the report output to the Tcl console (-stdout), the Timing Analyzer GUI (-panel), or to a combination of console and GUI.
Figure 189. Report Bottlenecks Rated on Number of Failing Paths Through a Node