Get Started with Intel® Advisor
Use Intel® Advisor to make sure your C, C++, Fortran, OpenMP*, SYCL, Python*, or OpenCL™ application realizes full performance potential on modern processors. You can download the Intel Advisor as:
After you download and install the Intel Advisor, start with Before You Begin instructions to launch the tool and set up the environment. Continue to run Intel Advisor perspectives to analyze your code.
In the Intel Advisor, a perspective is a predefined analysis workflow enabled by multiple profiling steps and options and represented as a specific data layout optimized to solve a problem. Depending on your analysis goal, you can follow one or more of the perspectives to understand application performance and identify bottlenecks.
This document summarizes typical Intel Advisor workflows to optimize application performance. You can analyze your code from the following perspectives:
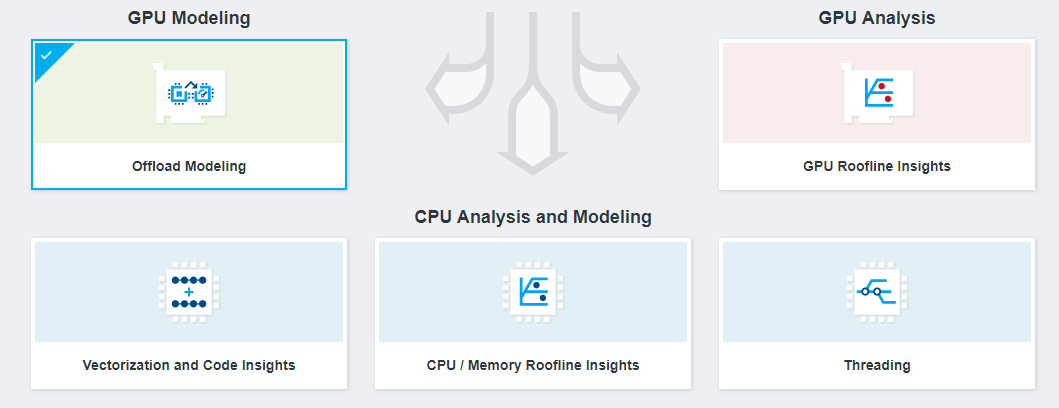
Vectorization and Code Insights
Find unvectorized and under-vectorized loops and functions in your application and get code-specific recommendations for how improving application performance with vectorization. This includes applying single instruction multiple data (SIMD) instructions, such as Intel® Advanced Vector Extensions and Intel® Advanced Vector Extensions 512, on multiple data objects to run in parallel within a single CPU core. You can analyze a C, C++, Fortran, OpenMP, or mixed Python application.
See Discover Where Vectorization Pays Off The Most for quick-start workflow with a sample application.
CPU/Memory Roofline Insights
Visualize your application performance against CPU limitations as a Roofline chart to see how well your application uses hardware resources, what is the main limiting factor, and what are the optimization candidates. You can analyze a C, C++, Fortran, OpenMP, or mixed Python application.
See Identify Performance Bottlenecks Using CPU Roofline for quick-start workflow with a sample application.
Offload Modeling
For an application running on a CPU, determine if your application can benefit from porting to a GPU, identify the most profitable offload opportunities and potential bottlenecks. You can analyze a C, C++, Fortran, SYCL, OpenCL application, or an application with OpenMP target pragmas.
For an application running on a GPU, determine if your application can get speedup from running on a different next-generation GPU and identify potential bottlenecks. You can analyze a SYCL, OpenCL application, or an application with OpenMP target pragmas.
See Identify High-impact Opportunities to Offload to GPU for quick-start CPU-to-GPU workflow with a sample application.
GPU Roofline Insights
Profile a GPU application and visualize kernel performance against GPU limitations as a Roofline chart to identify the main bottlenecks and limiting factor, get recommendations to optimize performance on GPU. You can analyze a SYCL, OpenCL application, or an application with OpenMP target pragmas.
See Measure GPU Performance Using GPU Roofline for quick-start workflow with a sample application.
Threading
Prototype different threading design options and project scaling on systems with larger core counts for your application without disrupting development and find performance issues to fix them before implementing parallelism. You can analyze a C, C++, or Fortran application.
See Prototype Threading Designs for quick-start workflow with a sample application.