Introduction
You need good data to make good design decisions. What loops should be threaded and vectorized first? Is the performance gain worth the effort? Will the threading performance scale on larger core counts? Does this loop have a dependency that prevents vectorization? What are the trip counts and memory access patterns? Have you vectorized efficiently with the latest Intel® Advanced Vector Extensions 512 (Intel® AVX-512) instructions? Or are you using older SIMD instructions? Intel® Advisor is a dynamic analysis tool that answers all of these questions and a great many more. Using Intel Advisor you can collect some insightful program metrics on vectorization and memory profile of your application. Now, in addition to using our tailored reports using our GUI and command-line, you now have the added flexibility to mine our collected database and create powerful new reports using Python.
When you run Intel Advisor it stores all of the data it collects in a proprietary database. You can now access this database using our new Python API. We have provided several reference examples on how to use this new functionality. The API provides a flexible way to report on useful program metrics (Over 500 metric elements can be displayed). This article will describe how to use this new functionality.
Getting Started
To get started, you first need to setup the Intel Advisor environment.
> source advixe-vars.sh
Next, to setup the Intel Advisor database, you need to run some collections. Some of the program metrics require additional analysis such as tripcounts, memory access patterns and dependencies.
> advixe-cl --collect survey --project-dir ./your_project -- <your-executable-with-parameters>
> advixe-cl --collect tripcounts -flops-and-masks -callstack-flops --project-dir ./your_project -- <your-executable-with-parameters>
> advixe-cl --collect map –mark-up-list=1,2,3,4 --project-dir ./your_project -- <your-executable-with-parameters>
> advixe-cl --collect dependencies –mark-up-list=1,2,3,4 --project-dir ./your_project -- <your-executable-with-parameters>
Finally you will need to copy the Intel Advisor reference examples to a test area.
cp –r /opt/intel/advisor_2018/python_api/examples .
Using the Intel Advisor Python API
The reference examples we have provided are just small set of the reporting possible using this flexible way to access your program data. The file columns.txt provides a list of the metrics we currently support.
Intel Advisor Python API in Action
Intel Advisor Python API Reference Examples
Here is some examples that we provide as part of the Intel Advisor Python API:
- Generate a combined report showing all data collected
python joined.py ./your_project >& report.txt - Generate an html report
python to_html.py ./your_project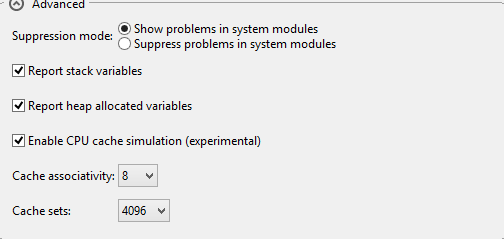
- Generate a Roofline html chart
python roofline.py ./your_project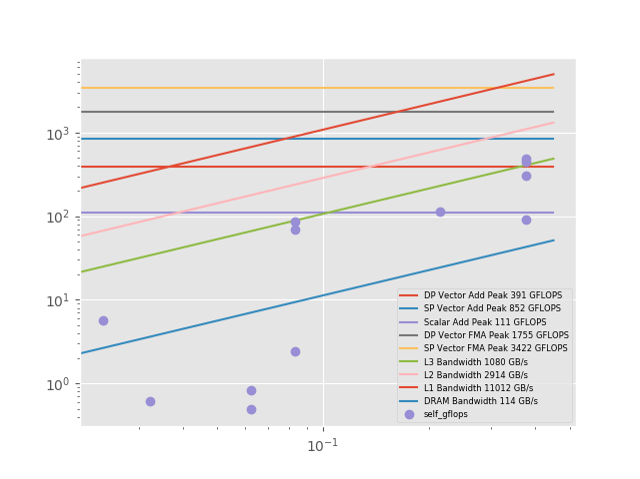
- Generate cache simulation statistics
Before doing your data collection set the following environment variable: export ADVIXE_EXPERIMENTAL=cachesim- You need to do a memory access pattern collection to collect cache statistics
advixe-cl --collect map –mark-up-list=4 --project-dir ./your_project -- <your-executable-with-parameters> - Setup cache collection in Project properties
- cache.py ./your_project
- You need to do a memory access pattern collection to collect cache statistics
Summary
On modern processors, it is crucial to both vectorize and thread software to realize the full performance potential of the processor. The new Intel Advisor Python API provides a powerful way to generate program statistics and reports that can assist you in getting the most performance out of your system. The provided examples outlined in this article gives a framework for showing the power of this this new interface. Based upon the individual user needs, you can tailor these examples and extend them.