Software correctness tools should be a core component of any Quality Assurance (QA) program, and Intel® Inspector provides functionality your QA department can use to simplify getting the answers it needs.
Dynamic Analysis for QA
Dynamic analysis is the term that encompasses both memory checking and thread checking in the Intel Inspector. Use memory checking to look for memory leaks, memory corruption, allocation/deallocation mismatches, and inconsistent memory API usage, among other checks. Use thread checking to find data races (both heap and stack), deadlocks, and thread and sync API errors in threaded code.
Dynamic analysis only tests the portions of an executable that are actually invoked. Intel Inspector thread and memory checking tools can spot errors that could happen in an executed section of code whether or not they actually happen in this particular run. These tools cannot report any errors in code that was not executed.
Tactics for Managing Analysis Overhead
Data set size has a direct impact on target execution time and analysis speed.
For example, it takes longer to process a 1000x1000 pixel image than a 100x100 pixel image. One reason for this is that you have loops with an iteration space of 1-1000 for the larger image, but only 1-100 for the smaller image. Identical code paths may be executed in both cases; the difference is the number of times these code paths are repeated.
You can control analysis cost, without sacrificing completeness, by removing this kind of redundancy from your target. Instead of choosing large, repetitive data sets, choose small, representative data sets.
Data sets with runs in the time range of seconds are ideal. You can always create additional data sets to ensure all your code is inspected, or use existing unit tests to execute sections of code in an understood fashion. When selecting your data sets, focus on code coverage in breadth, not in depth. You want to execute different paths through your code, but the specific values of variables on those paths are not important.
There are other changes you can make to reduce analysis cost, including lowering the number of threads used. For more information about things you can do to control analysis cost, see Controlling Analysis Cost.
Reporting Information about New Issues Only
Regardless of what type of analysis you're doing, you need a way to focus on new issues in your code. There are two options Intel Inspector provides for getting that information. To use these methods, you need a known baseline result.
For optimal usage, of course, the baseline result should be taken from a run where you have successfully eliminated all real problems. Anything left is a positive you have determined you can just ignore. For example, you may have more than one thread accessing a variable without synchronization in between, so the thread checking tool finds a race, but you may know there are other timing factors that make it impossible for a race to occur. Alternatively, there could be an issue in a third-party library that is of no interest to you.
The baseline result could be generated on a per-data-set basis or one baseline for the entire product, depending on the method used to find only new issues. The baseline result should be generated using the same analysis level you plan to use for your testing (that is, if you plan to use a level 1 memory analysis, the baseline should also be a level 1 memory analysis, etc).
There are three different ways to use the Intel Inspector to focus in on new issues:
- Suppress all
- Filter by state
- Results comparison
Suppress-all
Suppress-all functionality is only available through the command line interface (CLI). Take the baseline result for this data set and run the following command:
inspxe-cl -create-suppression-file mySupThis creates a suppression file called mySup that contains a suppression rule to suppress every error in the most recent result. This file can be used from the CLI or the GUI.
The best way to do this is to create a different suppression file for each data set you might use to test your program. However, you can also put all of those suppression files into one directory and tell Intel Inspector to use that directory to simplify your scripts. Loading too many suppressions may slow finalization of your data, so be sure to clean out any old suppression files and generate new ones if previously known issues are removed.
Filter by State
The filter-by-state method is available in the GUI or the CLI. Intel Inspector, by default, compares every new run of a project to the previous run and sets the state on any issue not in the previous run to New.
If you are using this for regression testing, you will want separate directory/project for each data set you plan to test and each needs its own baseline result. Intel Inspector will automatically use the previous result when bringing forward states. You will need to set the configuration to specify the correct baseline result before collection.
If you are using the GUI integrated into Visual Studio*, from the Visual Studio* menu, choose Tools > Options.... In the Options dialog box, expand the Intel Inspector <version> folder and choose the State Management page.
If you are using the Standalone Intel Inspector XE GUI, choose File > Options.... In the Options dialog box, choose the State Management page.
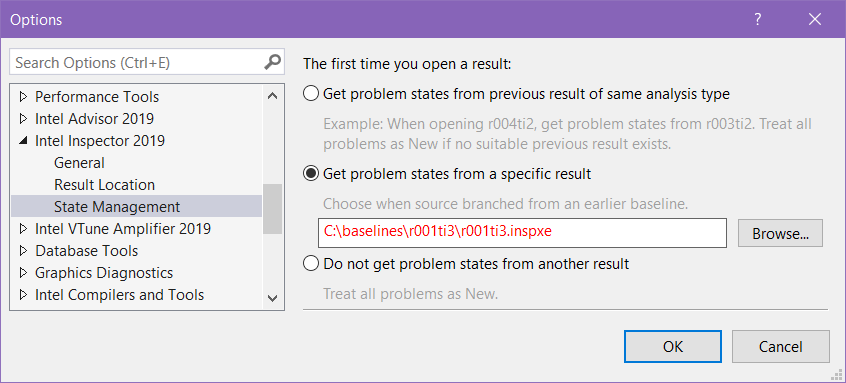
Select the "get problem states from a specific result" radio button and enter the path to the baseline results file. Once this is done you can rerun in this project and it will always use this same results file.
If you are using the CLI for your regression analysis, you will need to use the –baseline-result option to point to the correct baseline:
inspxe-cl -collect mi3 -baseline-result r000mi3 -result-dir r001mi3 -- ./a.outThis example collects an mi3 run on a.out, storing it in r001mi3, and using r000mi3 as the baseline result for bringing states forward.
After running, you can use the GUI Filters pane to display just the New issues, or you can take advantage of CLI reporting to report out only the issues in the New state:
inspxe-cl -report statusThis command generates a status report, including state of all issues, useful for determining if there are any New issues.
inspxe-cl -report problems -f state=new This command generates a report of problems in the New state.
Results Comparison
Results comparison is available using the Compare button in the GUI. This allows you to enter two results and get a report containing all the issues in both results and whether each problem was found in the first result only, the second result only, or both results. You can then filter to limit to the results in the new run only, and export a report based on that.
You can achieve the same outcome in the CLI by asking for a report for two results at the same time:
inspxe-cl -R summary -r myRes000ti -r myRes001t1This command provides a summary report of the results comparison of the previously collected results found at myRes000ti and MyRes001t1
This requires you to have a baseline result for each data set you are using in your testing, although you do not need a project for each data set.
Choosing the Best Option
The suppression file for suppress-all is generated once for each data set and then that file can be used and copied wherever you want, or all of your suppressions can be co-located. However suppression of a large number of known issues can cause performance degradation.
Using compare is faster; however, it requires a separate baseline result for each data set you are using with your application.
Filtering by state is by far the fastest, as bringing forward states is already part of the default finalization; you are just choosing a baseline to bring the states from. Filtering by state, in the CLI or in the GUI, requires a separate baseline result for each data set you are using with your application.
In most cases, filter by state is probably the best option. If having a separate baseline per dataset is a problem for you, you will probably have to move to suppress-all.
Using the Command Line Interface to Automate Testing
Intel Inspector must execute your code path to find errors in it. Thus, you should run Intel Inspector on multiple versions of your code, on different workloads that stress different code paths, and on corner cases. The most effective way to do this is to run your application under Intel Inspector multiple times with different data sets passed in as arguments. Using batch processing on the CLI can simplify collecting all this data.
Furthermore, given the inherent time dilation that comes with code-inspection tools, it is more efficient to run these tests overnight or as part of your regression testing suite and have the computer do the work for you; you just examine the results of multiple tests in the morning. Reports from the CLI can be exported in a number of parse-friendly formats, making it easier to generate automated mailings or write scripts to run on the resultant data.
To get help on the Intel Inspector CLI, run the command inspxe-cl -help and see more information in our installed and online help.
Conclusion
Quality assurance is a vital step in the production of any software used by external customers or internal customers. Intel Inspector has the right functionality and features to help you collect the QA correctness information you need. Using Intel Inspector's features correctly and choosing your data sets wisely helps you produce the best results. Taking advantage of suppression and filtering functionality can help you focus on addressing new issues, particularly in an automated testing environment.