Introduction
Intel® Graphics Performance Analyzers (GPA) offers a wide range of tools to analyze graphics applications across diverse workloads, platforms, and graphics APIs. Within Intel® GPA you can use Graphics Frame Analyzer to identify and analyze problem areas in your applications to resolve GPU performance regressions. This article will dive deep into fundamental stream capture capabilities that can be configured in Graphics Monitor to aid in the future analysis of stream files in the multi-frame view of Graphics Frame Analyzer. Topics covered in this article can be visualized in video format in the Configure and Capture Streams Deep Dive video, by checking reference markers in the images associated with this article.
Pre-requisites
Before proceeding with this article, ensure you have the minimum system requirements to successfully analyze graphics applications using Intel® GPA. Also make sure you have downloaded and installed Intel® GPA on your host platform.
Configuring Stream Captures
Streams are continuous sets of frames which can be used to analyze issues like sporadic drops in the Frames per Second of your application. You can view stream capture options by pressing the Options button to go into the settings of the tool, and then by pressing the Stream tab. Pressing the toggle button next to each of these options will allow you to enable or disable them based on your specific use case.
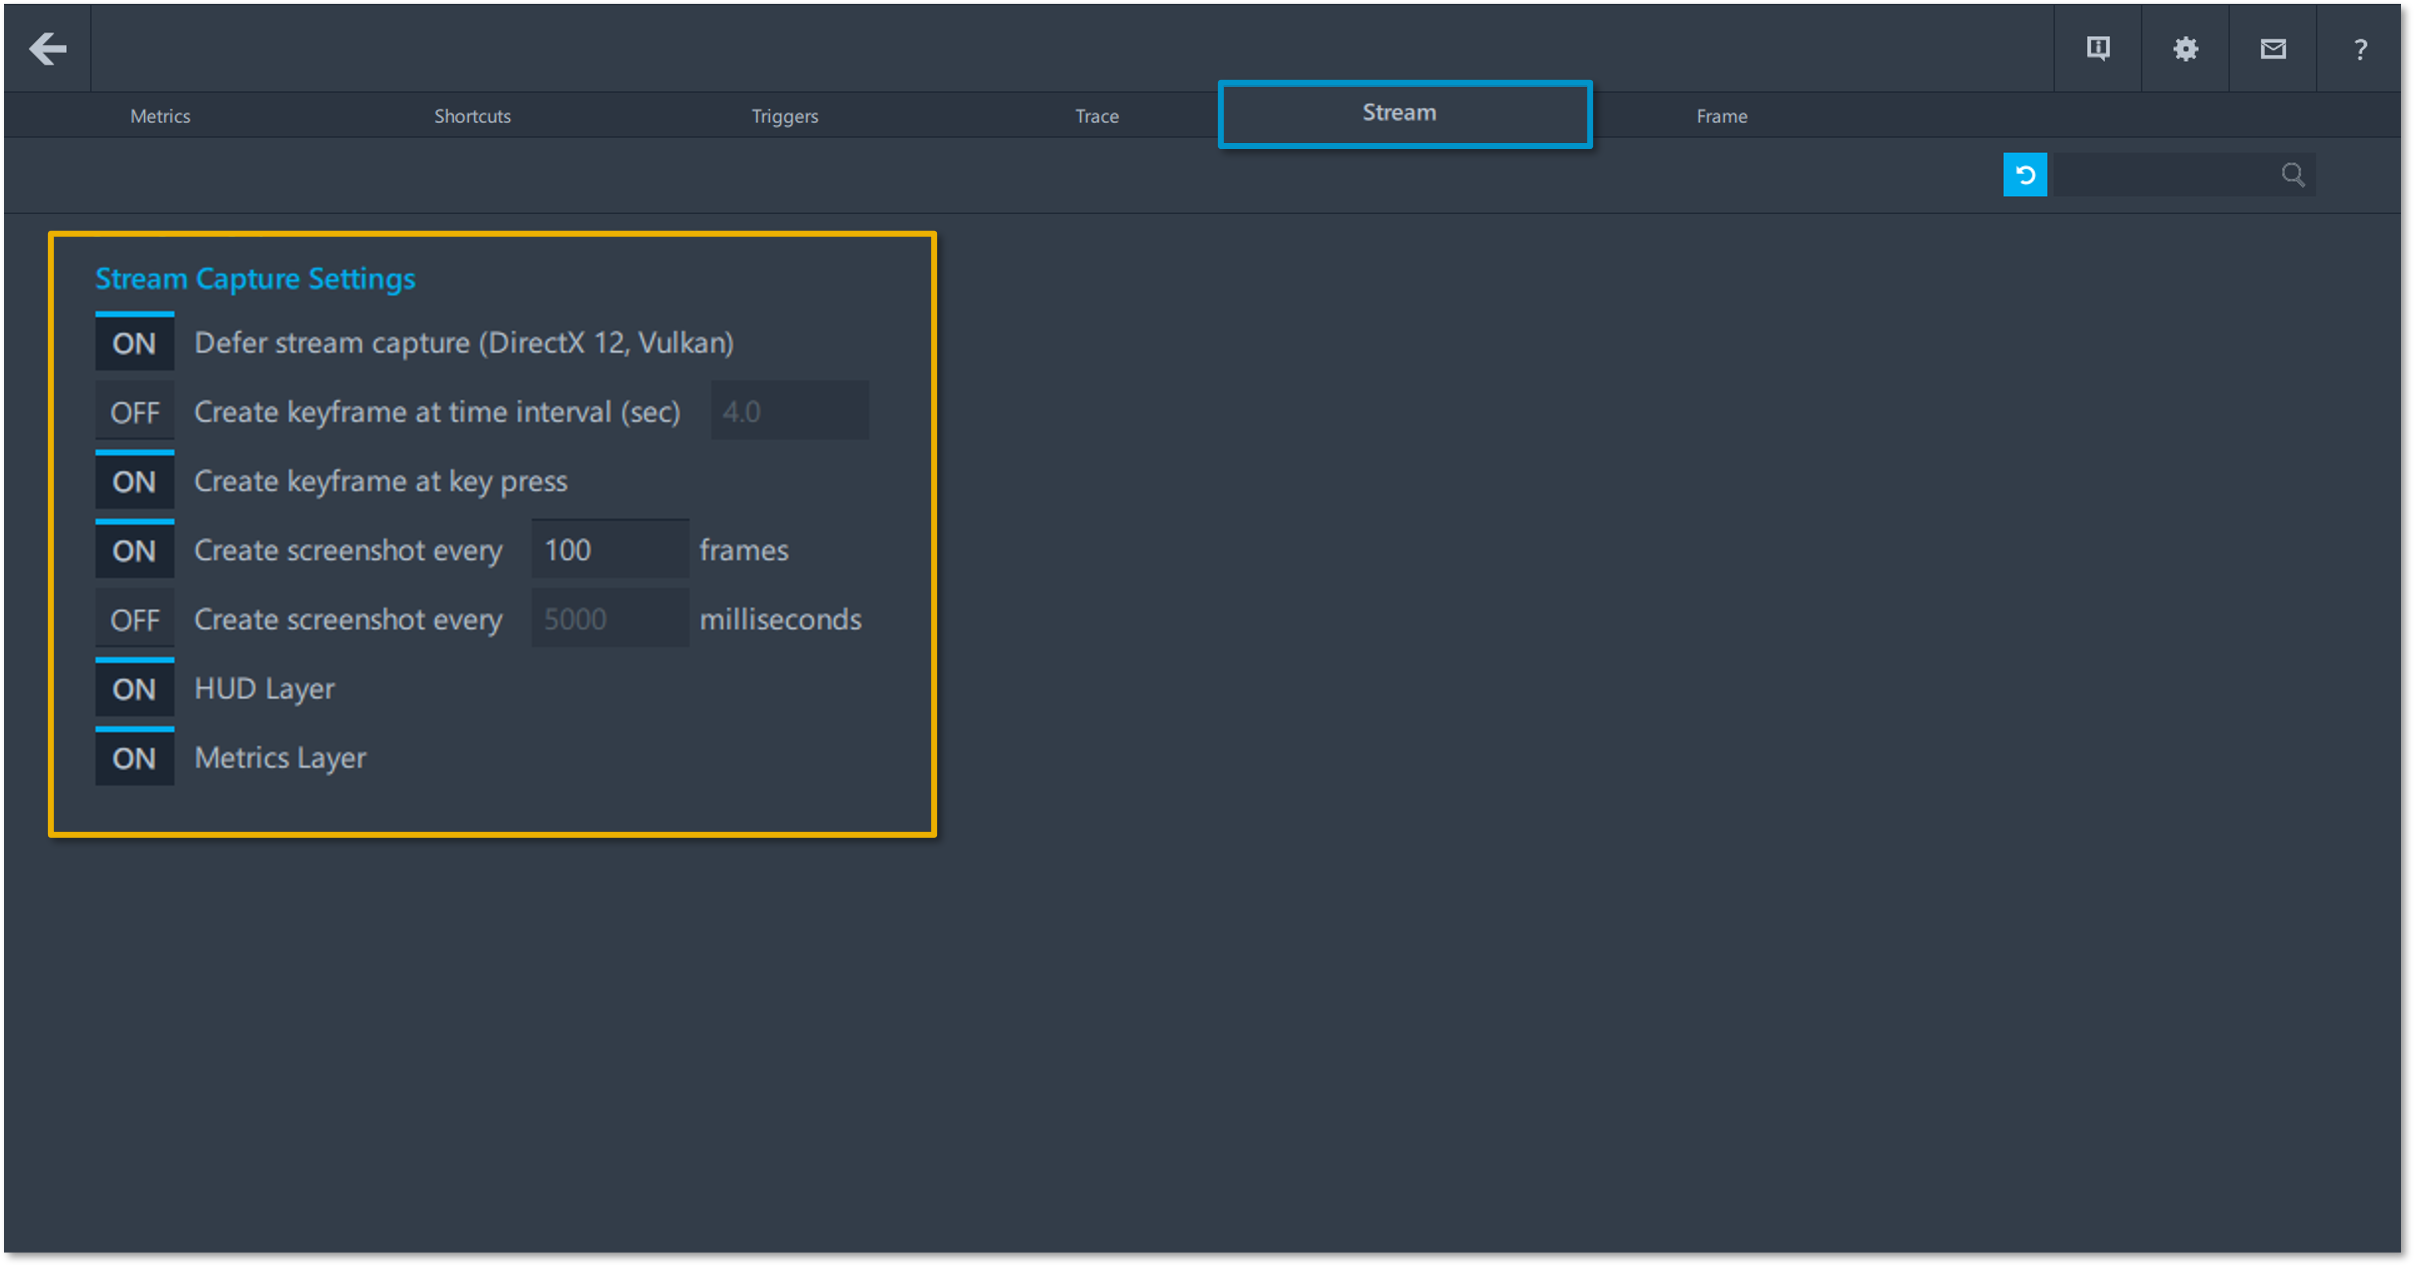
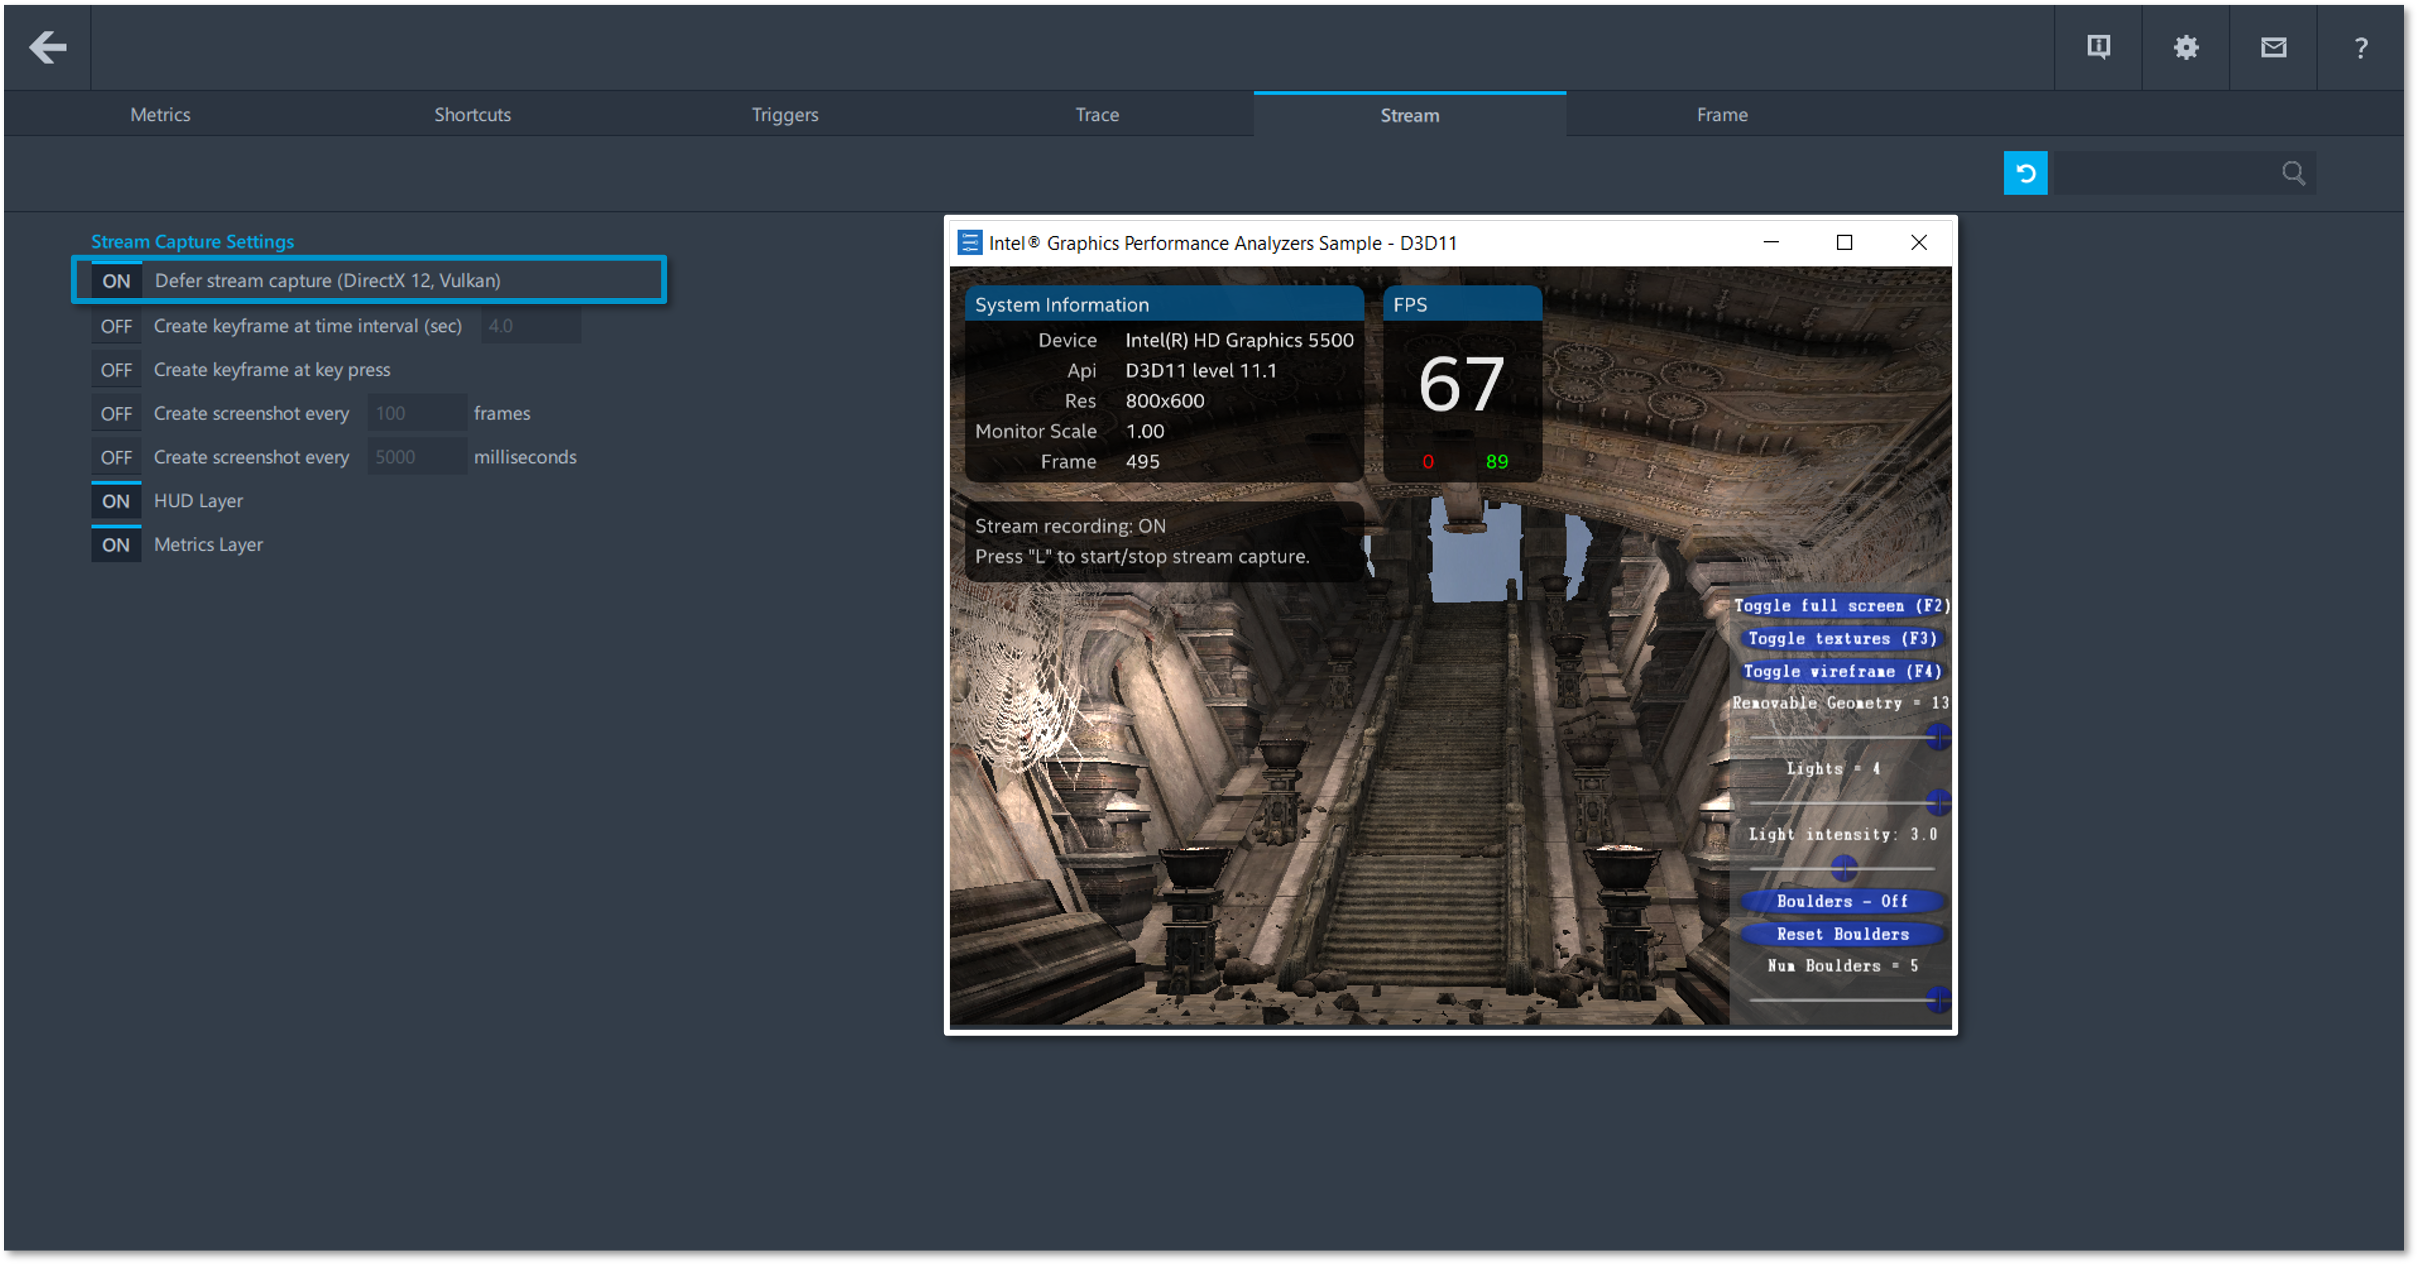
Deferred Stream Capture
The Defer Stream Capture option allows you to start a capture manually, if this option is disabled then the capture process will begin from the launch of the application within Graphics Monitor. If this option is enabled, you can begin capture after starting your application in Graphics Monitor by pressing the L key on your keyboard and stop your capture by pressing the same key.
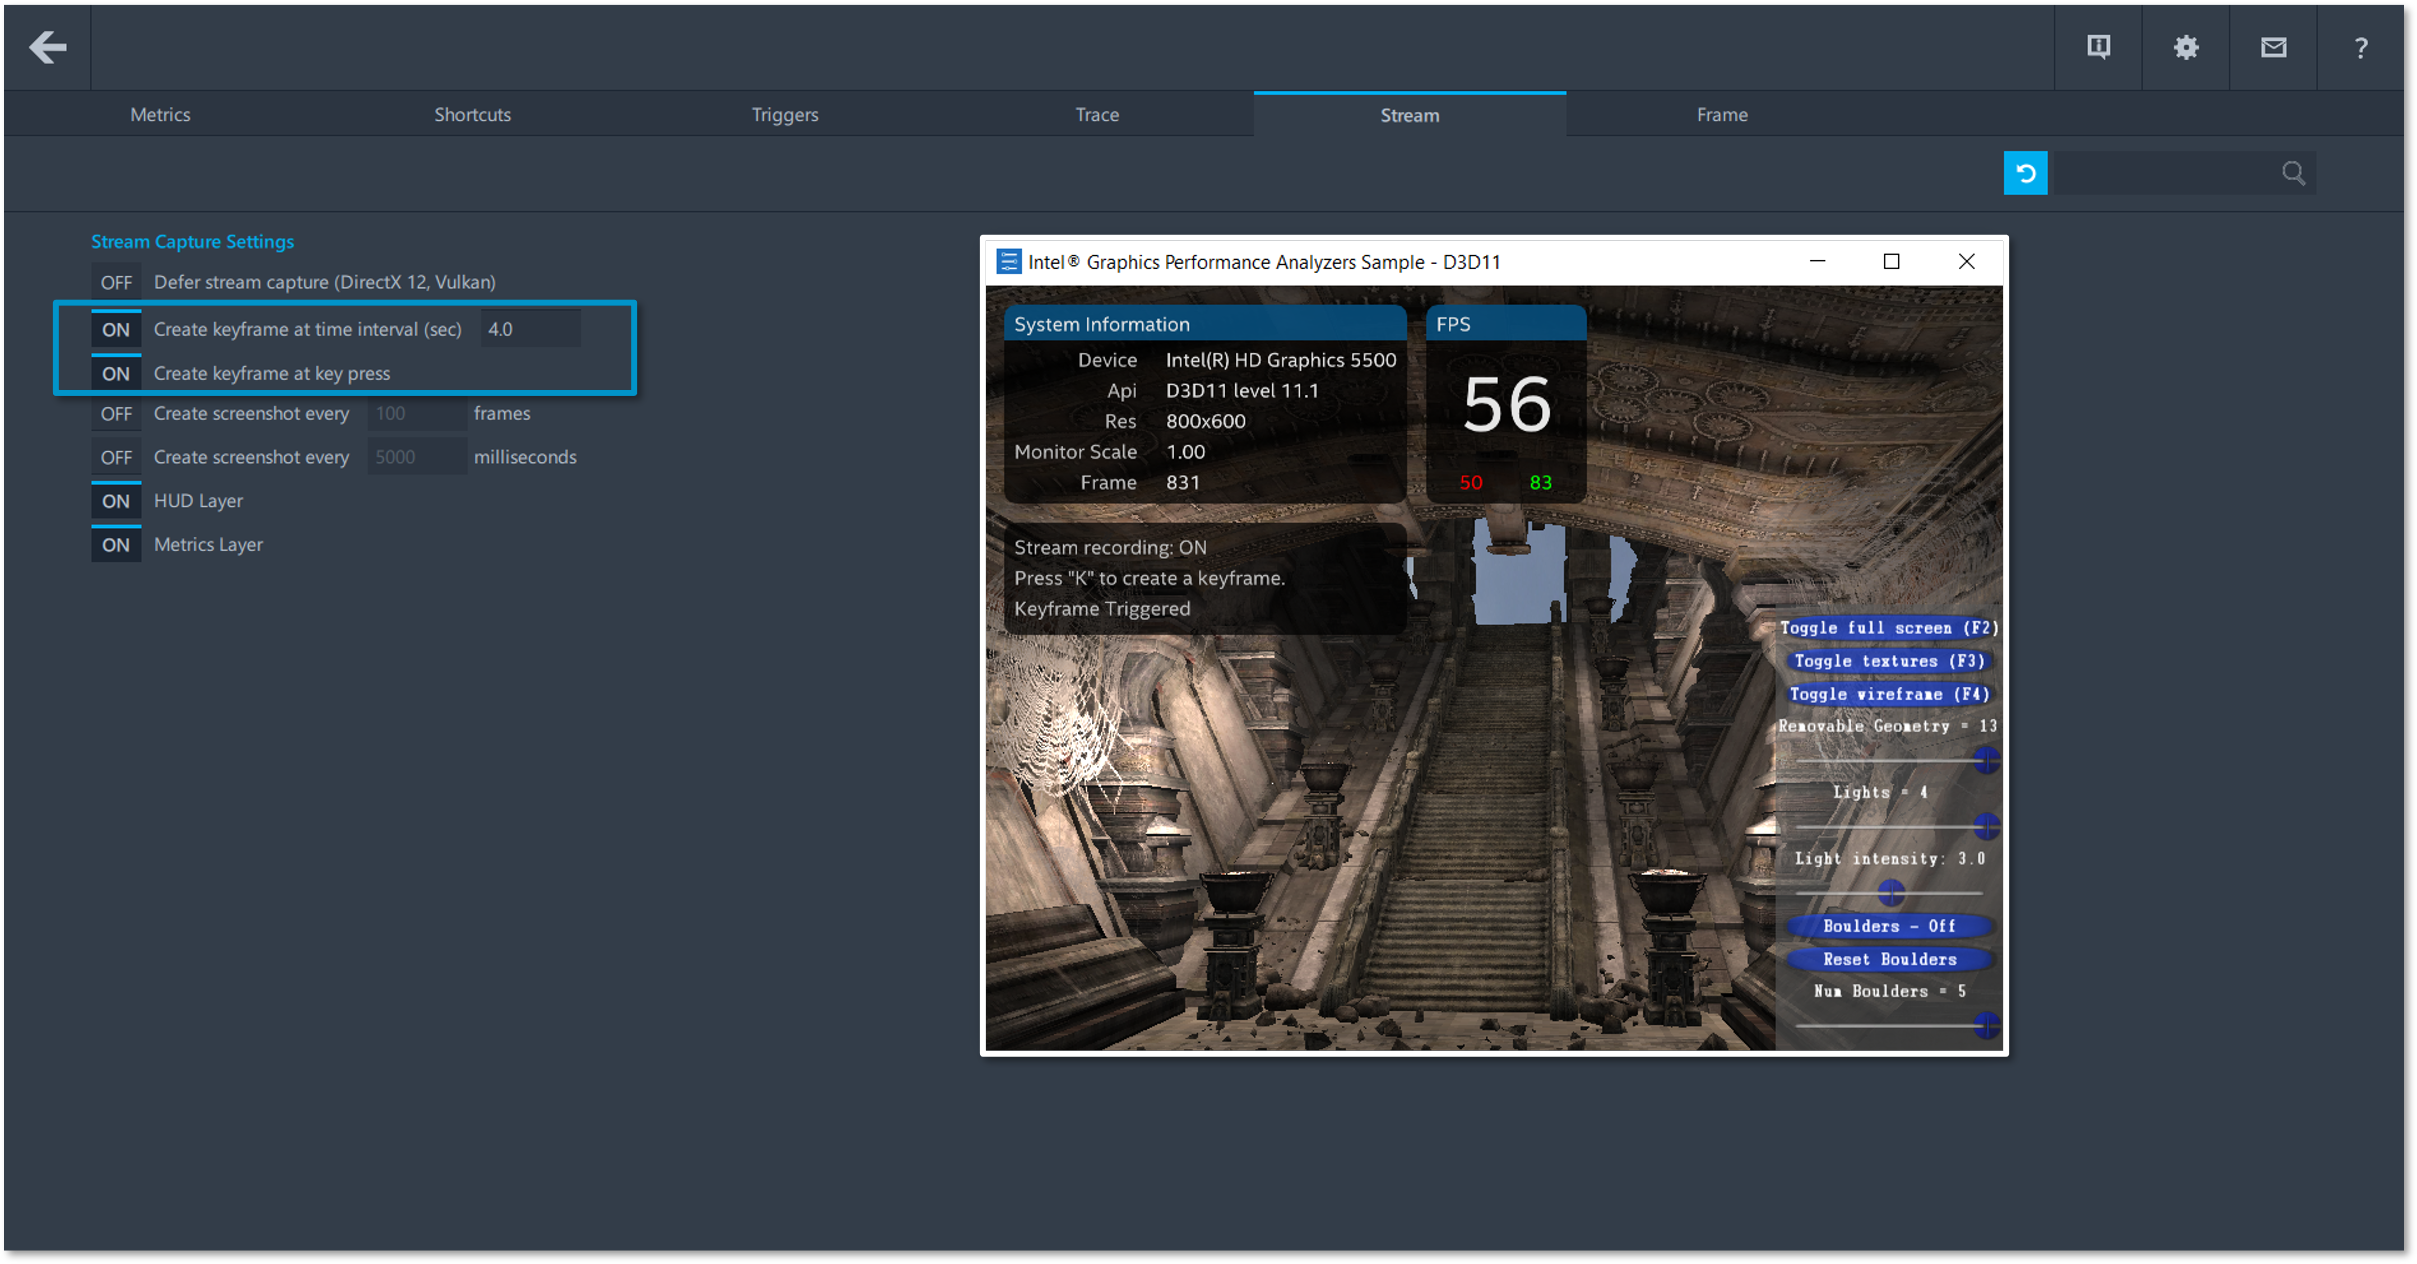
Keyframing
There are two keyframe options that can be enabled for faster playback time during profiling.
- The create keyframe at time interval option allows you to automatically create a keyframe over a user specified time interval in seconds.
- The create keyframe at keypress option allows you to manually create a keyframe after you press your keyframe key binding, which can be altered in the Shortcuts tab of Graphics Monitor. This option can be utilized to accelerate playback from significant points in your stream capture while selecting and opening a single frame for analysis from your stream capture file.
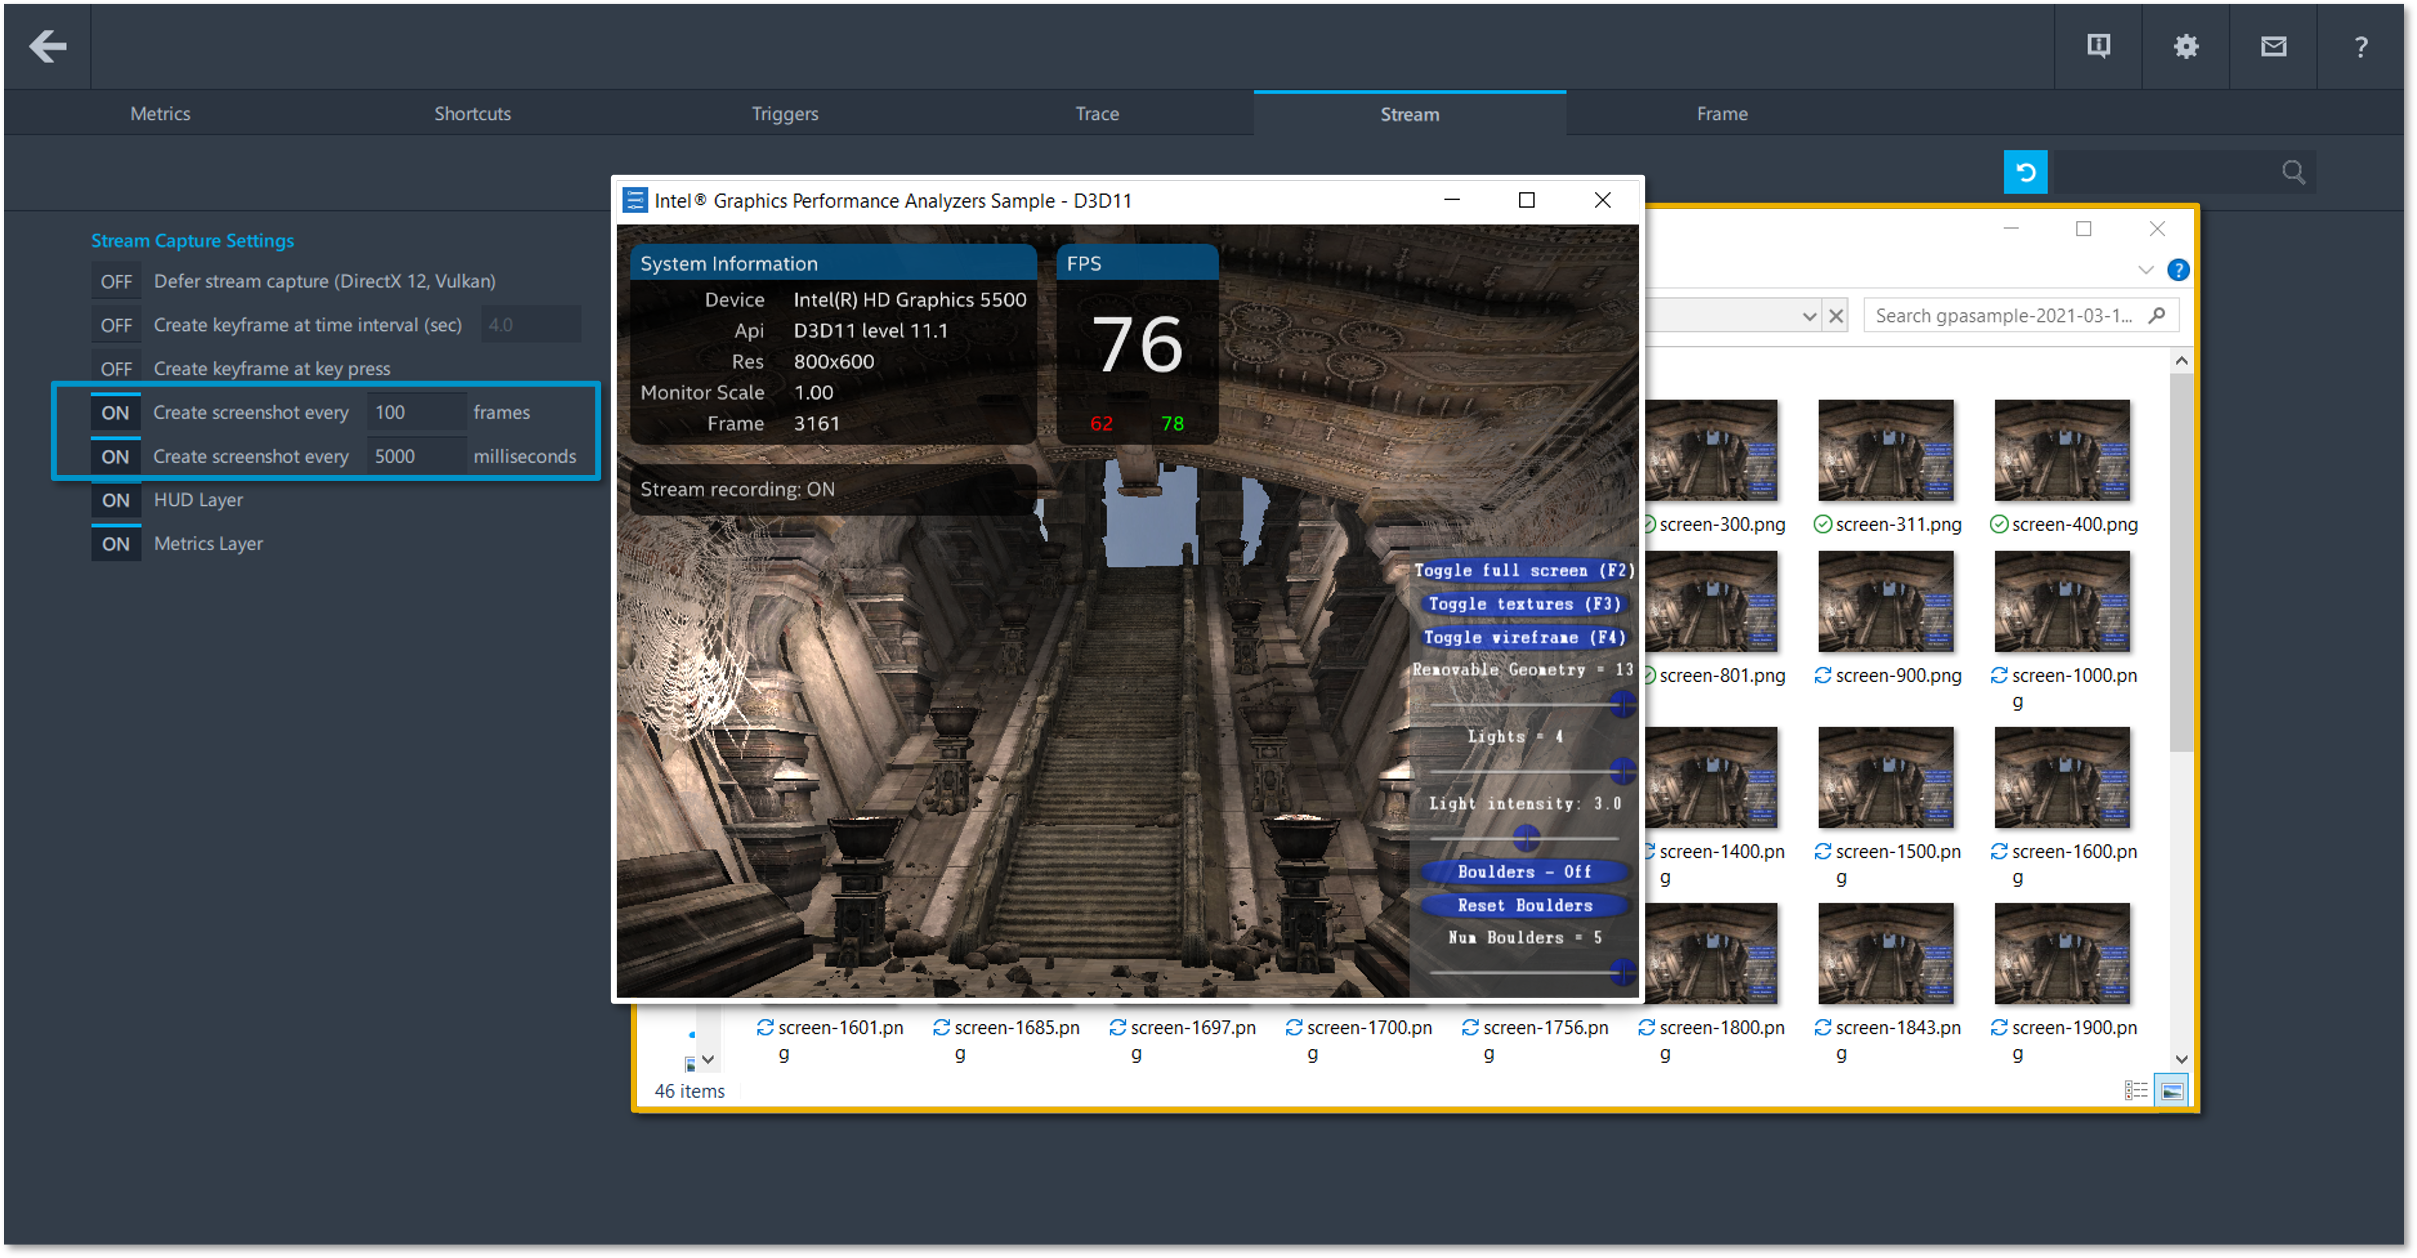
Screenshots
There are two screenshot options that you can enable which will aid in stream capture navigation by creating image thumbnails that can be viewed while inspecting multiple frames in Graphics Frame Analyzer.
- The create screenshot every x frames option allows you to automatically take a screenshot after a user specified number of frames.
- The create screenshot every x milliseconds option allows you to automatically take a screenshot after a user specified time duration in milliseconds has elapsed.
HUD Layer
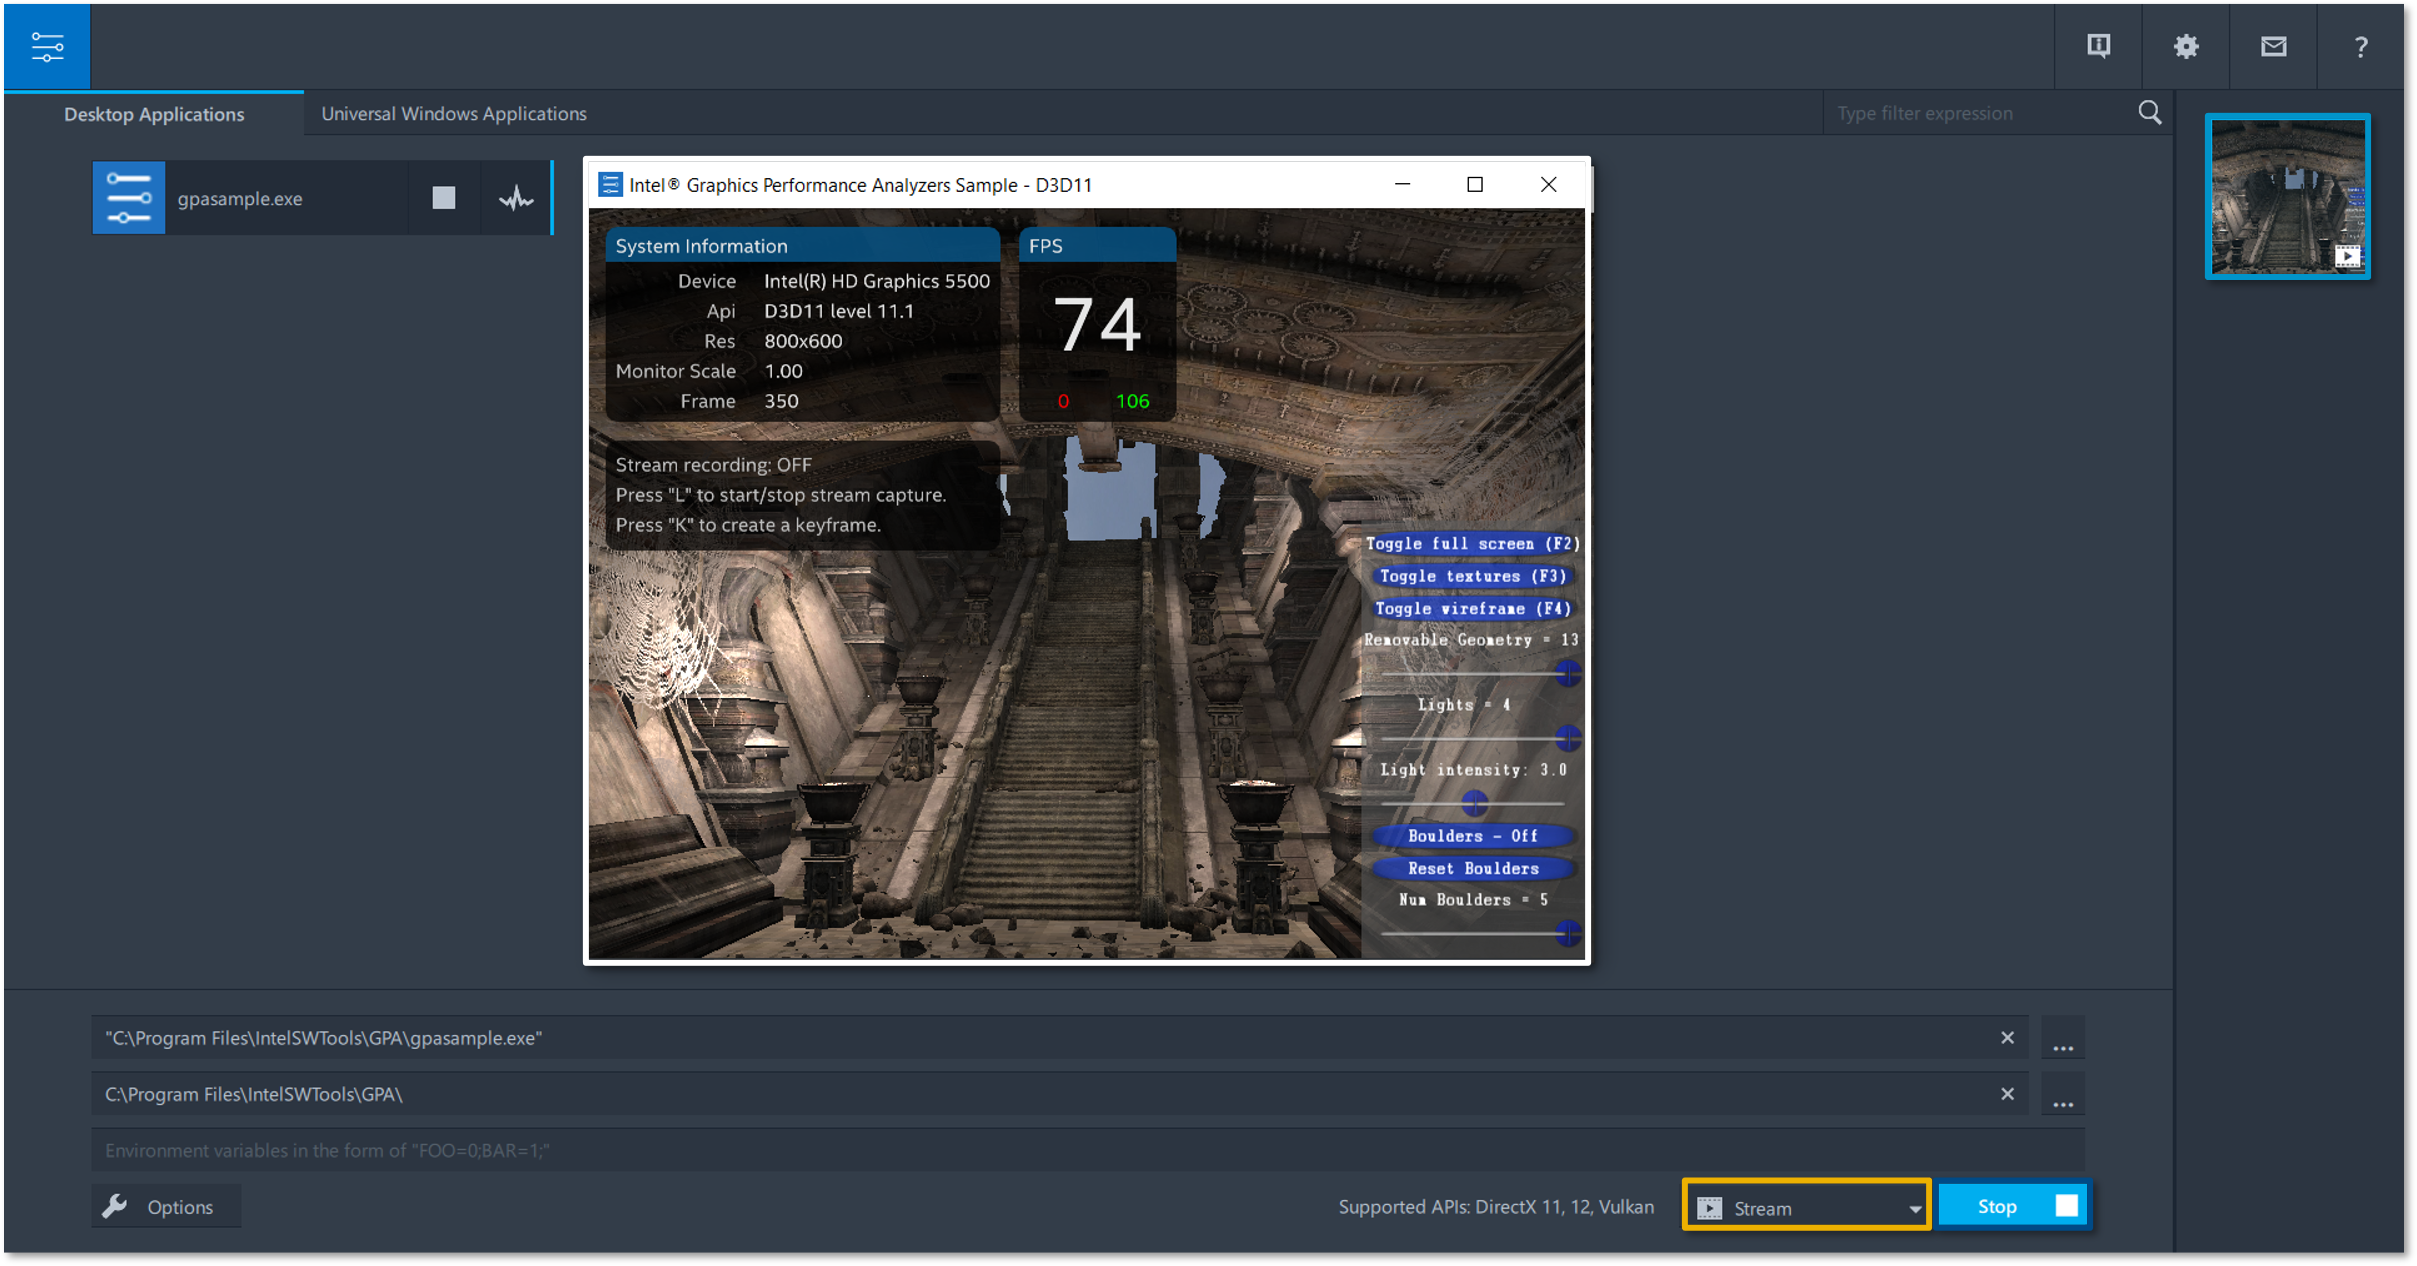
The HUD Layer option enables the heads-up display while recording a stream capture, which displays the graphics device, graphics API, application resolution, monitor scale and the frames per second (FPS) of your application.
Metrics Layer
The Metrics Layer option enables the collection of metrics based on your host systems hardware.
Capturing a Stream
Exit out of the settings menu of Graphics Monitor then enable stream capturing mode by selecting the Stream option from the drop-down menu next to the start button.
NOTE: If you have extended profiling mode enabled in Graphics Monitor and you choose to capture your stream using a graphics API that is not supported by your application then Graphics Monitor will resort to using your applications default graphics API.
Enabled options can by tested by pressing the Start button to begin your stream capture then you can either close the capture or press the Stop button in Graphics Monitor to stop your stream capture. Double click on your newly captured stream thumbnail on the right-hand side of the tool to open it in Graphics Frame Analyzer for Multi-Frame Analysis.
Conclusion
This article demonstrated how to configure and capture multiple frames, otherwise known as streams in Graphics Monitor to tailor your stream captures to your specific use case. For more information on how to identify and analyze problem areas in your applications to resolve GPU performance regressions continue reading the Graphics Frame Analyzer Deep Dive articles.
Additional Resources
Part 1: Configure and Capture Frames (Article)
Part 2: Configure and Capture Multiple Frames (Video)
Part 3: Open and Explore Multiple Frames (Article)
Part 4: Open and Explore a Single Frame (Article)
Part 5: Working with the Bar Chart and API Log (Article)
Part 6: Exploring the Metrics Viewer (Article)
Part 7: Inspecting a Draw Call (Article)