Intel® Advisor is the premiere tool from Intel for helping to parallelize your code, but it can also be used in other ways. For example, you can take advantage of the Intel Advisor special annotation ANNOTATE_OBSERVE_USES to track all memory accesses to a particular variable.
Assume you have a source file, foo.cpp, that contains an allocation point like:
int * pArray = new int[size];
You want to detect all accesses to the pArray elements that happen within the scope of a function bar()where bar() is invoked from bar.cpp.
void bar();
…
bar();//want to track all pArray accesses inside bar() and it’s callees;
Take the following steps:
- #include "advisor-annotate.h" // Add to foo.cpp, bar.cpp
- Add something like –I <advisor-install-dir>/include to your build.
- Change bar.cpp in following way to bracket the call to bar():
ANNOTATE_SITE_BEGIN( MySite1 );
ANNOTATE_TASK_BEGIN( MyTask1 );
bar();//tracking pArray accesses inside bar() and it’s callees; ANNOTATE_TASK_END();
ANNOTATE_SITE_END();
NOTE: Using this sort of Site/Task statement brackets, you could actually observe an arbitrary scope, like a loop scope or the whole application scope (by adding site/task in the main function body).
- Change foo.cpp in following way to track the uses of pArray:
ANNOTATE_OBSERVE_USES(pArray, size);
- Recompile application and run the Intel Advisor XE correctness tool (via the Workflow window, the Standalone toolbar, or the command line).
When you look at the Correctness result, notice the Memory Watch problem set (in addition to any correctness issues found from other annotations).
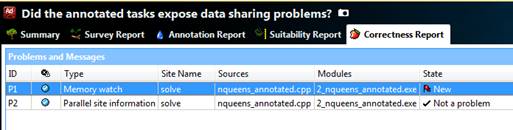
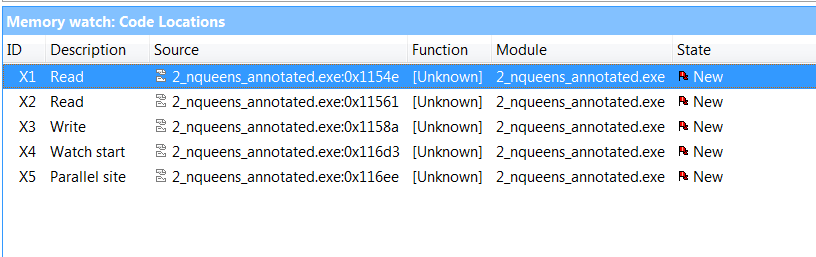
Double-click the Memory Watch problem set to get a Correctness Source reportthat lists all read and write accesses to the pArray.
In summary, with a few additions to your normal annotations, you can use the Intel Advisor to track memory accesses within your code.