Introduction
It is a common use case for high performance, parallel and vectorized code to be run on dedicated remote systems like clusters with strict time schedules and limited capabilities for visualization and data manipulation. Tools for performance assessment are often limited to running from the command line, and many conveniences like GUI interfaces and access to online documentation resources are often unavailable on these types of systems.
The purpose of this article is to show how the Intel® Advisor command line can be used on remote Linux* or Microsoft Windows* system to collect data and the results can be analyzed with the GUI on a MacOS* developer workstation.
Getting Started
To run an Intel® Advisor analysis on a remote (target) system and view the results on a MacOS* computer, you need to perform the following steps:
- Install the Intel® Advisor GUI on a local MacOS* system
- Install the Intel® Advisor command line on a target system (cluster)
- Build your application for analysis with debug information enabled and with inline debug information included (see Intel® Advisor help for more)
- Recommendation: the application for analysis, along with its binaries, symbol information and source code, should be located on a shared drive visible to both local and remote machines
Remote analysis workflow
- Collect data on the target. The following command will run a survey analysis:
This will analyze the vec_samples application and create a result project at /user/test/vec_project.advixe-cl -collect survey -project-dir /user/test/vec_project /user/test/vec_samples/vec_samples - Next, retrieve and view the results. You can either pack your results or simply copy the result project to a shared drive.
- Packing Results:
- You can pack your results using a command like this one:
advixe-cl --snapshot --project-dir /user/test/vec_project --pack --cache-sources --cache-binaries -- /tmp/my_proj_snapshot - Copy my_proj_snapshot.advixeexpz to the MacOS* host and open it in the GUI, then view the result:
advixe-gui my_proj_snapshot.advixeexpz
- You can pack your results using a command like this one:
- Copying Results:
- Copy the vec_project directory to the shared drive.
- Open the project in the GUI:
advixe-gui vec_project - Set up the binary, symbol and source paths for the analyzed application in the shared location using the menu File > Project properties > Binary/Symbol Search and Source Search tabs. Then view the result.
- Packing Results:
Roofline analysis
Let’s walk through the Intel® Advisor Roofline analysis as an example. Start the Intel® Advisor GUI on the local machine. Click the Get Command Line ![]() button on the Workflow pane next to the desired analysis type – in this case, we will start with a Roofline analysis. A dialog window opens, containing the command for launching this type of analysis with the current settings.
button on the Workflow pane next to the desired analysis type – in this case, we will start with a Roofline analysis. A dialog window opens, containing the command for launching this type of analysis with the current settings.
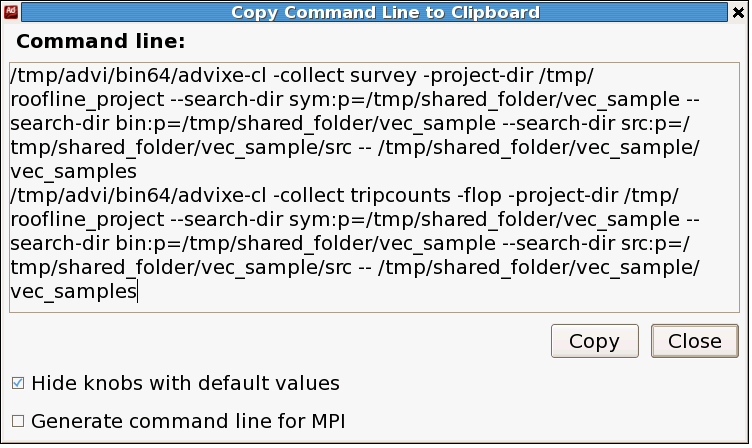
The command line for getting the Roofline chart consists of two commands for Survey and Trip Counts with flops collection. And a couple of parameters with search paths to binary, symbol and source files are included in the auto-generated command line to reflect the project settings.
Copy the line to clipboard and paste it in your job script or in the command line and then start the analysis.
For this case where the results are being analyzed on a MacOS* host system, it is recommended to not use -no-auto-finalize command line option for reducing collection and finalization time. We suggest doing all the finalization on the target system along with the analysis. As a MacOS* workstation most likely does not have the same version of compiler, runtimes, math libraries and other parts of analyzed application stack, finalization on target system should better capture all these details.
Memory Access Patterns and Dependencies Analysis
After getting Survey and/or Roofline analysis results, you may want to perform deeper analysis for certain loops to detect inefficient memory access patterns or determine whether they have data dependencies between iterations. The following commands illustrate these types of analyses. Here, the search directories parameters are omitted for brevity, but be sure to include them for correct mapping of analysis result to sources and binaries.
advixe-cl –project-dir /tmp/roofline_project -mark-up-loops –select foo.cpp:34,bar.cpp:192
advixe-cl -collect map -project-dir /tmp/roofline_project -- /tmp/shared_folder/vec_sample/vec_samples
advixe-cl -collect dependencies -project-dir /tmp/roofline_project -- /tmp/shared_folder/vec_sample/vec_samples
To limit analysis scope only to two specific loops of interest and to reduce analysis time, a -mark-up-loops command is used prior to the analyses in the examples above. This command accepts a comma separated list of loops in a filename:linenumber format, and these loops will remain selected for future tripcounts, map, and dependencies analyses unless otherwise specified.
Alternatively, loops can be specified for the duration of only one map or dependencies command using the -mark-up-list option in the collection command. This option takes a comma separated list of loop IDs numbers. These IDs can be retrieved using Intel® Advisor command line Survey reports or using the GUI by selecting loops with checkboxes on the Survey report tab and getting the corresponding command line on the Workflow window after such selection.
advixe-cl -collect map –mark-up-list=58,72 -project-dir /tmp/roofline_project -- /tmp/shared_folder/vec_sample/vec_samples
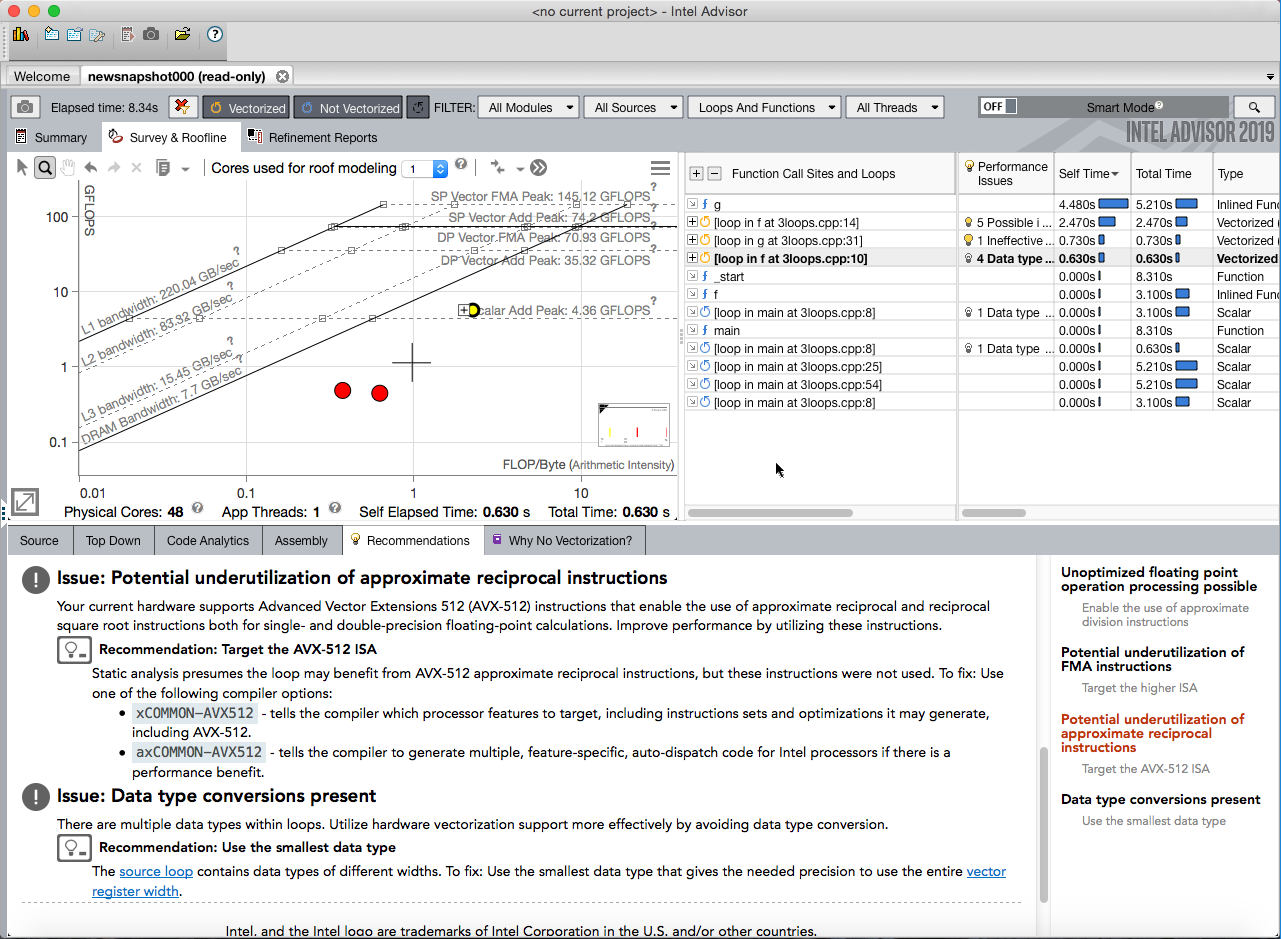
Reviewing results on a MacOS* system
Finally we need to copy the result generated on the remote machine to the local machine to be viewed, using either of the two methods described earlier. Once the results have been opened, the full content of the GUI should be available on your MacOS* system. You will be able to view the results of Intel® Advisor analyses, identify the vectorization inefficiencies and optimization opportunities, and study the Roofline chart, with all these performance observations mapped to source code and assembly.
Notes and limitations
There are a few limitations in the MacOS* result viewer in the Intel® Advisor 2019 Beta version worth noting:
- The PythonAPI is not currenly supported
- A new analysis cannot be run on MacOS* system
- There is no MacOS* specific documentation yet, but most of the result viewing tips from the Linux* documentation should be relevant for viewing results on MacOS* systems.
Summary
Intel® Advisor is a must-have tool for getting the most performance out of your HPC applications. Starting with our 2019 Beta you can now visualize your Intel® Advisor results on your MacOS* system. You should follow the remote workflow described in this article to get the most out of Intel Advisor MacOS* analyses.