Introduction
Welcome back to Unreal Engine* 5 Optimization Guide Chapter 2. In Chapter 1, we covered theoretical fundamentals of profiling and provided practical advice on profiling and optimizing your applications in Unreal Engine*. If you haven't read it yet, we highly recommend that you make yourself familiar with it.
In the previous chapter, we abstracted from the concepts of integrated GPUs (iGPUs) and discrete GPUs (dGPUs) and focused on the profiling approach. In Chapter 2, we will mostly focus on high-performance iGPUs and how to prepare your Unreal Engine* 5 games to support them.
If you haven't seen our new products announcement yet, watch Inside Intel® Arc B390 as this is getting really exciting this year! If you want to know a bit more about Panther Lake architecture, watch Panther Lake Overview.
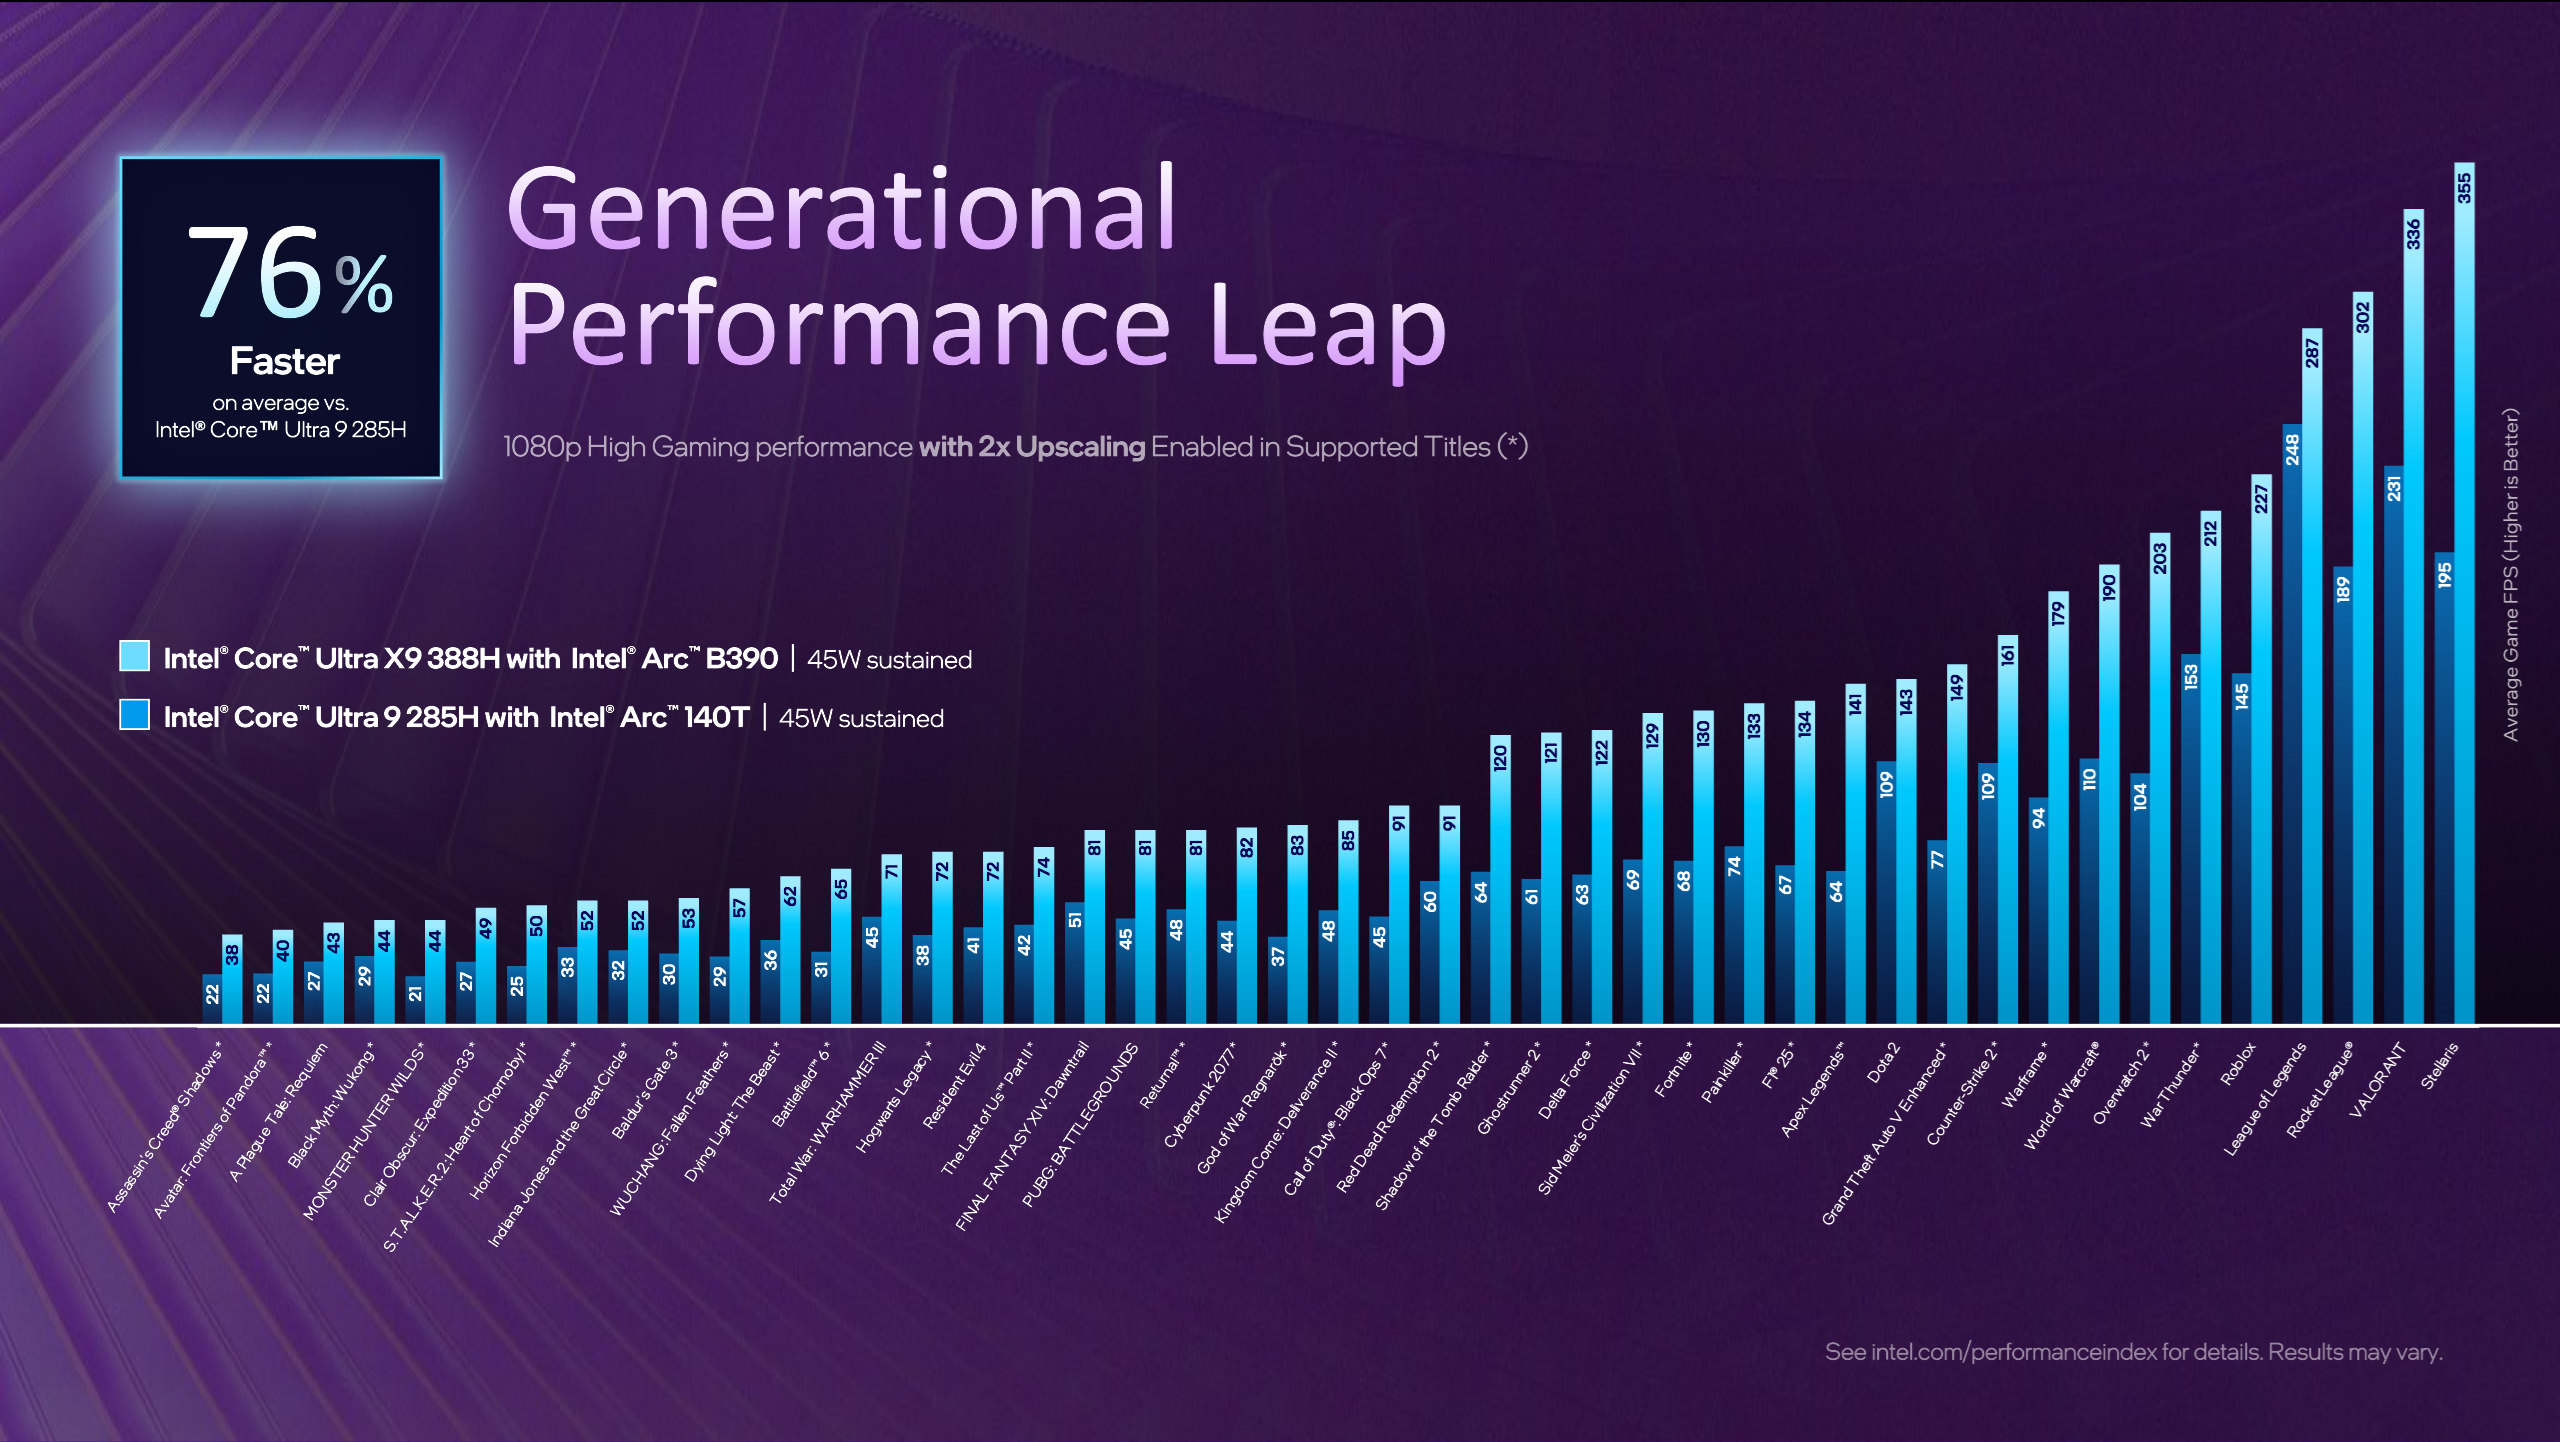
As you can see on the slide presented above, we are entering an era of high-performance iGPUs, which means that techniques that were previously unavailable are now within our reach! And with the help of our XeSS technologies: XeSS Super Resolution, XeSS Frame Generation, XeSS Multi-Frame Generation, XeSS Low Latency you can provide a better and more sustainable performance to your players.
Why should you include iGPUs in your hardware specifications on early project planning stage?
- It allows you to increase your audience range - take a look at Steam Hardware Survey and State of GPU Hardware
- Discrepancies between supported features set on dGPUs and iGPUs are now smaller than ever before
- Early profiling on targeted devices allows you to verify your assumptions and update frame budgets when required
- That allows you to deliver a better performance and experience to your players
In second chapter of Unreal Engine* Optimization Guide, we are going to cover:
- Most common issues observed for iGPUs and dGPUs, and how to avoid/fix them
- Engine Scalability Settings and Device Profiles:
- How do they work?
- How to modify them?
- How to verify if they work as intended?
- How to use synthbenchmark for automatic scalability preset detection with iGPU in mind?
- State of GPU tools and transition from GPA to PIX
- Why is CPU optimization important for iGPU performance?
- Available Intel® Arc™ Gaming Technologies and Unreal Engine* Plugins
- Unreal Engine* 5 Core Tech tips
Most common issues & Unreal Engine* Patches
In this section, we are going to address the most common issues observed by us in games running on iGPUs and dGPUs. We will also explain how to fix them and how to apply backport patches to Unreal Engine* source code to improve your game performance and functional stability.
Let's start with how to apply an engine source code patch to Unreal Engine* 5. To get access to the Unreal Engine* source code repository, follow the instructions - it will be required to get access to the CLs links mentioned later. After you clone the repository and checkout to your specific engine version branch, you can create a patch by adding .patch at the end of the CL link (like this) and save it to a file. Then use git apply your-patch-file.patch from the Unreal Engine* root folder and resolve conflicts manually when needed. You can also apply them manually.
iGPU starting on Epic Engine Scalability Settings
We will cover that in detail later, but as mentioned in the previous chapter Project Configuration, CPU and GPU scores thresholds in BaseScalability.ini are by default really low considering current generation hardware capabilities. It means that synthbenchmark scores returned by the current generation of iGPUs can be much higher than default thresholds defined for High or Epic Scalability Settings. It leads to the detection of suboptimal scalability configuration on game startup, and that can lead to a negative first impression for players. In the worst case scenario, insufficient memory or another technical problem could prevent the game from launching completely.
iGPU distance fields generation
As mentioned previously, some techniques that were previously unavailable are now within our reach. However, because of some assumptions about iGPU's performance made in the past in older engine versions, distance fields were disabled. To make Distance Fields Ambient Occlusion work on iGPU, make sure that you are working on UE5.5+ or backport the required patch CL 36632271
Enable Nanite Software VRS
Nanite Software VRS was introduced together with the UE5.4 release. However, to enable it on Intel® GPUs you need an additional backport patch to make it work. The patch CL 45435274 was included in UE5.7 release. UE5.5 additionally requires two more patches CL 37333494 and CL 38376673. Based on our performance observations in different samples on UE5 versions 5.4->5.6 it greatly improved Nanite Base Pass performance resulting in overall better frame performance.
Fix barrier in divergent control flow in ScreenProbeConvertToIrradianceCS
This patch is intended for UE5.4 and UE5.5. It is already included in UE5.6. The goal of this CL 42243010 is to fix a barrier that causes hang on previous Xe Architecture GPUs.
Engine Scalability Settings (ESS) & Device Profiles
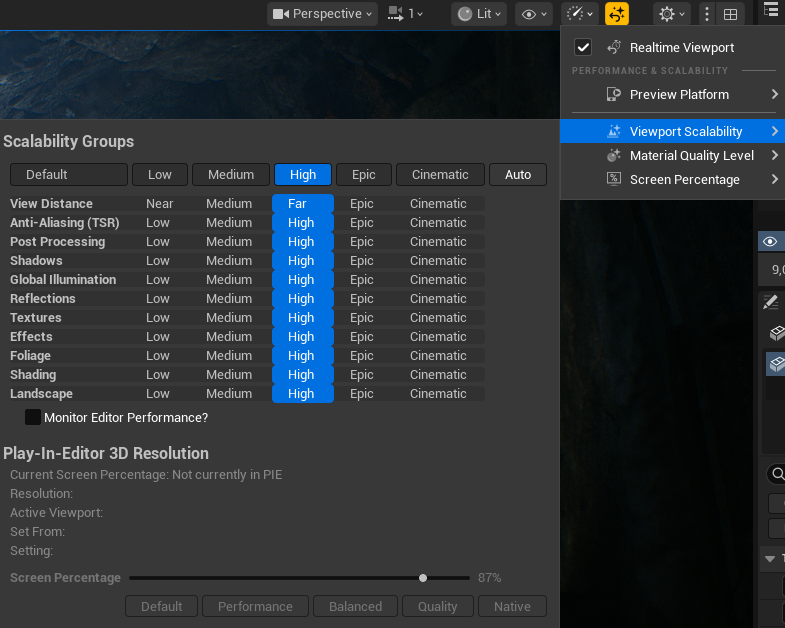
Engine Scalability Settings and Device Profiles allow you to control and scale the quality of features within your project. They are thoroughly described in official Unreal Engine* 5 documentation based on Lyra Starter Games example, also specific Scalability Groups and Detail Mode are explained here.
They are available in the Editor Viewport in settings and can be set to: Low, Medium, High, Epic, Cinematic. In older Unreal Engine* versions, Engine Scalability Settings were available from settings "gear" button. To bring it back to the new viewport, open console by ~ and enable it LevelEditorToolbarSettings 1
To handle diverse hardware configurations and quality needs, Unreal Engine* 5 offers a way to scale games based on configuration files. Those files are then being processed by the engine, and based on Device Profiles, Base Scalability, or Default Scalability files apply console variables (CVars) to your project. Device Profiles are applied automatically per platform, but to make use of auto-detect for visual quality presets or systems scaling you have to run synthbenchmark. Based on its result, Unreal Engine* can choose which scalability groups are the best for the current hardware configuration and apply them.
Scalability groups are defined in BaseScalability.ini, where each of them contains a categorized set of CVars that change the quality and limitations of various systems. You can think of scalability groups as "containers" for CVars that are used to change multiple of them at once. For development convenience, BaseScalability.ini can be overwritten by DefaultScalability.ini so you can easily keep track of what was modified in your project.
There is also a whole hierarchy of files that can overwrite each other's settings, so be aware of it and refer to Configuration File Hierarchy and Setting Priority
Benchmark functionality can be implemented in blueprint by using Run Hardware Benchmark and Apply Hardware Benchmark Results nodes or in C++ Code.
scalability auto command runs synthbenchmark which will execute quick benchmarks in the background, collect results for CPU and GPU, apply the best scalability group for your configuration, and when implemented, store the last result in GameUserSettings.ini
In our experiments, we observed that GPU Scores are in most cases much more reliable than CPU scores - there are many factors that influence it: used system power plan, thermal saturation, frequency stabilization, expensive work running in the background etc.
Another thing that we observed is that during the first run of your game synthbenchmark can return lowered results. It means that users can possibly land in lower scalability instead of the optimal one for specific configurations. You can consider adding a scalability auto button to the settings menu, allowing users to run the benchmark themselves.
Important here to mention is to run synthbenchmark before or after you finish processing expensive work in the background, like for example PSO compilation, as it can have a significant impact on benchmark results.
Useful Commands for testing:
synthbenchmark // runs synthbenchmark and logs results for CPU and GPU
scalability auto // run synthbenchmark and sets scalability groups based on its results
scalability n // Sets all scalability groups to 0:low, 1:med, 2:high, 3:epic, 4:cinematic
sg.* // Scalability quality state (internally used by scalability system, ini load/save or using SCALABILITY console command) 0:low, 1:med, 2:high, 3:epic, 4:cinematic, default: 3
Common Issues in Scalability Settings
Scalability Groups thresholds are too low
As already mentioned thresholds in BaseScalability.ini used to change quality presets based on synthbenchmark scores are quite low. As we can read in BaseScalability.ini
[ScalabilitySettings]
; PerfIndexThresholds define the thresholds that determine what the autodetected quality should be for each group.
; When you auto detect performance, both a CPUIndex and GPUIndex are calculated on the machine.
; Use the console command "scalability auto" to print these values for a machine.
; The type of perfindex used to determine the quality for a group is either the GPU, CPU or Min.
; GPU means the quality is based on the speed of the graphics card. CPU means the quality is based on the processor, and Min means the group quality is based on the slower of either the CPU or GPU.
; Each group has a type followed by three numbers.
; The first number is the perfindex threshold that changes quality from 0 to 1.
; The second is the threshold from 1 to 2
; The third is the threshold from 2 to 3.
PerfIndexThresholds_ResolutionQuality="GPU 18 42 115"
PerfIndexThresholds_ViewDistanceQuality="Min 18 42 105"
PerfIndexThresholds_AntiAliasingQuality="GPU 18 42 115"
PerfIndexThresholds_ShadowQuality="Min 18 42 105"
PerfIndexThresholds_GlobalIlluminationQuality="GPU 18 42 115"
PerfIndexThresholds_ReflectionQuality="GPU 18 42 115"
PerfIndexThresholds_PostProcessQuality="GPU 18 42 115"
PerfIndexThresholds_TextureQuality="GPU 18 42 115"
PerfIndexThresholds_EffectsQuality="Min 18 42 105"
PerfIndexThresholds_FoliageQuality="GPU 18 42 115"
PerfIndexThresholds_ShadingQuality="GPU 18 42 115"
Thresholds fully depend on your game optimization, used tech, and targeted frame budget. There is no golden rule for how to set them properly, but as in Chapter 1, we recommend increasing them even up to "GPU 150 260 550" or even higher as a starting point and then tweaking values based on performance observations and profiling. It does not mean that thresholds for any scalability group should be the same, they can be different as they have a different impact on your frame. But if you do so, remember to add the scalability auto button in your settings menu to allow users to get back to the default scalability detected by synthbenchmark.
It was previously mentioned, but another important thing is that synthbenchmark results can be extremely different when tested on Development Configuration and when tested on Test Configuration, even up to 30% higher on Test.
To summarize, what would we recommend is to:
- Make sure that you are running synthbenchmark on the Test configuration build to establish thresholds
- Make sure that you are running it before or after processing any expensive work or during the first loading screen
- Use GPU scores over CPU scores as they are more reliable
- Verify if synthbenchmark scores are consistent between game runs
- If you have to use CPU Scores - measure scores on the targeted System Power Plan (Balanced? Performance?)
- Add Auto Scalability button in graphics menu settings so players can go back to default settings
- Do not run it on every game startup and do not override user changes in GameUserSettings.ini
CVar Leaking
Another common problem we observe is setting CVars only for a couple of preset values within a specific scalability group, without defining what happens when the preset changes to a lower or higher value during gameplay or profiling. When you're adding a new CVar to scalability settings, remember to include it in all group levels with appropriate values. This prevents unexpected behavior when switching between quality presets and ensures your CVars work consistently across all scalability settings.
Let's use this fragment as an example of "CVar Leak"
[ViewDistanceQuality@0]
r.Nanite.MaxPixelsPerEdge=4
r.Nanite.Streaming.StreamingPoolSize=256 ;default 512

[ViewDistanceQuality@1]
r.Nanite.MaxPixelsPerEdge=2
r.Nanite.Streaming.StreamingPoolSize=256 ;default 512

[ViewDistanceQuality@2]
r.Nanite.MaxPixelsPerEdge=1
;r.Nanite.Streaming.StreamingPoolSize=512 ;Missing

[ViewDistanceQuality@3]
r.Nanite.MaxPixelsPerEdge=1
;r.Nanite.Streaming.StreamingPoolSize=512 ;Missing

[ViewDistanceQuality@Cine]
r.Nanite.MaxPixelsPerEdge=1
;r.Nanite.Streaming.StreamingPoolSize=512 ;Missing
We ran synthbenchmark and based on its results, we started on High(2) quality preset. While changing presets in the settings menu, we lowered it to Medium(1), CVar was set to a lower value, then we decided that we want to change it back to High(2) - CVar is not updated to the previous value anymore. It can be a real nightmare during profiling.
Here is the output log of what was just described:
Cmd: r.Nanite.Streaming.StreamingPoolSize ?
r.Nanite.Streaming.StreamingPoolSize = "512"      LastSetBy: Constructor

LogConfig: Applying CVar settings from Section [ViewDistanceQuality@1] File [Scalability]
LogConfig: Set CVar [[r.SkeletalMeshLODBias:1]]
LogConfig: Set CVar [[r.ViewDistanceScale:0.6]]
LogConfig: Set CVar [[foliage.DensityScale:0.4]]
LogConfig: Set CVar [[grass.DensityScale:0.4]]
LogConfig: Set CVar [[r.Nanite.Streaming.StreamingPoolSize:256]]

Cmd: r.Nanite.Streaming.StreamingPoolSize ?
HISTORY
Constructor: 512
Scalability: 256
r.Nanite.Streaming.StreamingPoolSize = "256"      LastSetBy: Scalability

LogConfig: Applying CVar settings from Section [ViewDistanceQuality@2] File [Scalability]
LogConfig: Set CVar [[r.SkeletalMeshLODBias:0]]
LogConfig: Set CVar [[r.ViewDistanceScale:0.8]]
LogConfig: Set CVar [[foliage.DensityScale:1.0]]
LogConfig: Set CVar [[grass.DensityScale:1.0]]

Cmd: r.Nanite.Streaming.StreamingPoolSize ?
HISTORY
Constructor: 512
Scalability: 256
r.Nanite.Streaming.StreamingPoolSize = "256"      LastSetBy: Scalability
How to confirm Scalability Group functional correctness
The easiest way is just to look in your log as above, you can DumpCVars for different preset or you can use `?` after CVar in console.
Not all CVars are by default available to be used in Scalability Groups. It requires an additional flag to be included in the CVar definition. To find out more about these flags, read comments in EConsoleVariableFlags in IConsoleManager.cpp. Using CVar without the required ECVF_Scalability flag will result in a warning, and it will be ignored.
Scalability.ini can only set ECVF_Scalability console variables ('r.Nanite.Streaming.StreamingPoolSize'='256' is ignored)
LogStats:             FDebug::EnsureFailed -  0.000 s
Cmd: r.Nanite.Streaming.StreamingPoolSize ?
r.Nanite.Streaming.StreamingPoolSize = "512"      LastSetBy: Constructor
To make it available in Scalability Group you have to include ECVF_Scalability flag in CVar definition.
static int32 GNaniteStreamingPoolSize = 512;
static FAutoConsoleVariableRef CVarNaniteStreamingPoolSize(
	TEXT("r.Nanite.Streaming.StreamingPoolSize"),
	GNaniteStreamingPoolSize,
	TEXT("Size of streaming pool in MB. Does not include memory used for root pages.")
	TEXT("Be careful with setting this close to the GPU resource size limit (typically 2-4GB) as root pages are allocated from the same physical buffer."),
	ECVF_Scalability | ECVF_RenderThreadSafe // << Like here
);
How to use Engine Scalability Settings for targeted performance optimizations?
Before we move on to creating customized scalability profiles, make sure that you are already familiar with the profiling fundamentals discussed in Chapter 1 in this section we are going to extend it with new recommendations.
The most important rule in effective performance optimization is to profile your game often and on the targeted device! Make it part of your development process, and automate it when possible - please take a look at Automated Performance Testing. Don't postpone optimization until the end of development - this makes identifying performance issues much more difficult.
Make sure that captured traces are deterministic and observe how specific project changes impact your game performance. Pay close attention to assets and audit them regularly, as performance bottlenecks often result from incorrectly configured or imported assets.
As of Unreal Engine* 5.6, Epic Games introduced a re-architected Insights GPU Profiler 2.0 that unified existing systems profiling. We highly recommend to watch it together with Profiling with Purpose - especially pay attention to Chaos Visual Debugger!
Async Compute
With increasing usage of async compute by various systems in Unreal Engine* 5, GPU Profiler 2.0 added support for async queue analysis. However, with async compute enabled graphics and compute queues work can overlap to increase thread throughput on the GPU. Because of that it is recommended to disable async compute during profiling of specific passes / shaders.
There are many ways to disable it for profiling purposes:
- r.D3D12.AllowAsyncCompute (recommended) it makes the RHI behave as if hardware doesn't support async compute. That means nothing gets submitted to the compute queue, and everything falls back to the graphics queue. It is init based CVar and cannot be modified at runtime.
- DisableAsyncCompute (recommended) command line argument also works for other RHI
- r.RDG.AsyncCompute (not recommended) it affects only Render Dependency Graph. It disables almost all the compute work, but there is still some work being done on async compute when disabled this way. It means that there is still additional work required to synchronize queues. It can be modified at runtime.
There are also small but really important details to mention about passing CVars to your binary: we can do it by passing it through -ExecCmds or -dpcvars. The difference is that -dpcvars overrides CVars before engine init, so you can override read-only CVars, and it should be a preferred way to pass CVars to your binary.
Examples:
YourGame-Win64-Test.exe -dpcvars="r.D3D12.AllowAsyncCompute=0" -ExecCmds="stat fps"
YourGame-Win64-Test.exe -DisableAsyncCompute
Check out the available CVars
To create custom profile, you need to understand the CVars available in the engine that affect the systems your game uses. Start by generating a complete list of available CVars in the engine.
	IConsoleManager::Get().RegisterConsoleCommand(TEXT("DumpCVars"),
		TEXT("List all console variables, their values, and how they were last modified.\n")
		TEXT("Usage: DumpCVars [prefix] [-showhelp] [-deprecated] [-csv[=path]]\n")
		TEXT("prefix      - Only list variables that start with this string\n")
		TEXT("-showhelp   - Show help information for each variable\n")
		TEXT("-deprecated - Only list deprecated variables. Values are not shown for deprecated variables.\n")
		TEXT("-csv        - Save results to a csv file. If a file is not specified, it will be created in the Project Logs directory."),
		ECVF_Default);

	IConsoleManager::Get().RegisterConsoleCommand(TEXT("DumpCCmds"),
		TEXT("List all registered console commands.\n")
		TEXT("Not all commands are registered. Unregistered commands will not be listed by this command\n")
		TEXT("Use DumpConsoleCommands if you need to list unregistered commands as well\n")
		TEXT("Usage: DumpCCmds [prefix] [-showhelp] [-deprecated] [-csv[=path]]\n")
		TEXT("prefix      - Only list commands that start with this string\n")
		TEXT("-showhelp   - Show help information for each command\n")
		TEXT("-deprecated - Only list deprecated commands\n")
		TEXT("-csv        - Save results to a csv file. If a file is not specified, it will be created in the Project Logs directory."),
		ECVF_Default);

	IConsoleManager::Get().RegisterConsoleCommand(TEXT("DumpConsoleCommands"),
		TEXT("List all console commands, both registered and unregistered\n")
		TEXT("Usage: DumpConsoleCommands [prefix]\n")
		TEXT("prefix      - Only list commands that start with this string\n"),
		ECVF_Default);
Using DumpCVars -showhelp -csv="your_path" will provide a list of all CVars, their current values based on your active quality settings, what set this value for the last time, and help for a specific Cvar. It means that you'll need to dump this information multiple times across different quality presets to understand how CVars change between settings and get the complete picture of available options. LastSetBy: Constructor/Scalability/ProjectSetting information can help you identify which CVars can be configured together in specific files when searching through the source code.
Selecting and Testing CVars
The Unreal Engine* contains thousands of CVars distributed across multiple files, making optimization a complex task. Because of that we recommend to focus on specific categories and target only the technologies or systems that currently exceed your performance budget.
Beyond those included in BaseScalability.ini, there is no universal set of CVars that guarantees consistent results across all projects. And even the one included in BaseScalability.ini can be tweaked to address your project needs better. Currently, there are many different rendering pipelines, games use different technologies, some of them use all of them, and some of them only a subset, that can significantly impact the workload optimization. Always profile first, then validate your optimization assumptions.
Once you have a complete list of CVars, filter for CVars containing keywords related to your target system, such as "Nanite" or "Lumen." Familiarize yourself with CVar descriptions, verify their implementation in the source code, identify which rendering passes they affect in Unreal Insights, and adjust values based on your scene requirements. Profile these changes and validate results. When you identify CVars that consistently improve performance across multiple tested devices, include them in DefaultScalability.ini.
To measure the performance impact, you can use ABTest to compare the times of two different CVar values. However, it would be more effective to test it on longer gameplay after including CVars in Scalability Settings or passing through dpcvars. Then compare the average values based on Trace.Region.
ABTest
What ABTest is was already discussed in the previous chapter.
We recommend using Test Build Configuration for ABTest, as additional CPU overhead in Editor viewport and PIE can cause some false positive results in your optimization that normally won't be visible in a packaged build.
It can be a good starting point to find promising CVars, but it would be best to use Unreal Insights or another external tool for proper verification.
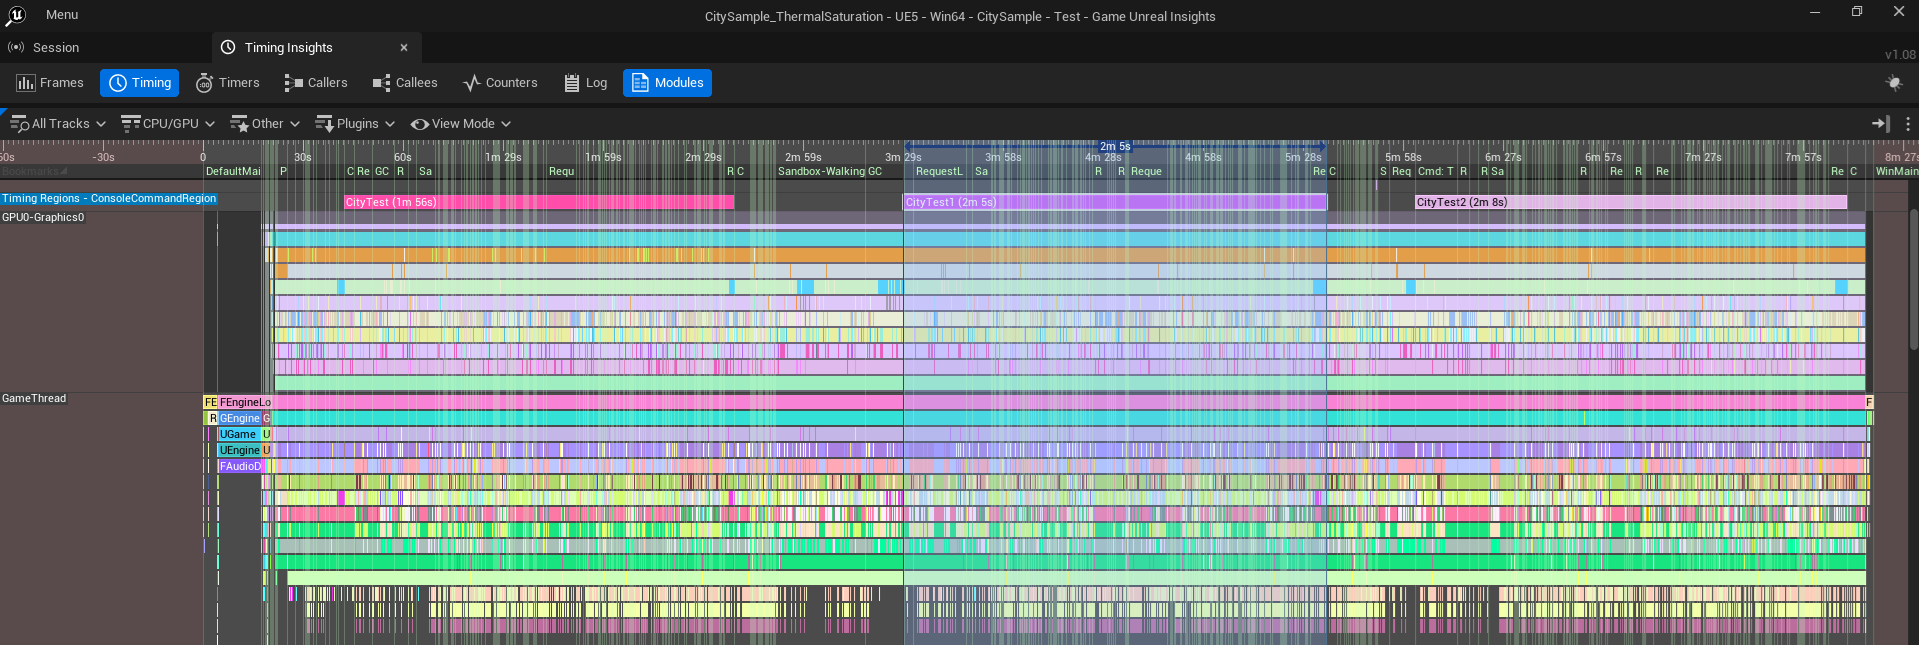
Unreal Insights : Trace Regions
Once you identify promising candidates, you can create a script that runs automated sequences with modified CVars or passed through dpcvars, and capture Unreal Insights trace with automated Trace Regions. Trace Regions allow you to create a limited frame scope within the captured trace for further analysis. You can create multiple regions during a single capture, and they can be added on top of each other. Then you can export timer statistics for specific regions to CSV using the Unreal Insights command-line interface, and compare average timer values across different regions or traces to observe how specific CVars impact actual gameplay performance.
It is not always recommended to capture extremely long traces, especially when you are changing many CVars during a single capture. It may be better to take separate captures and compare the subsequent results later. CVars passed by dpcvars are also included in the utrace description, so it is making it easier to compare traces with each other.
However, when profiling the iGPU, you have to be aware of thermal saturation. In practice, it means that on cold start, your frame times can be lower (higher fps), and while thermal saturation is building up, and eventually performance will stabilize, the driver can decide to decrease frequency and power to manage thermal saturation and avoid overheating. Additionally, system power plans directly impact performance results - balanced mode reduces power consumption to extend battery life but limits performance, while ultimate performance mode increases power draw and heat generation but delivers improved performance at the cost of battery life
Trace Regions are available as:
- Console Commands: Trace.RegionBegin [Name] / Trace.RegionEnd [Name]
- C++ Macros: TRACE_BEGIN_REGION / TRACE_END_REGION
- Blueprints: Trace Mark Region Start / Trace Mark Region End
Command line interface example:
UnrealInsights.exe -AutoQuit -NoUI -ABSLOG="C:\PerfData\Logs\ExportTimerStatistics.log" -OpenTraceFile="<Path_to_utrace_file>" -ExecOnAnalysisCompleteCmd="TimingInsights.ExportTimerStatistics C:\PerfData\Results\<utrace_name>.csv -region=<region_name> -threads=GPU"
PIX on Windows
In the previous chapter, we mentioned Intel® Graphics Performance Analyzers (GPA) and Unreal Engine* Plugin to support integration with it. As of 2025 GPA has been discontinued with no further updates planned. What does it mean in practice for you? Moving forward, our efforts will be focused on enhanced PIX support. If you haven't seen it yet, we highly recommend making yourself familiar with our presentation from Graphics Programming Conference : Profiling with PIX, which explains in detail how to leverage PIX with high-frequency counters to optimize performance on our GPUs.
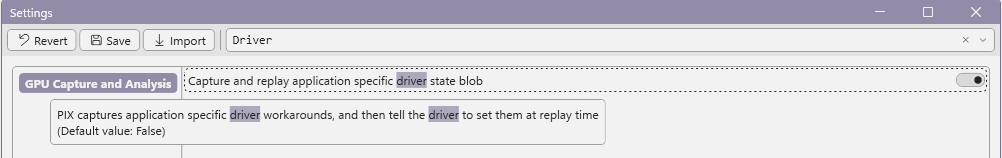
3 important things about Windows PIX changed from last time and require particular attention:
Application Specific Driver State addresses situations where D3D12 drivers implement workarounds for application bugs, enable emulation for natively unsupported features, or apply various optimizations. These workarounds can cause capture replay issues when missing. To ensure identical driver state between capture and replay, enable this option in PIX settings, as it is disabled by default. For more information about Windows PIX on Intel® Arc™ GPUs visit DirectX development blog
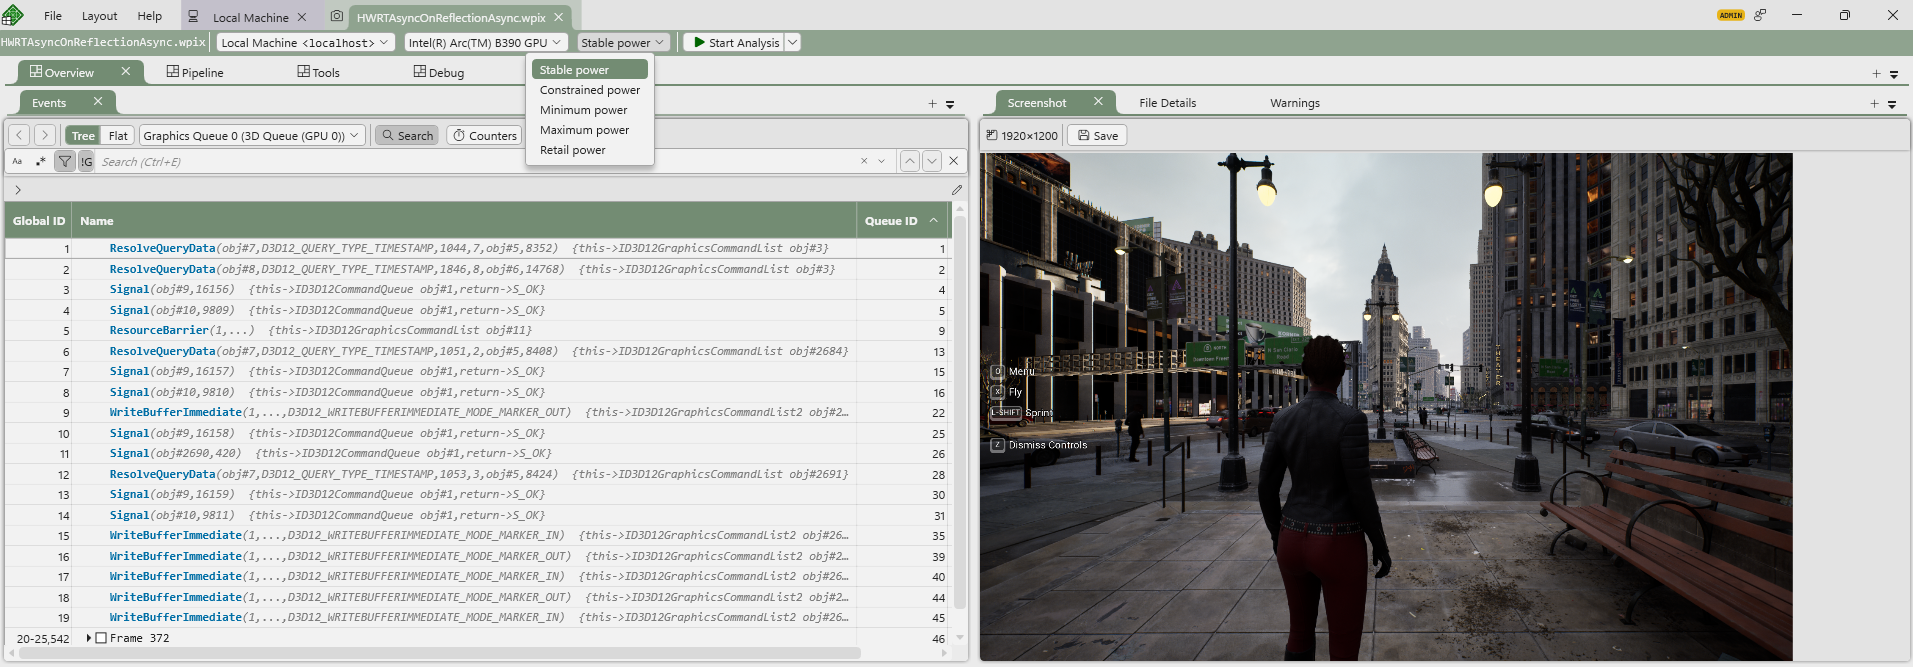
Power Mode Support in PIX is now supported during replays. They are available next to the Start Analysis button and offer 5 different settings. When you move your mouse over a specific config, it'll show you the description of the specific power mode:
- Stable Power = 2/3 of maximum GPU frequency
- Constrained Power = 1/3 of maximum GPU frequency
- Minimum Power = Minimum GPU frequency
- Maximum Power = Maximum GPU frequency
- Retail Power = PIX does not modify power mode
Async Compute serialization - while games may execute tasks simultaneously on graphics and compute queues, GPU captures will be visualized sequentially. It results in execution times that differ from runtime observations using stat commands. As we already mentioned, for profiling and optimization purposes, it is recommended to disable async compute. Understanding PIX's sequential visualization of GPU captures is essential for accurate analysis.
DefaultScalability.ini
When you verified your candidate CVars, profiled it and confirmed performance gains you can add them to DefaultScalability.ini
- Go to your projects Config folder <ProjectName>/Config/
- Create a new .ini file called DefaultScalability.ini
- Add new CVars to relevant scalability groups as presented in Engine/Config/BaseScalability.ini
- Now changing Scalability Group will also include newly added CVars
If you are planning to release your game for more than one platform then look at:
- Device Profiles in Lyra Sample
- Setting Device Profiles
- Customizing Device Profiles and Scalability for Android
Why is CPU optimization important for iGPU performance?
On mobile systems iGPU, NPU, and CPU share power. It means that power has to be well distributed between units. Better code gen means faster completion or the ability to run on lower frequencies. Lower CPU power requirements mean more power can be distributed to the iGPU, and that means higher iGPU performance.
Intel® Arc™ Gaming Technologies
Intel® oneAPI DPC++/C++ Compiler
It was briefly discussed in the previous chapter, but we want to emphasize it again. Starting with Unreal Engine* 5.4, support for ICX Compiler with Profile Guided Optimization (PGO) became available, and it can significantly improve your CPU performance.
ICX is a LLVM-based C/C++ compiler featuring Intel® custom optimizations, support for new vectorization standards, and low-overhead Hardware Profile Guided Optimization (HWPGO).
But why does switching compilers matter? Compilers apply various optimizations to your code during compilation, but in typical usage, they lack sufficient information for complex optimizations. Standard optimizations rely on flags, source code hints, and internal heuristics, enabling loop unrolling, inlining, and auto-vectorization. PGO enhances these heuristics with execution profiles from the control flow graph, enabling optimizations that wouldn't be possible otherwise: accurate inlining, conditional branch optimization, basic block reordering, and dead code separation. The process for capturing profiles and feeding them to the compiler is described in the link above.
To summarize:
- Use the ICX Compiler with profile-guided optimization to better optimize your games by delivering additional information to the compiler
- PGO on ICX can increase overall performance on CPU-bound workloads and improve power on GPU-bound ones.
- On systems with a shared power budget between the CPU and GPU, lowering the demands on the CPU with PGO can increase overall performance by allowing the system to give more power to the GPU.
- PGO on ICX works across all PC CPU hardware and vendors without any code changes.
NNERuntimeOpenVINO
This is our new Unreal Engine* 5 plugin developed in collaboration with Epic Games. The plugin provides an OpenVINO™ runtime for the Neural Network Engine (NNE) where NNE API calls get mapped to Intel® OpenVINO™ API calls. You can expect better performance, support for additional model formats, broader hardware support, and switching the underlying runtime by developing for the NNE API without changing existing code for running inference.
Intel® XeSS Plugin for Unreal Engine*
The Intel® XeSS Plugin for Unreal Engine* integrates Intel® XeSS technologies into Unreal Engine* 4 and 5. It's designed to be as easy to integrate as possible - a "plug and play" solution that delivers great visual quality without dealing with multiple CVars to achieve it. XeSS technologies are also optimized to maximize the utilization of our hardware.
Details about XeSS technologies, supported hardware, rendering APIs, and how they work are covered in the mentioned link. For the Unreal Engine* plugin specifically, documentation is included in the Documents/ folder with the downloaded plugin version from the GitHub repository.
One important note about XeSS-FG and compatibility with other vendor frame generation plugins: only one plugin can take effect due to the requirement for a swap chain provider override. This means during engine initialization, you need to initialize the correct vendor swap chain provider to use that vendor's Frame Gen technology. Integration details for these scenarios are covered in the XeSS Plugin documentation, but keep in mind that switching between different frame generation solutions at runtime isn't possible and requires a game restart.
Intel® XeSS Inspector
Intel® XeSS Inspector is a tool designed to simplify the validation and debugging of integration in applications. It supports all of our latest XeSS Technologies. You can read more about it here
Precompiled Shader Distribution
This technology aims to optimize launch times by downloading pre-optimized files from Intel® Cloud Storage, resulting in faster launch times and smoother gaming experiences in selected games. For battery-powered devices, this is particularly important as it saves power that would otherwise be used for compilation and dedicates it to longer gaming sessions instead. We'll cover more details about this technology next time.
Unreal Engine* 5 Optimization Tips
In this section, we provide generalized recommendations about specific Unreal Engine* 5 core technologies. We are not going to cover a thorough description of specific technology - it is already described in the documentation and was well presented on multiple Unreal Fests. Instead, we will briefly describe the technology and share our observations and overall recommended good practices about using specific technology.
Nanite
Resources:
Nanite is a virtualized geometry system for automated in-flight LOD generation. It is intended to improve high-density geometry performance and solve popping LOD issues. It is a heavily GPU-driven solution based on clusters, which group meshes into bins based on used materials to reduce the amount of draw calls. It also works really well with Virtual Shadow Maps to reduce page invalidations per frame.
However, for some meshes, the cost can be higher than traditional rasterization. You need to be aware of this and make sure your team understands it too.
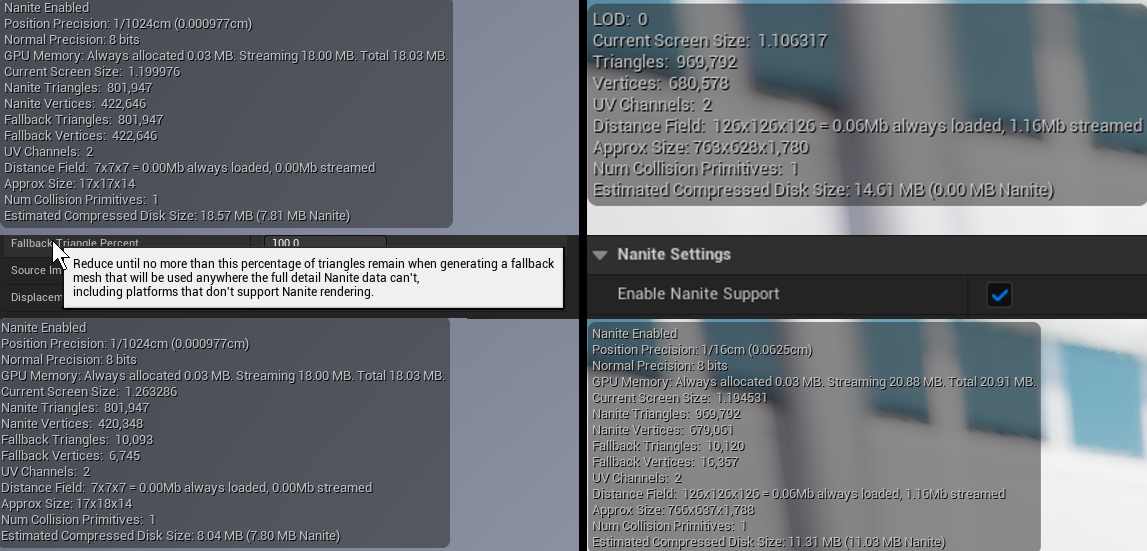
Before you dive deep into Nanite optimization, it's crucial to mention asset imports from FAB. Every asset you use should be verified. Many FAB assets are beautiful with all the details and often movie-quality, but they can be quite heavy for typical game usage. When importing assets, always verify meshes, materials, and blueprints. Common issues we've observed include:
- Importing complex meshes without enabling Nanite
- Not validating fallback meshes for Nanite meshes, often resulting in overly detailed fallback meshes used by other systems
- Using highly complex meshes for collisions (use LODs or import simplified meshes instead)
- Using too many materials with PDO that don't really benefit the scene (it runs on programmable raster)
- With Nanite, masked materials should usually be replaced by actual 3D models
- Overusing Programmable Raster in scenes (be aware of WPO and disable it at distance for VSMs too)
Another option to consider during early planning is supporting a dual pipeline - one with Nanite and one without. However, this requires additional work from your team during production, and in practice, from what we've observed, games tend to go either full Nanite or non-Nanite depending on their specific needs.
When optimizing Nanite, keep in mind that it consists of multiple passes. After you've verified your assets, most optimization efforts should focus on NaniteVisBuffer and NaniteBasePass.
- Use r.Nanite.ShowMeshDrawEvents/ r.EmitMeshDrawEvents to see more detailed information in ProfileGPU in Nanite::VisBuffer: SW / HW Rasterize
- Use nanitestats to visualize Nanite statistics
- Use r.nanite.visualize.advanced 1 to add additional view modes:
- Useful View Modes:
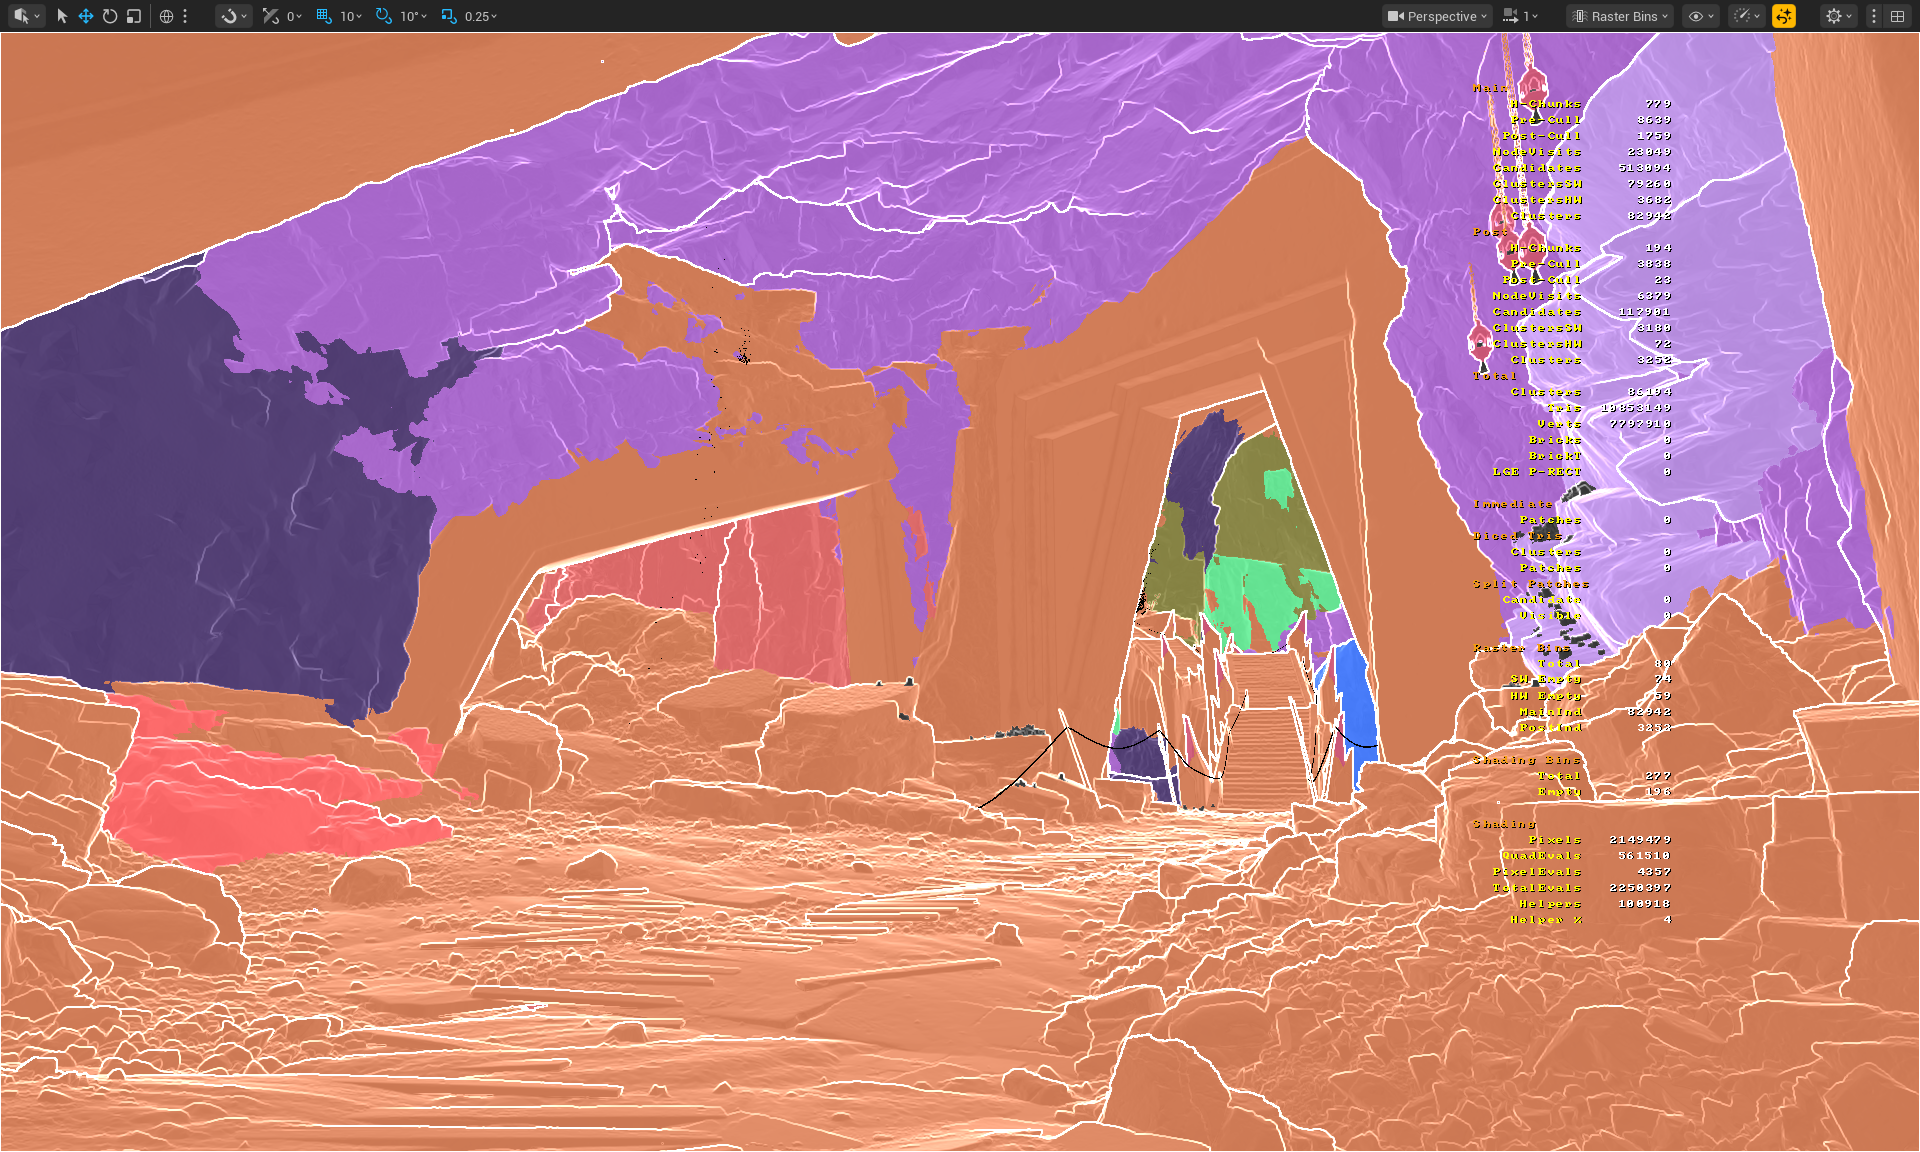
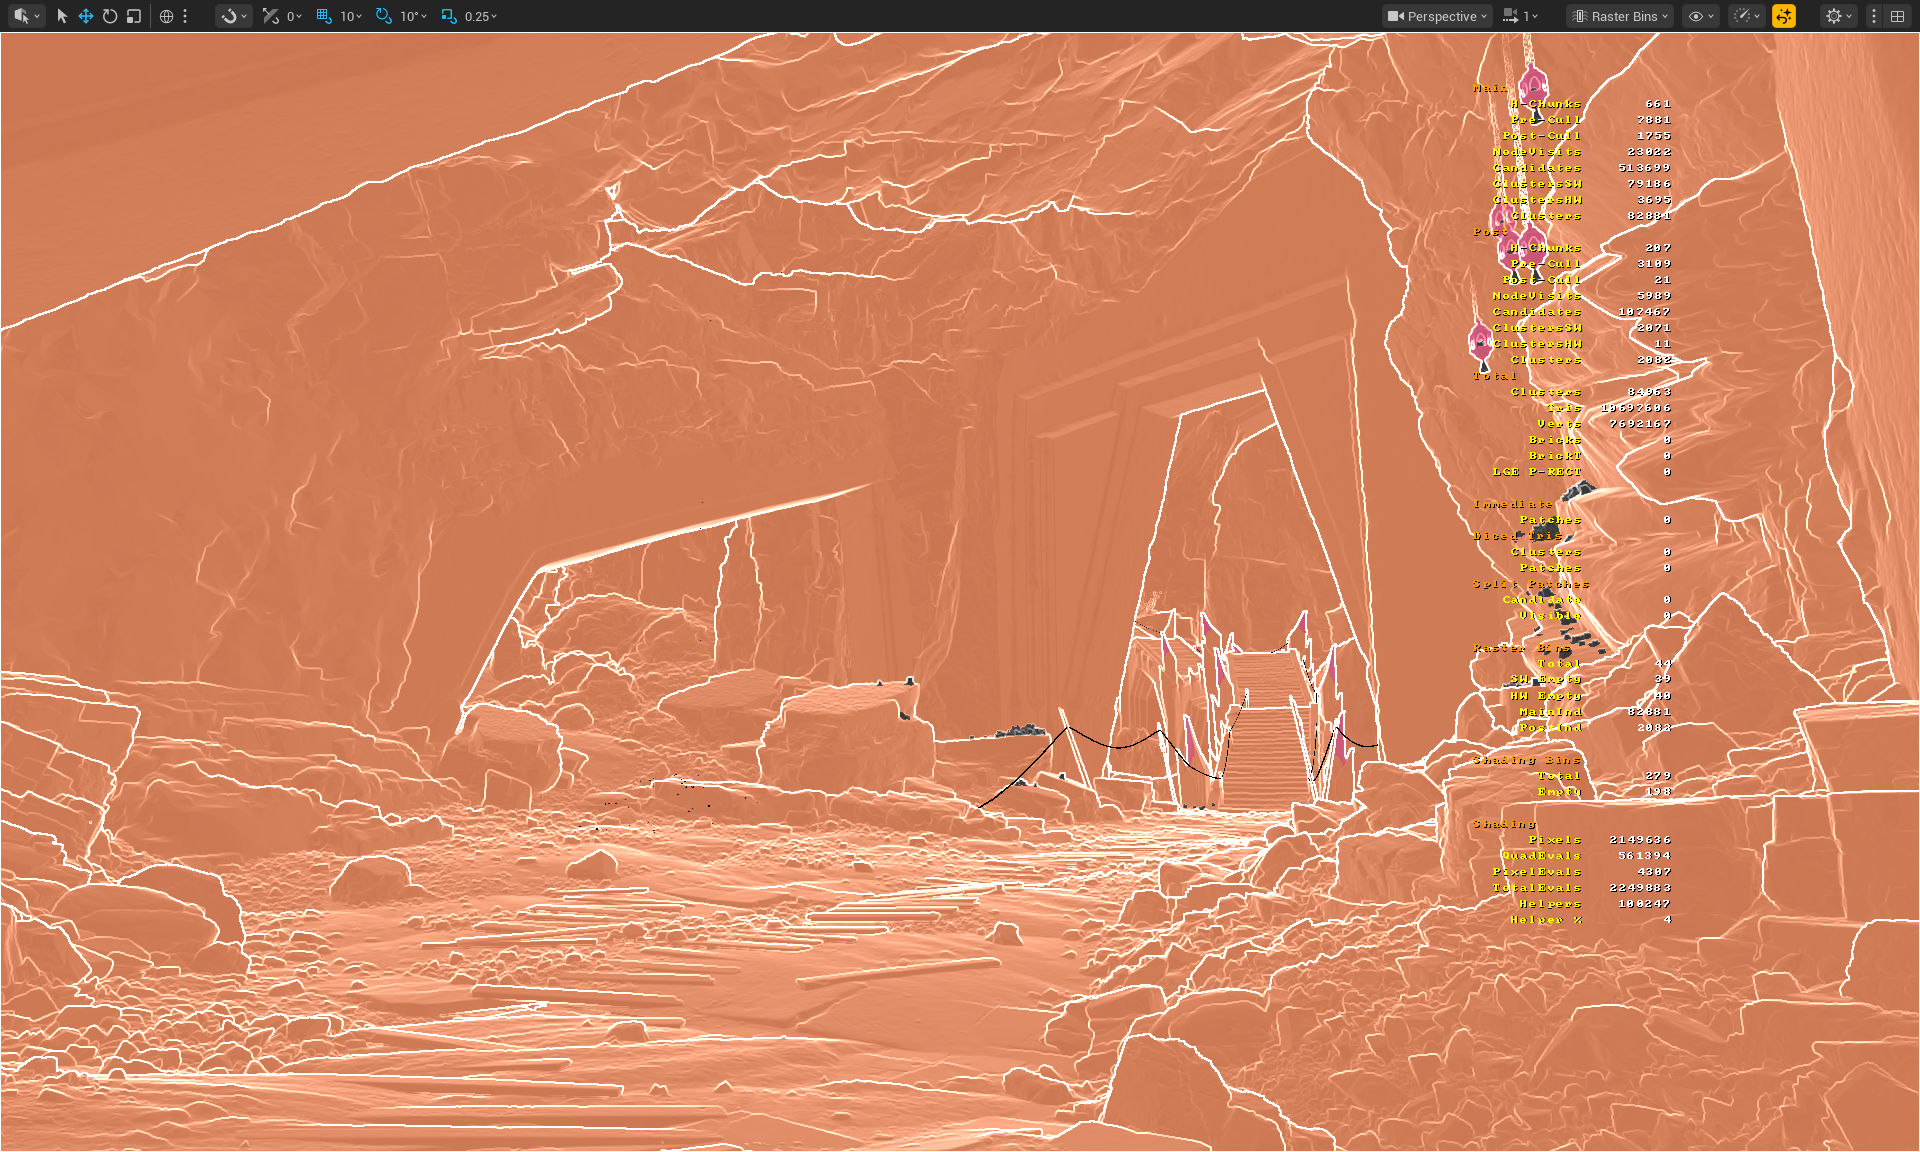
- Nanite Visualization > Raster Bins - Visualize geometry that shares the same rasterization properties and settings
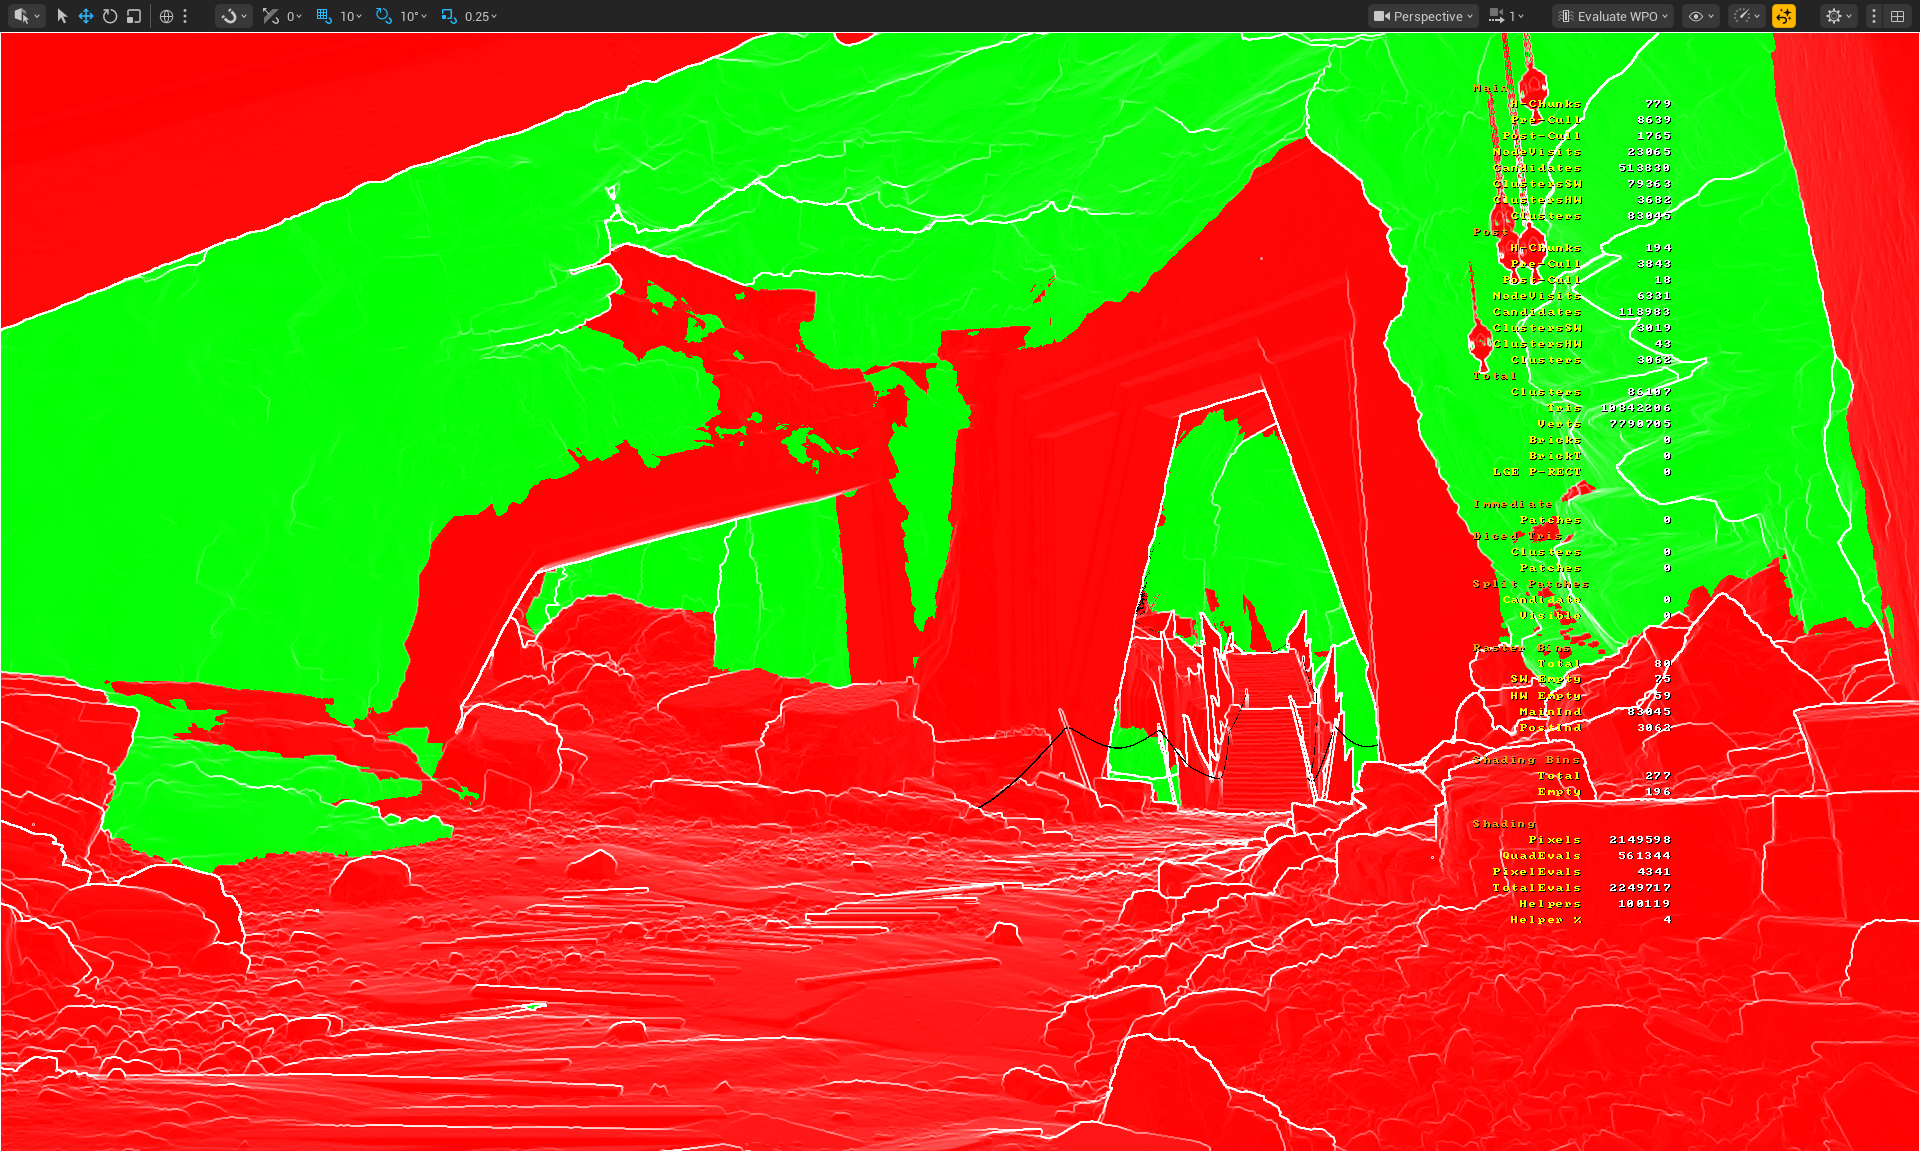
- Nanite Visualization > Evaluate WPO - Visualize whether specific materials use WPO
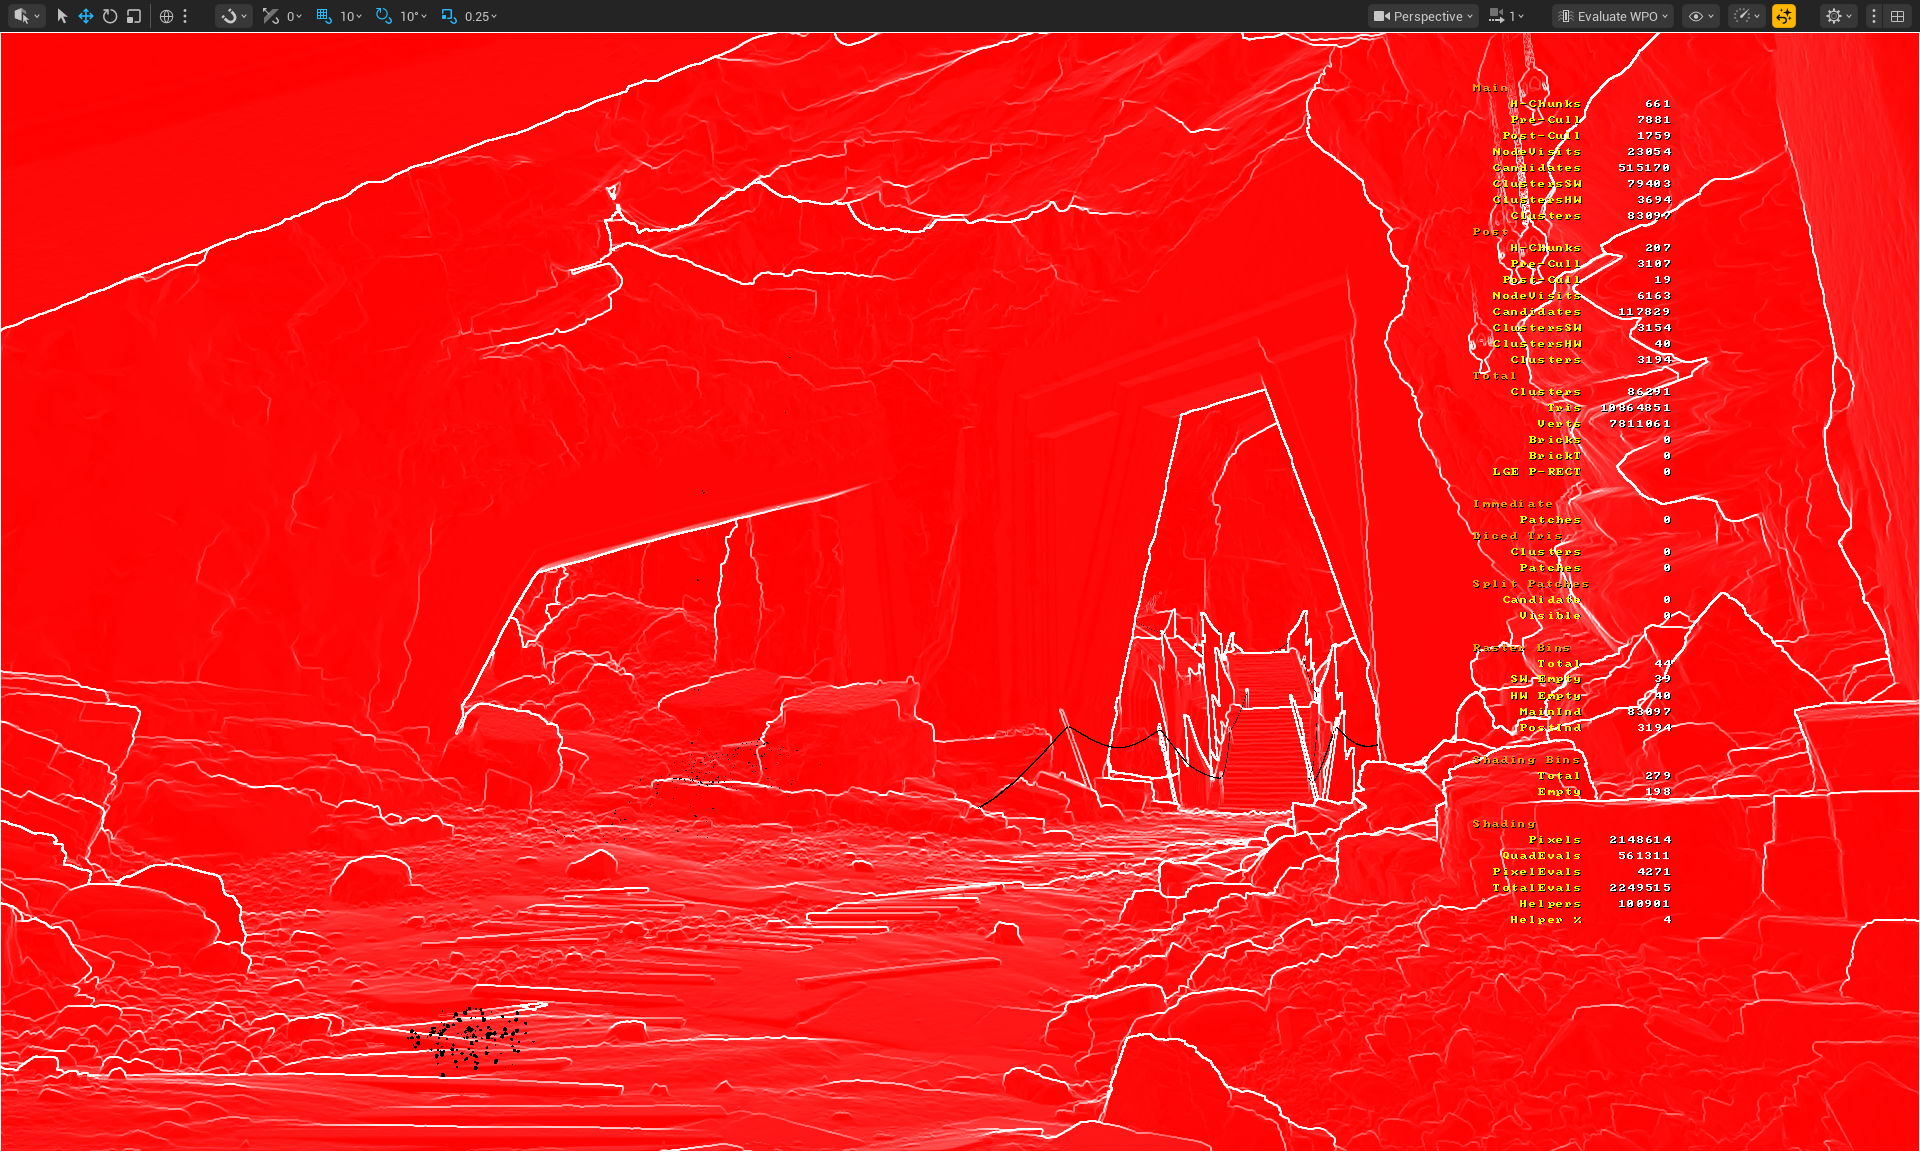
- Nanite Visualization > Pixel Programmable - Visualize whether assets are rendered using programmable raster or fixed function
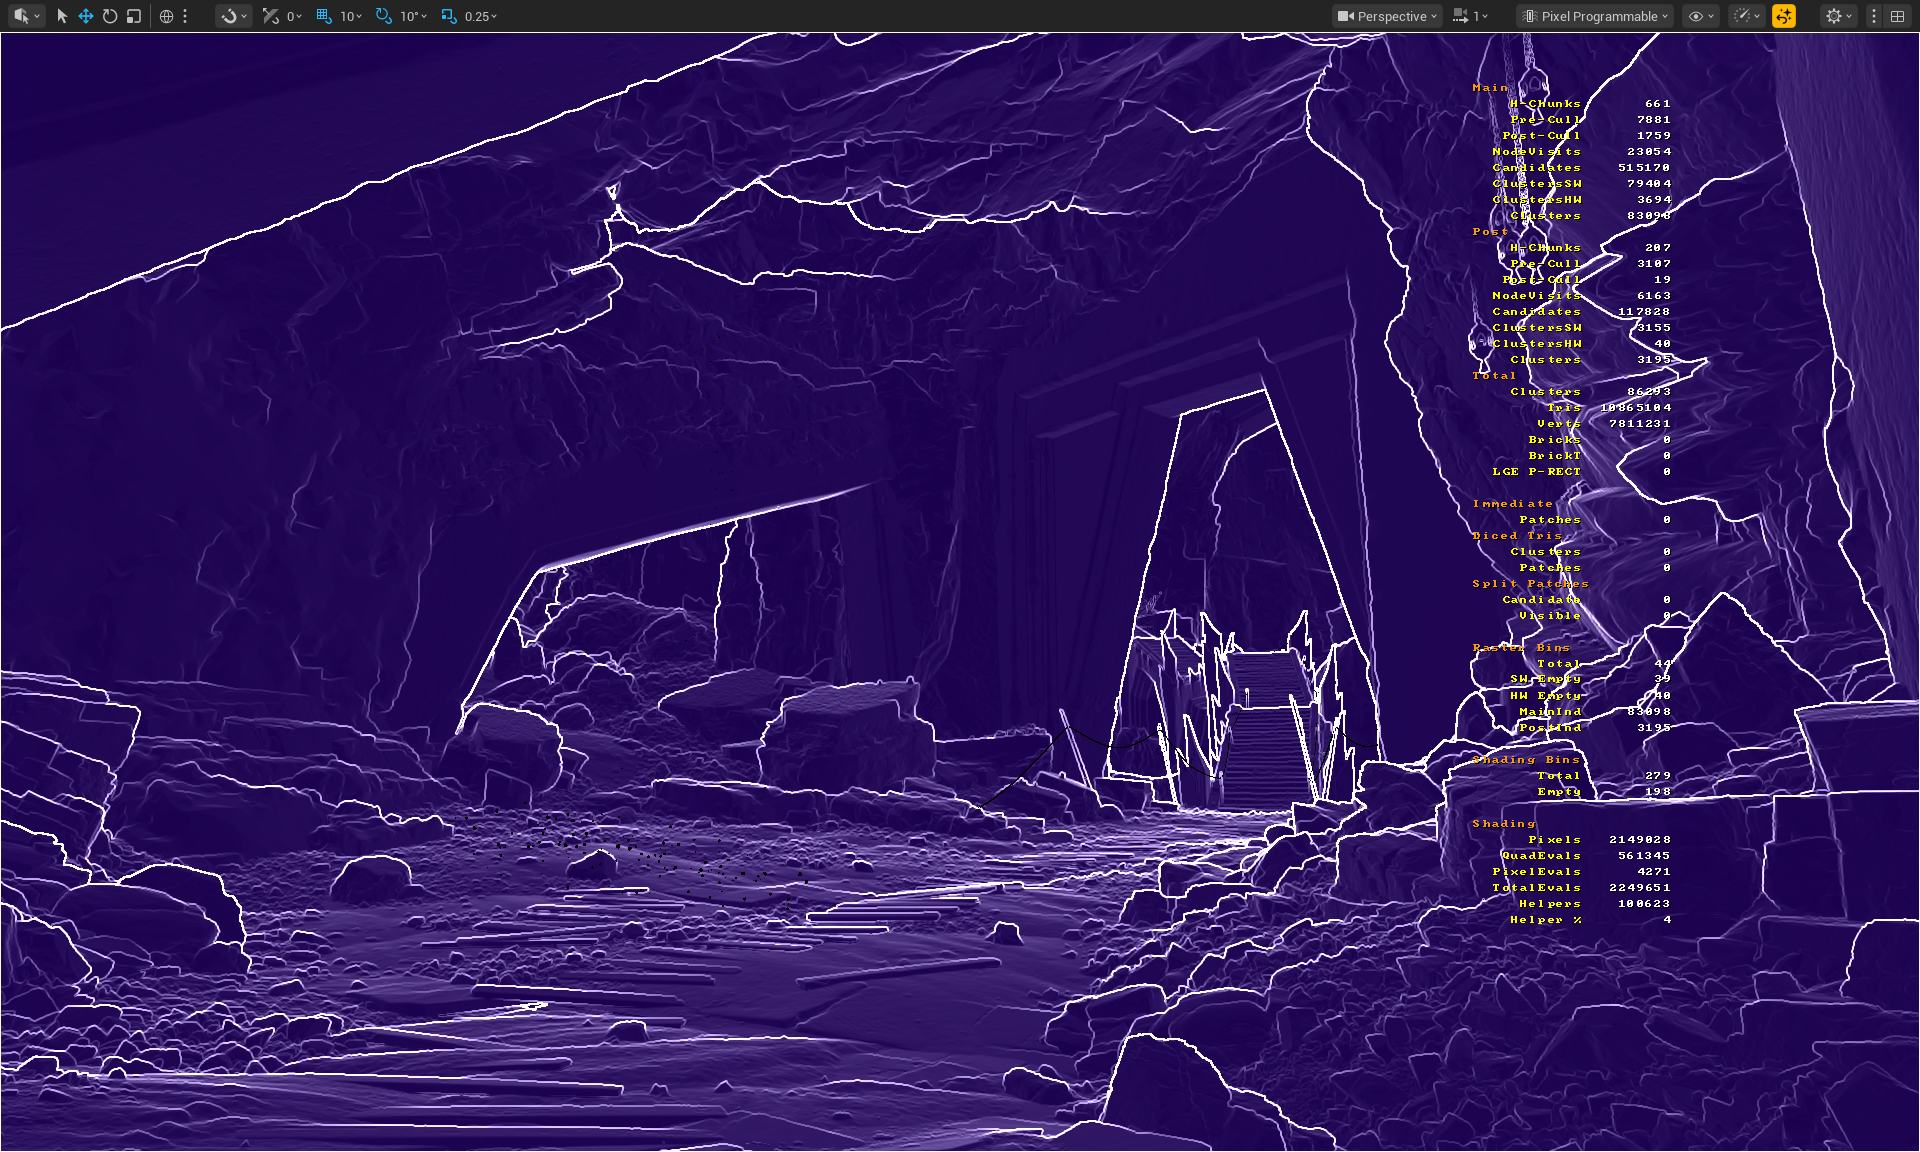
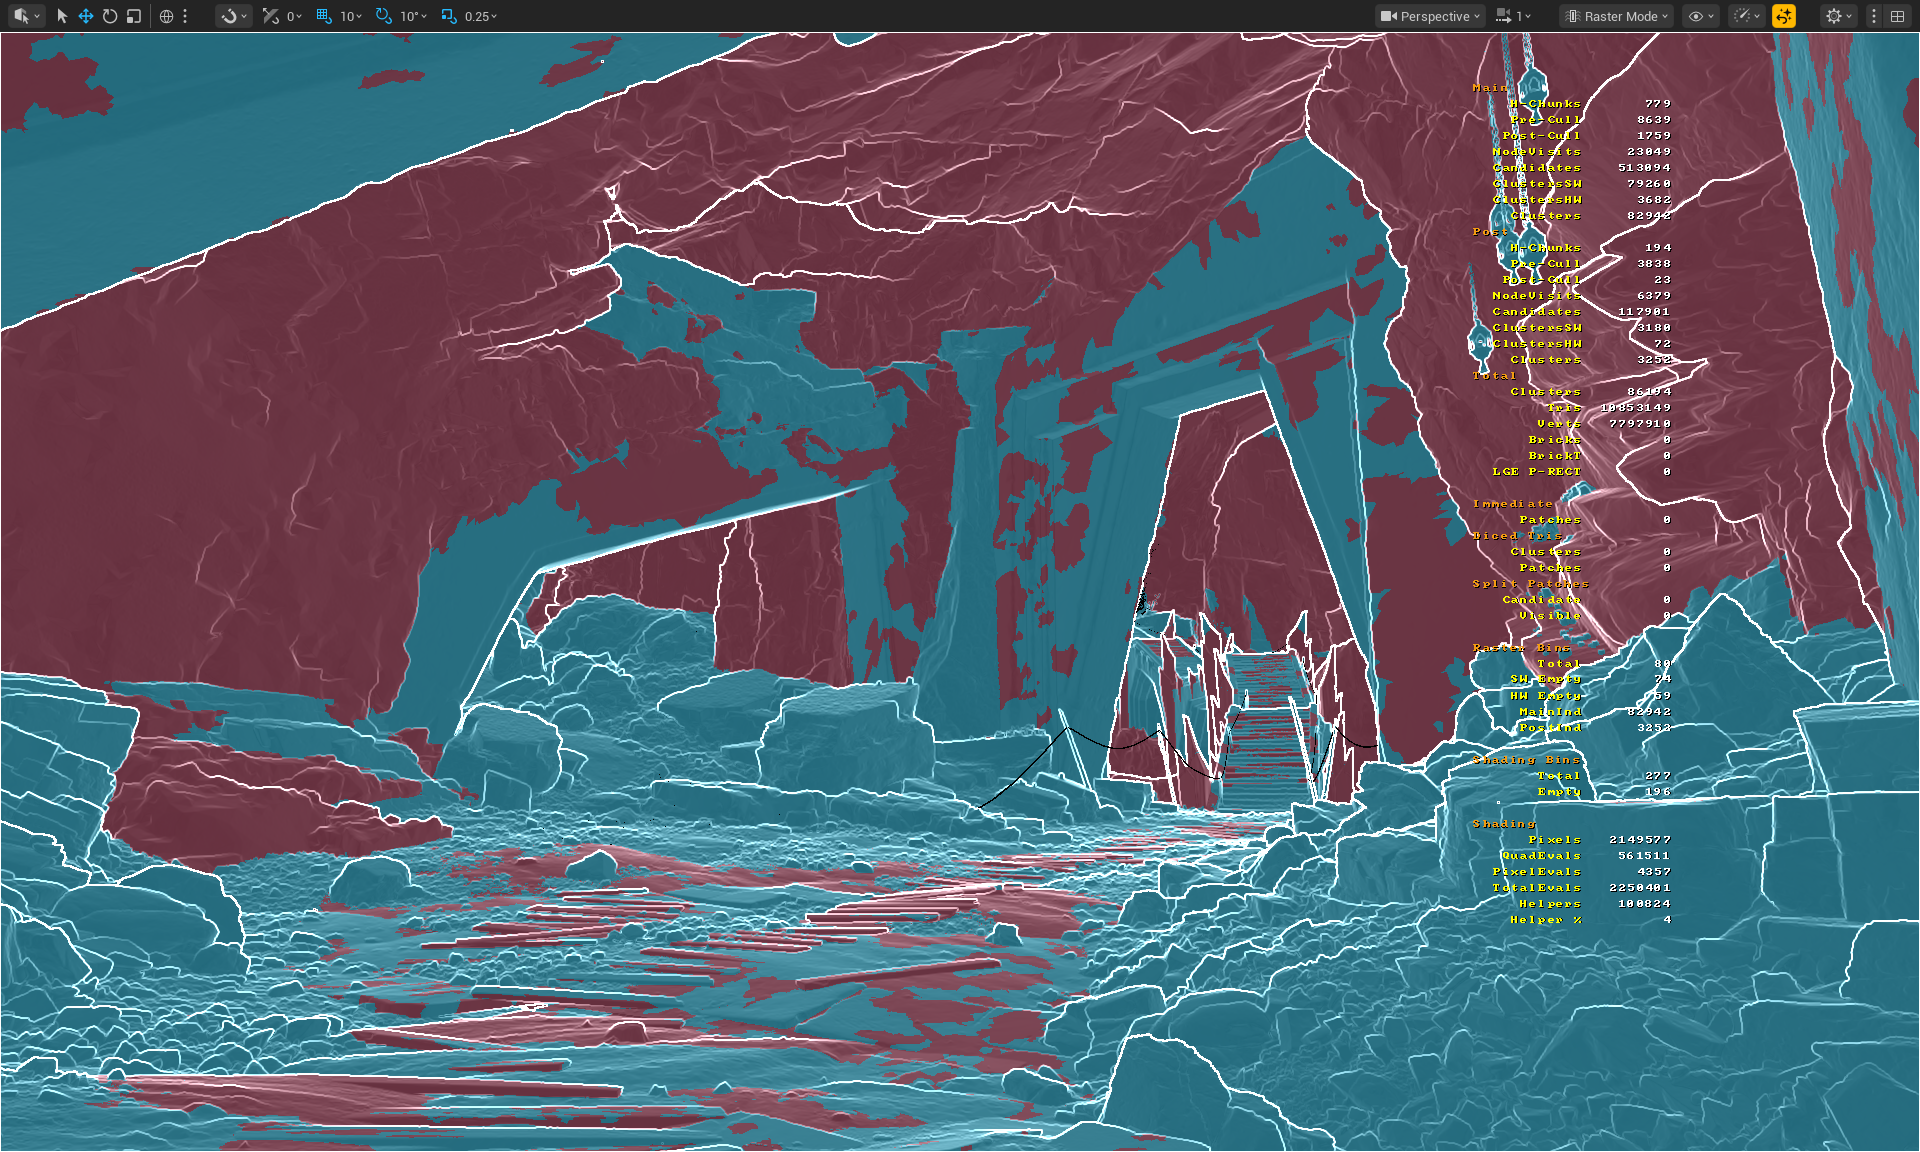
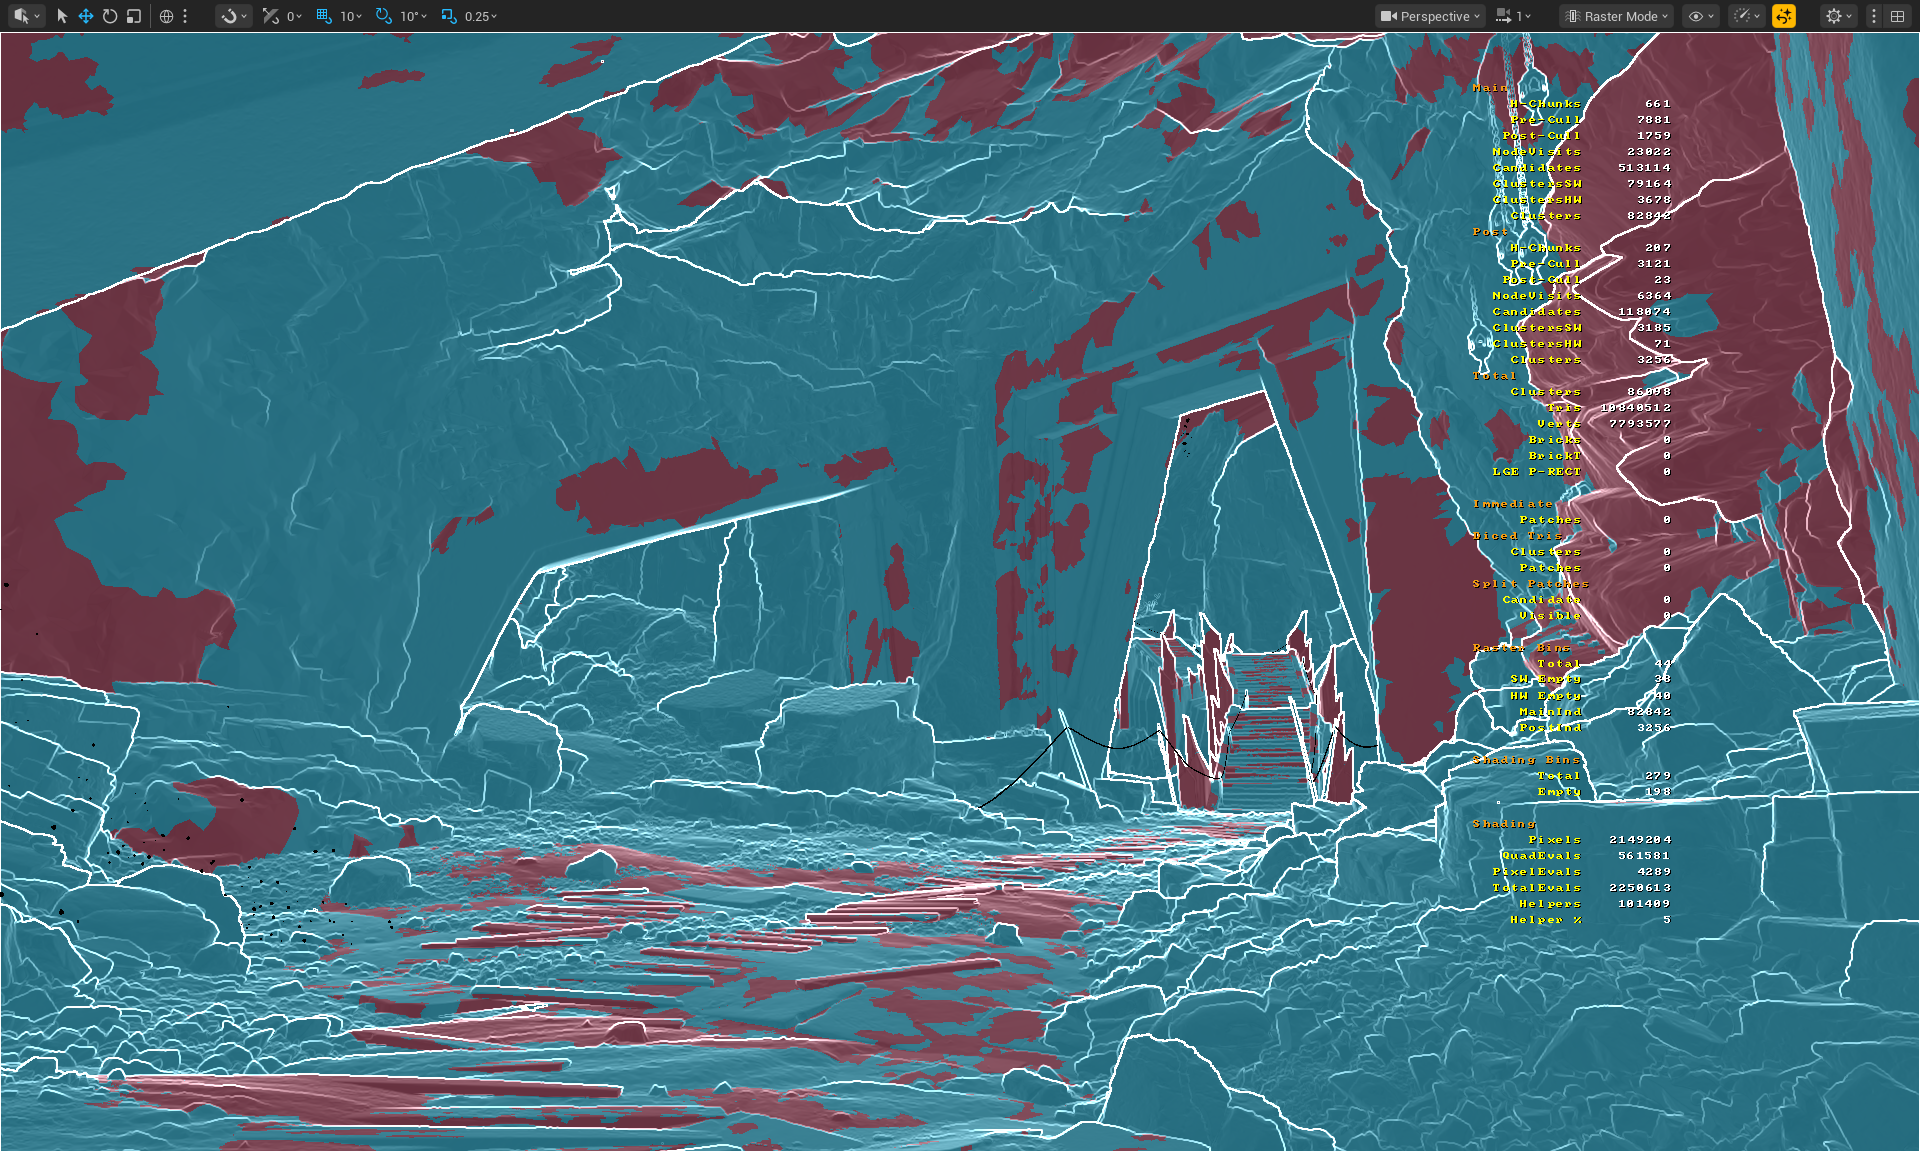
- Nanite Visualization > Raster Mode - Visualize whether SW Rasterize (CS) or HW Rasterize was used (MS/VS + PS) for which clusters
- Useful View Modes:
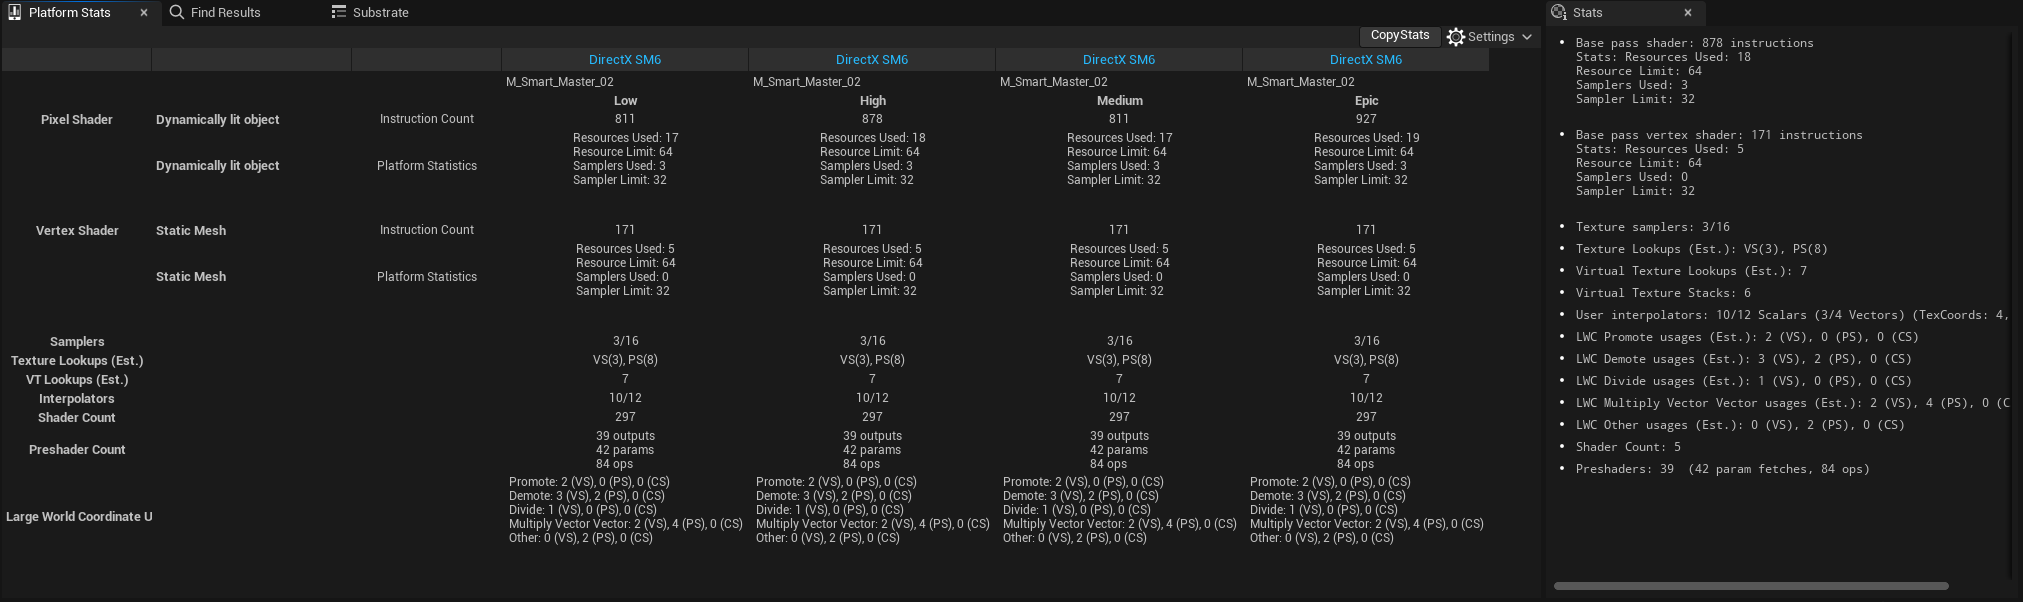
- Use platform stats in the material editor to verify material complexity
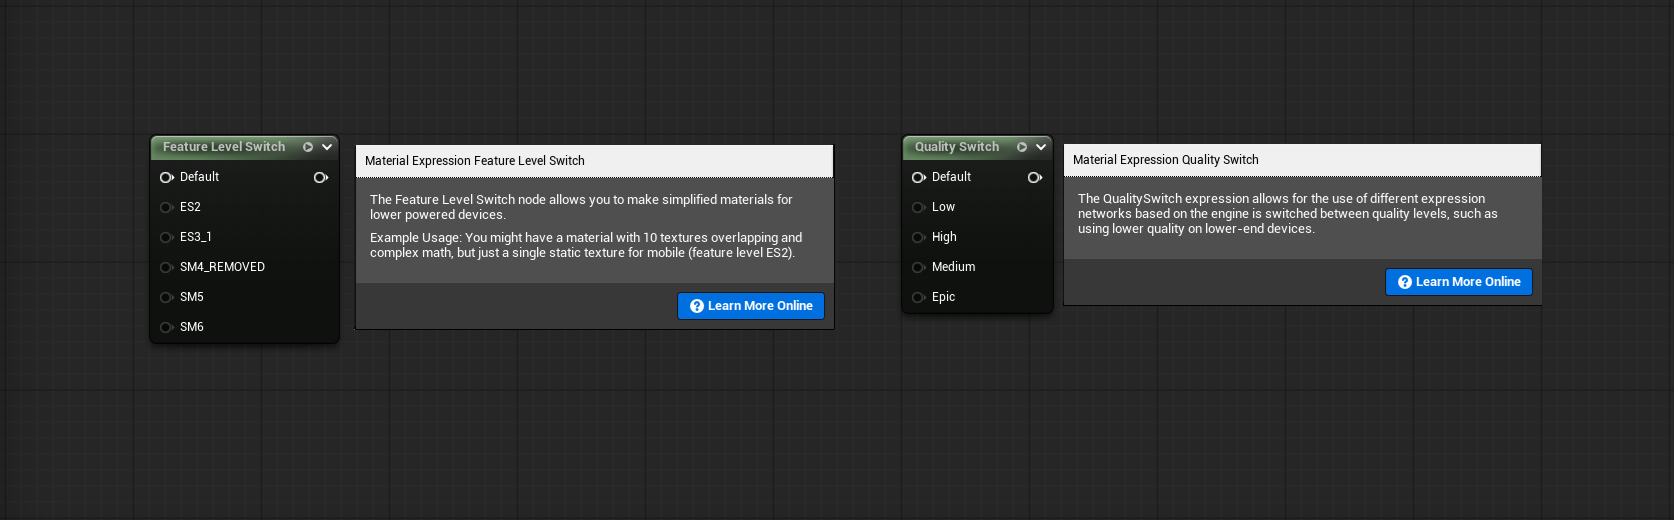
- Use Feature Level Switch if you support different renderer modes
- Use Material Switch to change material complexity with Quality Presets
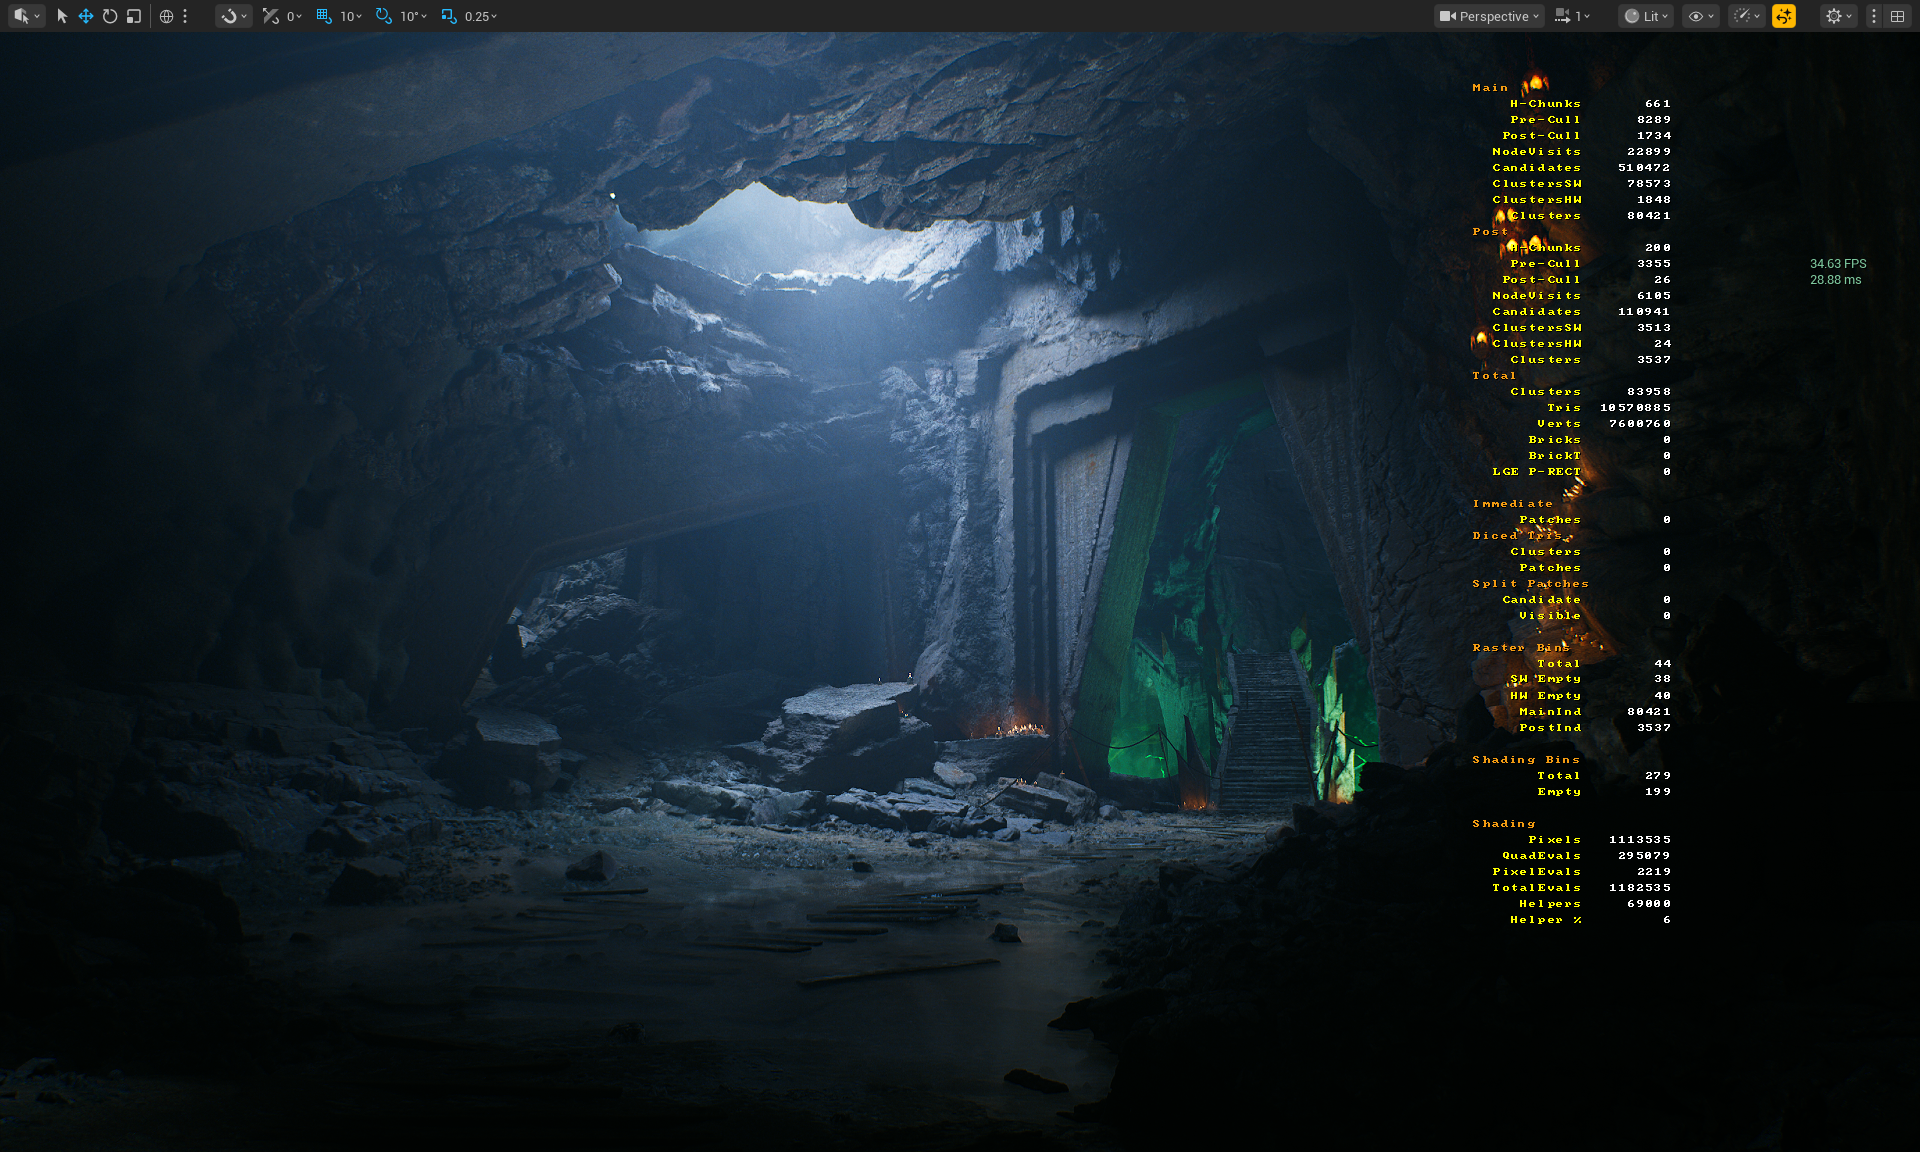
| Scene |
Dark Ruins UE 5.6.1 (camera 4) Preset High + TSR 87 Overused Pixel Programmable, Non-Nanite High Density Meshes |
Dark Ruins UE5.6.1 (camera 4) Preset High + TSR 87 Reduced Pixel Programmable, High Density Meshes Converted to Nanite |
|---|---|---|
| Lit |
|
|
| Raster Bins |
|
|
| Evaluate WPO |
|
|
| Pixel Programmable |
|
|
| Raster Mode |
|
|

NaniteVisBuffer
This is where Nanite figures out what it can see and what it needs to rasterize
Step-by-Step Analysis
- Identify whether your issues are related to Fixed Function (Opaque and Non-Deforming) or Raster Bin accumulation
- Raster Bins - groups geometry that uses the same rasterization properties and settings
- Can you reduce the number of Raster Bins?
- Raster Bins - groups geometry that uses the same rasterization properties and settings
- Identify whether your issues are related to Programmable Raster
- Evaluate World Position Offset (WPO)
- Use only when necessary. If you don't need it, turn it off
- Always set WPO Disable Distance in Static Mesh properties
- Pixel Depth Offset (PDO)?
- Is the effect crucial for your scene, or does it actually not make a huge difference and can be removed?
- Masked Materials?
- Can you create actual 3d models instead?
- Displacement / Tessellation
- Use only when necessary
- Tradeoff asset disk size vs runtime processing
- Evaluate World Position Offset (WPO)
- What if you have a lot of Opaque and Non-Deforming geo?
- Do the meshes overlap?
- Is there a lot of overdraw?
- Did you clean up your meshes before importing?
- Do you use hardened edges in your meshes?
- If yes, it can disable some fallback meshes optimizations
- Do you use hardened edges in your meshes?
NaniteBasePass
This is where it shades only visible pixels.
Use r.Nanite.ShowMeshDrawEvents/ r.EmitMeshDrawEvents to see more detailed information in ProfileGPU in Nanite::VisBuffer: SW / HW Rasterize and long specific draw took.
- Maybe your materials are just really expensive?
- Can you make them less expensive?
- Use Platform Stats in Material Editor to evaluate the complexity of your shaders, used samplers, etc.
- Have you implemented a quality switch for expensive materials?
- Can you make them less expensive?
- What is the number of shading bins?
- Shading Bins groups geometry that uses the same materials.
- Can you reduce it by reusing assets instead of using many different ones?
- Draw Calls = Total Shading Bins - Empty Bins
- Shading Bins groups geometry that uses the same materials.
Shader Optimization
Platform Stats
Available in the Material Editor on the top shelf, Platform Stats lets you preview material stats across different renderers and quality modes:
- DirectX SM6 - DX12 renderer that supports all new technologies
- DirectX Mobile (ES3_1) - DX12 Performance lightweight mobile renderer with limited hardware features and technologies
When working with complex materials, you can visualize stats for every quality mode and see how your material changes impact different modes and the final result. You can consider: reducing unnecessary complex math, sampler usage, using compressed texture formats, and lowering texture counts for lower quality modes. You can also consider avoiding programmable raster on low-quality modes and saving them only for High/Epic scalability instead. But before doing any of that, use high-frequency counters in PIX to analyze your shaders properly and find out what your shader's actual bottleneck is.
One thing worth mentioning is that optimizing shaders for instruction count can be unreliable. Different instructions have different cycle costs on the GPU, and looking at instruction count alone won't show you the additional cost of texture fetches or work executed in loops.
Feature Level Switch & Quality Switch
CVars Tweaking
As described in previous sections, when dealing with specific system optimization, it's worth knowing the relevant CVars. Use Log to dump all available CVars for Nanite to get familiar with them. When optimization through content and used techniques isn't enough, it's worth looking at CVars and considering whether they can be included in scalability groups to be managed by specific presets.
As an example, let's look at Nanite CVars. There are two paths that Nanite can choose for rasterization:
Software SW - Dedicated to really small triangles
Hardware HW - Dedicated for bigger triangles or more traditional rasterization
The correlation between them is really important and sometimes allows you to squeeze out the last bits of performance - especially on iGPUs. We can modify them by adjusting these CVars:
r.Nanite.MaxPixelsPerEdge
- The triangle edge length that the Nanite runtime targets, measured in pixels (default 1)
- Higher value = more HW rasterization, less SW rasterization, less clusters, less details in view distance
- Lower value = more SW rasterization, less HW rasterization, more clusters, more details in view distance
r.Nanite.MinPixelsPerEdgeHW
- The triangle edge length (screen-space) in pixels at which Nanite starts using the hardware rasterizer (default 32)
- Higher value = more SW rasterization, less HW Rasterization
- Lower value = more HW rasterization, less SW Rasterization
Lumen
Resources:
Lumen is Unreal Engine* 5's global illumination and reflections system. Lumen quality is set by the Global Illumination and Reflections scalability groups in BaseScalability.ini. Lumen consists of three most important passes: Lumen Scene Lighting, Lumen Screen Probe Gather, Lumen Reflections - all of them are highly configurable. We recommend familiarizing yourself with the Project Settings and available CVars.
Lumen supports Software Ray Tracing (SWRT) and Hardware Ray Tracing (HWRT) modes. When the GPU does not support Hardware RayTracing, Lumen will automatically fall back to SWRT. Note that the SWRT path has not been actively developed for a long time, as Epic Games has focused efforts on optimizing the HWRT path. Starting with UE5.5, HWRT is the default and recommended path, and as of UE5.6, SWRT detail traces have been deprecated.
Focusing only on the HWRT path streamlines your workflow by eliminating the need to choose between SWRT and HWRT paths or attempt to support both simultaneously while balancing settings, which previously required additional effort.
By default, Lumen is enabled for High and Epic quality settings, and it is already well-optimized and configurable. However, by adjusting CVars in BaseScalability.ini, you can optimize it even further for your specific case. If you want to streamline your workflow even more, you can consider enabling it on Medium quality with reduced settings.
Lumen Reflections
Regarding the Lumen's Reflections pass, we recommend experimenting with r.Lumen.Reflections.MaxRoughnessToTraceClamp, which is not included in BaseScalability.ini by default. Ensure your artists are informed about this parameter being added, as it clamps the maximum roughness value for which Lumen traces dedicated reflection rays. You can start with 0.4 value and adjust to your needs.
Based on our experiments and performance observations in some cases Enabling Async Compute for Lumen Reflections (r.Lumen.Reflections.AsyncCompute=1) may be beneficial. But as always we do recommend to profile and validate!
Summary
That concludes the second chapter of Unreal Engine* Optimization Guide. At this point, you should:
- Be aware of the most common issues observed on the iGPU,
- Know how Engine Scalability Settings work,
- How to verify specific CVars impact on performance
- Be aware that CPU optimizations can improve iGPU performance,
- That system power plans can impact not only your performance but also benchmark results
- That used compiler and profile-guided optimization takes important role in your project performance optimization
- That XeSS technologies can help you deliver better and more stable performance
- Nanite and Lumen recommended practices
References
Unreal Engine*
Unreal Performance Optimization Learning Path
Level Streaming Hitching Guide
Profiling with Purpose
New GPU Profiler and RHI Submission Pipeline
Intel®
ICX Compiler
XeSSInspector
XeSSUnrealPlugin
OpenVinoUnrealPlugin
PresentMon
Dark Ruins Nanite's performance experiments were measured on:
- Intel® Core™ Ultra X9 388H with Intel® Arc™ B390
- 32 GB RAM
- OS Version 26200
- Driver 101.8362
- Ultimate Performance Mode