How to collect Tasks Overview analysis
-
Before collecting data, set the following environment variable to enable the technical preview:
export AMPLXE_EXPERIMENTAL=tasks-overview -
Collect Profiling Data as per your use case, you can collect data using either the command line or the GUI:
-
Command line:
vtune -collect xpu-offload -- <path-to-app> -
GUI: Select XPU Offload from the GUI configuration panel and ensure the experimental feature is enabled.
-
-
Once Finalization is complete, Use result groupers to observe Tasks per GPU or per compute API type
If opening a previously collected result, ensure the environment variable is set first and switch the result viewpoint to "Tasks Overview".
Additional Features for Understanding the Results
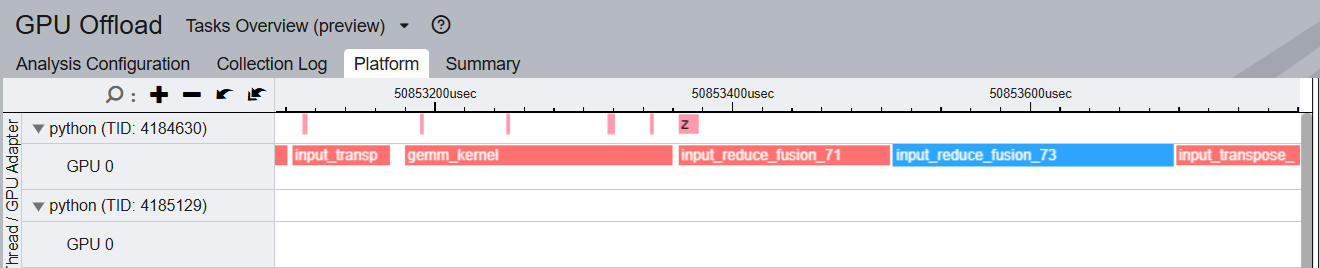
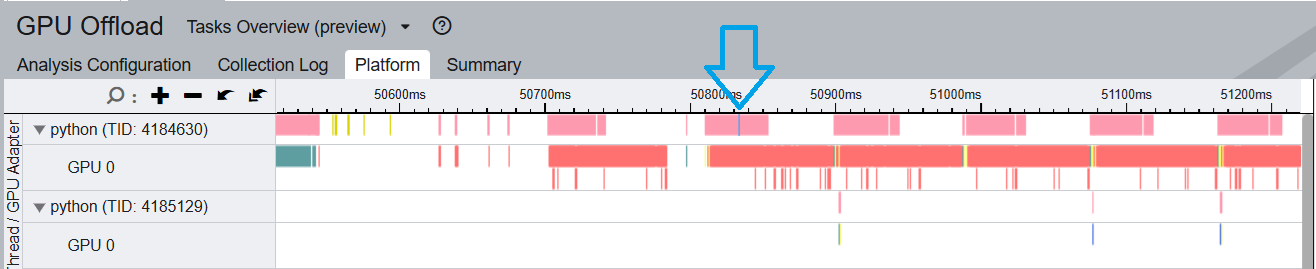
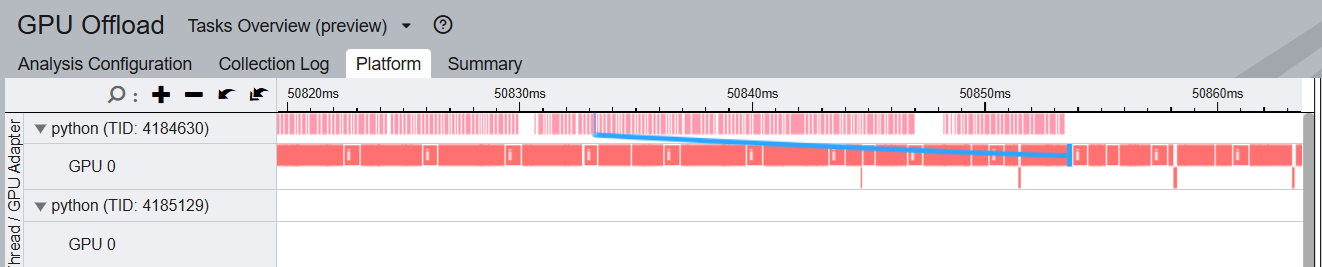
Visualizing Task Connections
- The timeline now displays connection lines between related CPU and GPU tasks, helping you trace the flow of work across the system.
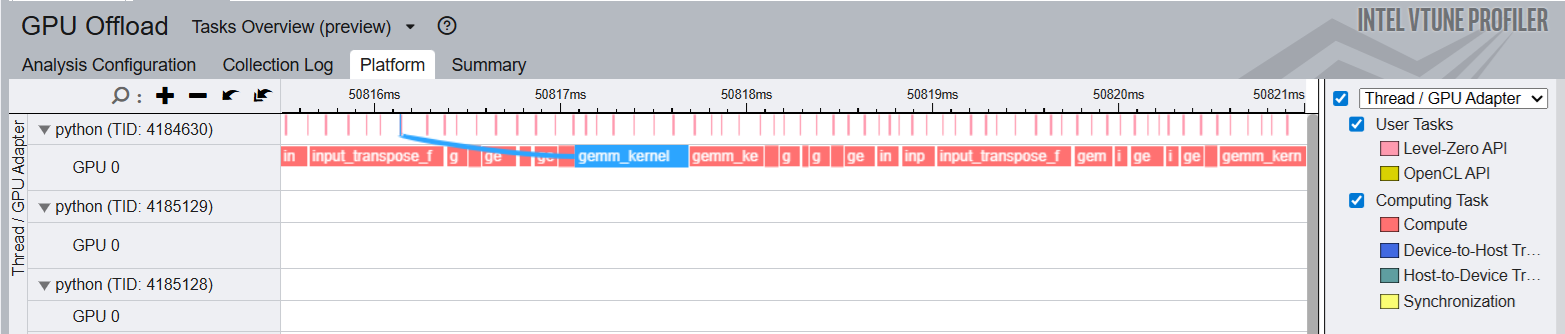
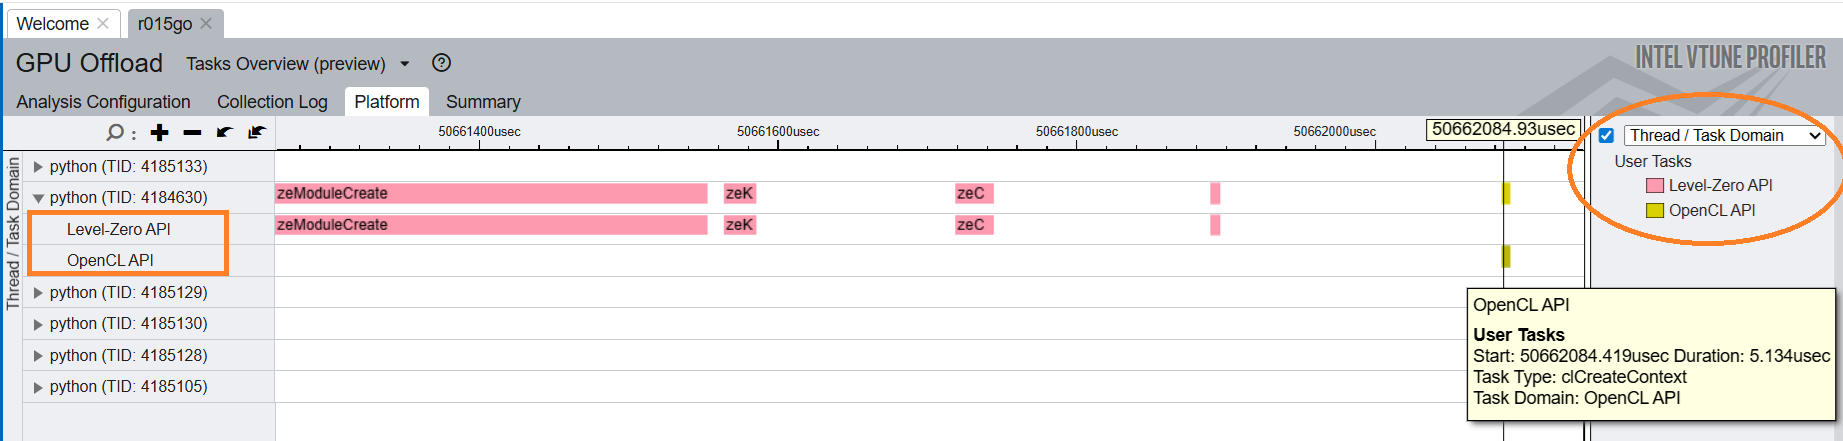
- The new Thread/Task Domain grouping allows you to see which threads are responsible for which types of API tasks (e.g., L0, OpenCL, oneDNN), making it easier to analyze mixed workloads.
Using Groupers and Filters
- Groupers:
Use groupers to filter and focus on specific GPUs, APIs, or thread domains. This is especially useful for complex workloads with multiple devices or APIs in play. - Tooltip Details:
Hover over tasks for detailed information, including execution time, task type, and, for data transfers, transfer size.
Performance and Data Size
- The Tasks Overview analysis is much faster and produces smaller result files (e.g., 135MB vs. 1.4GB in previous methods).
Known Limitations
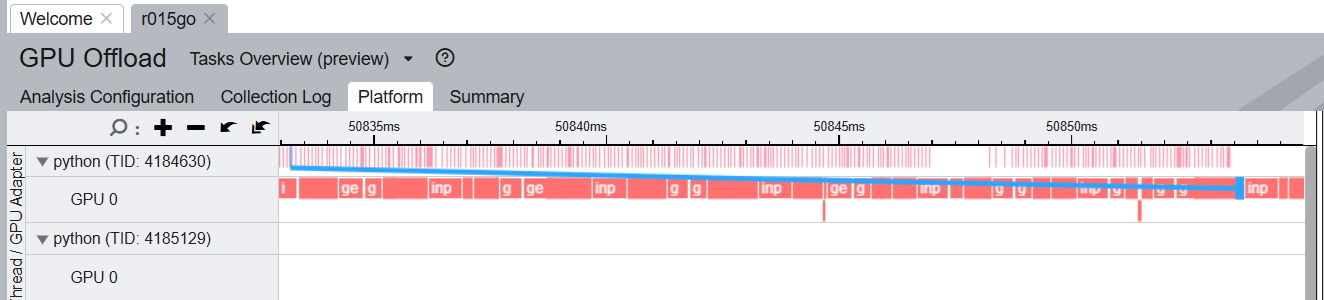
Zooming Artifacts:
- Connection lines for very small tasks (1-pixel wide) may not display when zoomed out, but reappear when zoomed in.
- Connections to tasks outside the visible screen area are not shown until you zoom out to bring them into view.