In the development of real-time rendering graphics, shader code becomes increasingly complex, so simple development and debugging methods based on experience and trial-error can no longer meet actual needs. The debugging tool plays a critical role in shader debugging and is important in graphics development.
Bgfx is an excellent cross-platform and abstract rendering engine that encapsulates most mainstream graphics APIs. As an example, this article demonstrates the use of Microsoft Visual Studio* and RenderDoc to debug DX11 shader code in bgfx on the Windows* platform.
Preparation
- Clone bfgx source code
git clone git://github.com/bkaradzic/bx.git git clone git://github.com/bkaradzic/bimg.git git clone git://github.com/bkaradzic/bgfx.git - Use GENie to generate a Microsoft Visual Studio* project file containing examples and tools
cd bgfx
..\bx\tools\bin\windows\genie.exe --with-tools --with-examples vs2017
We can get more information about project generation through the --help command line parameter.
Open bgfx.sln with Visual Studio 2017 in the generated bgfx/.build/projects/vs2017 directory. We see in Figure 1 that the sample and tool projects are already in our Visual Studio solution.
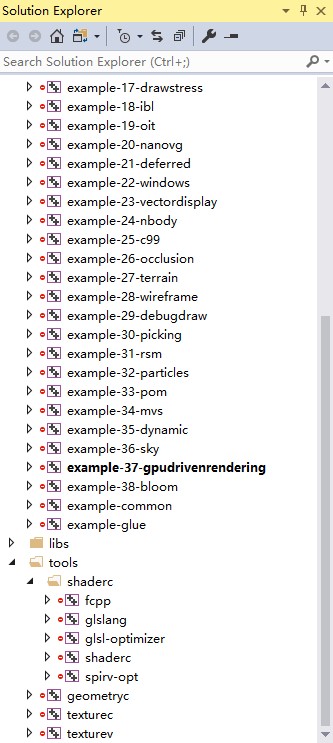
Figure 1. Some of the many examples and tools included in the Visual Studio project file
The example-37-gpudrivenrendering project, the basis of this article, uses compute shader. Our debugging will focus on it. Another project, the folder labelled shaderc, features the bgfx shader compiler responsible for compiling the bgfx shader source into shader binary for a target API runtime.
Next, build the project in Visual Studio. Then, find all the compiled sample programs and shaderc.exe in the bgfx/.build/win64_vs2017/bin directory. Select debug mode in Visual Studio to see Debug appended to the name of each generated application (Figure 2).
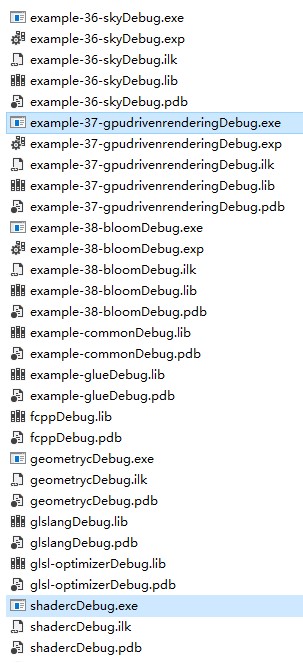
Figure 2. The two applications (highlighted in blue) we’ll be working with in this article as they appear with debug mode selected.
Test the “example-37-gpudrivenrendering” Sample Program
We can’t directly double-click to start the target sample program, because we need to specify the program startup directory to the bgfx/examples/runtime directory. That directory contains resource files the application needs to load. It’s much easier to debug in Visual Studio, because the working directory for debugging has already been set in the project settings (Figure 3).

Figure 3. Properties>Debugging, \examples\runtime is already set up in the Working Directory.
If all goes well, we will see the screen in Figure 4 when we run the example.
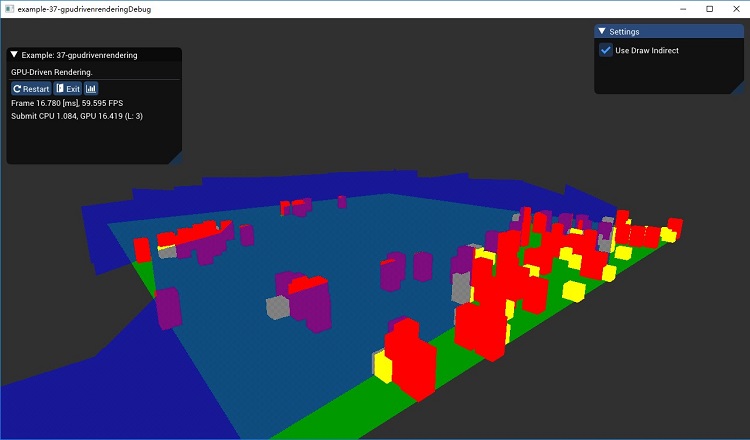
Figure 4. Example-37-gpudrivenrenderingDebug running
Recompile DX11 Shader
By default, the bxfx DX11 shader file is under bgfx/examples/runtime/shaders/dx11. That said, these shader files with the suffix .bin do not contain debugging information and have already been optimized. There’s no need to debug them, so we need to recompile these DX11 shaders, give shader debugging information and disable optimizations so that we can see more useful information in the debugging tool. We’ll use the cs_gdr_downscale_hi_z shader as an example for debugging.
Set the current directory to bgfx/src
The reason the current working directory is set to the src directory is because the common shader source files included by the shader compilation are also in this directory. Without this step, the shaderc will not find these public shader files.
cd bgfx/src
Use the following command to compile the shader that needs to be debugged.
..\.build\win64_vs2017\bin\shadercDebug.exe -f ..\examples\37-gpudrivenrendering\cs_gdr_downscale_hi_z.sc -o ..\examples\runtime\shaders\dx11\cs_gdr_downscale_hi_z.bin --type c -p cs_5_0 --platform windows --debug -O 0Where:
- ShadercDebug.exe refers to the shader compiler for bgfx. Because the debug version is used in the example, it is suffixed with Debug.
- cs_gdr_downscale_hi_z.sc refers to the source code of the compute shader in our test.
- cs_gdr_downscale_hi_z.bin is a compiled binary.
- --type c compiles the target into a compute shader.
- -p cs_5_0 generates a shader with compute shader profile 5.0.
- --platform windows designates the Windows platform.
- --debug -O 0 selects debug mode and disables optimization.
Shader Debugging with Microsoft Visual Studio*
In the opened bgfx project, select Debug>Graphics>Start Graphics Debugging (Figure 5) to launch the example-37-gpudrivenrendering sample program with the graphical debug mode.
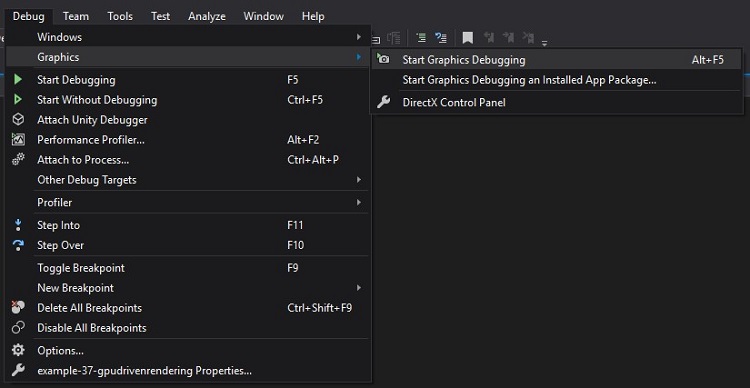
Figure 5. From the Debug tab, select Graphics and then Start Graphics Debugging (or press Alt+5) to start the sample project.
In the diagsession view (Figure 6), we can capture a graphic frame by clicking any of the Capture Frame buttons or by clicking the Print Screen button on the keyboard in the game window.
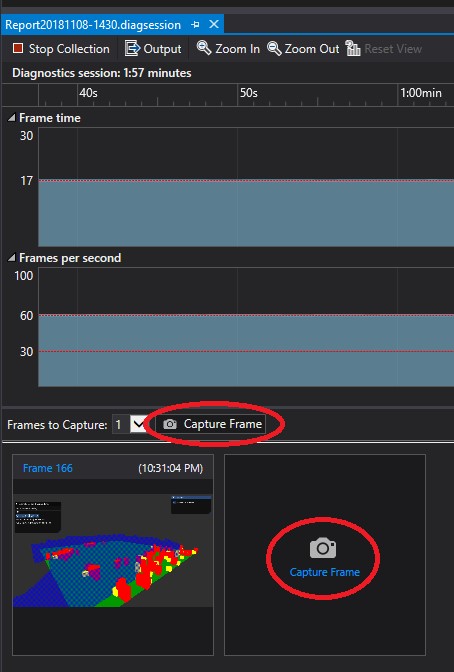
Figure 6. Click Capture Frame (circled in red) or Print Screen on the keyboard to collect frames of interest.
Close the render window or click the Stop Collection button to stop the collection. Double-click the thumbnail to open the captured frame, and see it opened in the Graphics Analyzer (Figure 7).
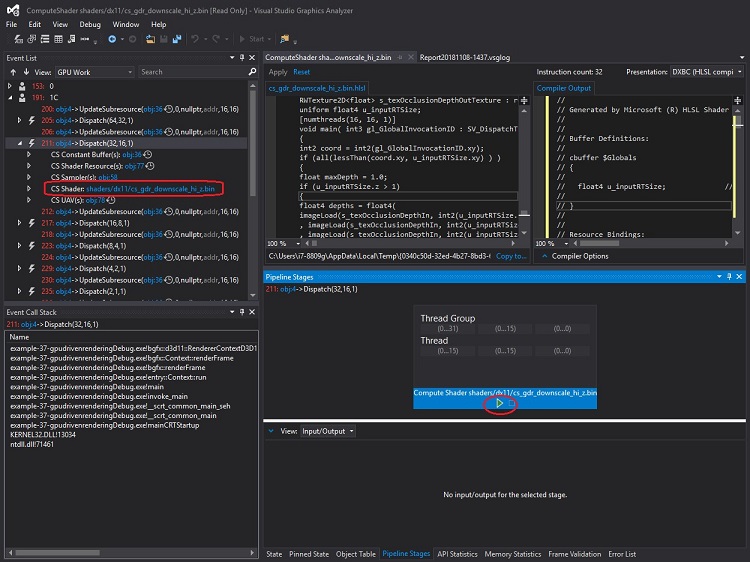
Figure 7. The Graphics Analyzer Event List, Call Stack, Pipeline Stages, and other panels
We can see different panels, and the most important ones include Event List, Call Stack, Pipeline Stages, Object Table, and so on. Select a compute shader related Dispatch interface event in the Event List, and select CS Shader in the expanded sublist. Since we compile in debug mode, the source code of the target shader will be displayed in the opened source panel.
Next, we can start debugging the shader by clicking the green debug arrow (above, circled in red) under the target shader. We can debug the shader as we normally do in the Visual Studio. We can Step Into (F11), Step Over (F10), Step Out (Shift + F11), and watch the values of the variables.
Use RenderDoc for Shader Debugging
RenderDoc is a powerful open source graphics development and debugging tool. Download the latest version of RenderDoc from https://renderdoc.org/, and install it for later use.
Launch gpudrivenrenderingDebug.exe in RenderDoc as shown in the Figure 8. Be sure to set Working Directory to the examples/runtime directory. Click Launch to run the gpudrivenrendering program.
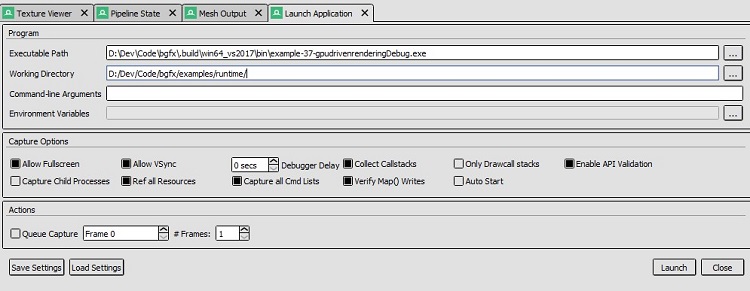
Figure 8. Use RenderDoc to launch example-37-gpudrivenrenderingDebug.exe by entering its path and working directory in their respective fields.
With your cursor positioned in the running gpudrivenrendering window, press F11, and grab a graphics frame. Double-click the newly generated preview to open the frame (Figure 9).
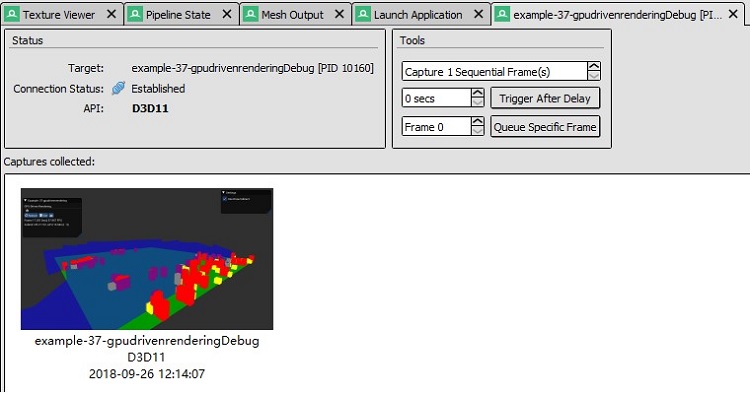
Figure 9. A captured frame displayed under the Captures Collected: section
In the opened frame, click steps 1, 2, 3 as shown in the Figure 10 to enter the compute shader debugging mode. We can check disassembly (Figure 10B) or HLSL (Figure 10c), as well as variables, registers, constants, and resources. At this point, we can move on with the debugging.
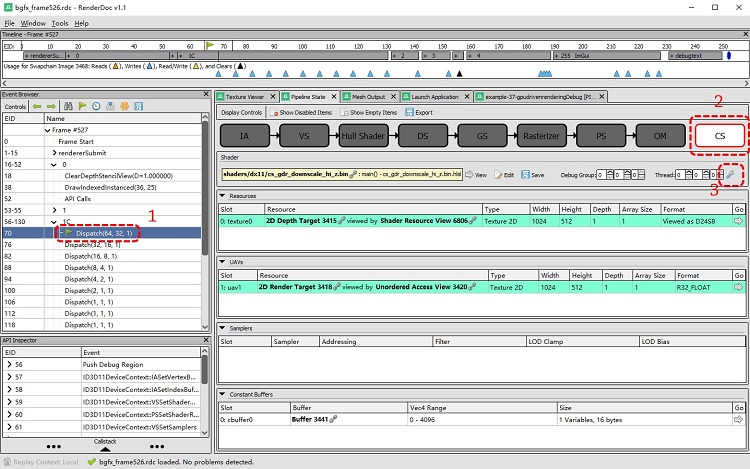
Figure 10a. Click Steps 1, 2, and 3 as shown in sequence to enter compute shader debugging mode.

Figure 10b. Use this tab to check disassembly.
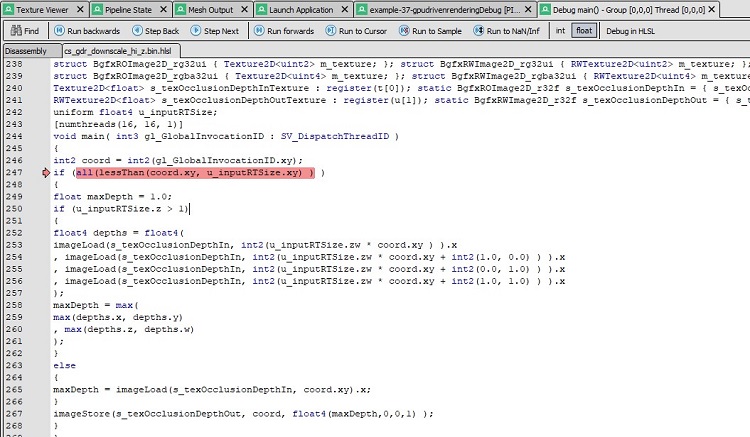
Figure 10c. Use this tab to debug in HLSL.
Please note, RenderDoc’s documentation states its debugging support for Compute Shader is experimental:
“This feature is highly experimental and is provided with no guarantees yet! It may work on simple shaders which is why it is available.”
Conclusion
Due to the diversity of hardware platforms and graphics APIs, we need to use different tools, and adopt different development and debugging methods for specific cases. Starting with an actual rendering engine, this article introduces in detail the use of Visual Studio and RenderDoc to debug shader on Windows platform. It has certain reference value for other platforms and graphics APIs.
References
Download the bgfx project files on GitHub*
Access the bgfx build on GitHub*.
Download shaderc from GitHub.
Get information about Microsoft Visual Studio* Graphic Diagnostics.
How to Debug a Shader using RenderDoc.