Isolate and address challenges, understand different solutions, and learn best-known methods associated with adopting a PyPy* just-in-time interpreter for a leading cloud computing solution.
Introduction
Python* is an open source, general purpose programming language. Applications based on Python are used in data centers for cloud computing and similar applications. By optimizing the Python core language—the interpreter itself—we can improve the performance of almost any application implemented in Python. For example, OpenStack* Swift*, a leading open source and object storage solution, is mostly written in Python. We demonstrated in this paper that, by simply switching the interpreter, OpenStack Swift performance could be improved. We achieved up to 2.2x increase in throughput, with up to 78 percent reduction in latency response, measured with benchmarks.
In this paper, we share technical insights for achieving optimal OpenStack Swift performance using a just-in-time (JIT) Python interpreter, the PyPy* JIT. We will present our best-known methods (BKM) for optimizing application performance using the JIT solution.
Terminology
CPython*: Python is commonly known as a programming language. However, strictly speaking, Python is actually the language specification. This is because application source codes written in Python (or which comply with the Python specification) can be interpreted with different runtime implementations. The reference or standard Python interpreter named CPython is implemented in the C programming language. CPython is an open source implementation and has a wide developer support community. This is used as the baseline interpreter for the current experiment.
Python version: Within CPython, there are two main branches, 2.7 and 3, often referred to as Python 2 and Python 3. This paper focuses on CPython 2.7 and the PyPy JIT that is compatible with CPython 2.7. In this context, CPython refers to CPython 2.7, and PyPy JIT refers to PyPy2 JIT, unless otherwise noted. Python 3 or PyPy 3 is not discussed here.
Python interpreter: We use the term interpreter to refer to these typical terms: runtime, core language, and compiler. The interpreter is the piece of code (binary) that understands the Python application source codes and executes them on the user’s behalf.
Modules, library and extension: A Python interpreter may include additions providing commonly used functions, known as standard libraries, which are packaged and shipped with the interpreter itself. These functions may be implemented within the interpreter binary (built-in), in libraries written with pure Python scripts (*.py files), or in libraries written in the C programming language (*.so files on Linux*-based operating systems, and *.dll files on Windows* operating systems). A Python developer may create additional C modules, also known as customized C extensions. From a general Python application developer’s point of view, module, library, and extension are interchangeable in many cases.
Python application: An application may be written in pure Python scripts (ASCII text files), with or without C modules. Pure Python codes are hardware-agnostic and can be distributed as a software product. C modules, however, are typically compiled into binaries targeting a specific underlying hardware before being shipped out as a product.
Python execution: To simply illustrate how Python works, Figure 1 shows the relationship among the application, the C extensions, and the Python runtime. The application must be interpreted, or run under a runtime. The interpreter (or runtime) could also call system libraries in the underlying operating systems to get system services such as input/output (I/O) or networking.
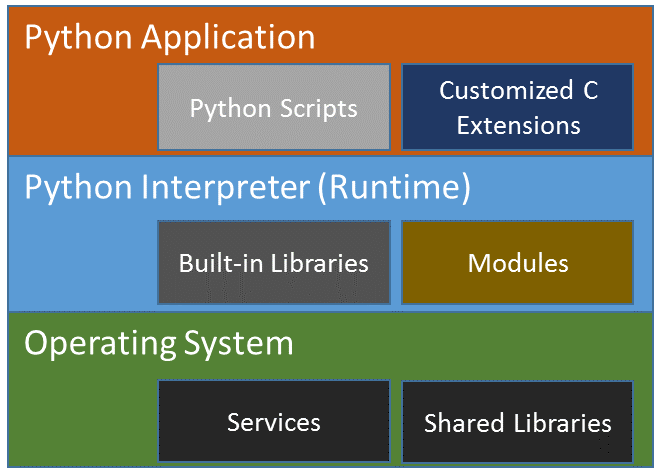
Figure 1. Relationship among different software pieces within a Python* execution environment. The Python application has a dependency on the Python interpreter, which in turn has a dependency on the underlying operating system and services.
Dynamic translation: Python is a dynamic scripting language. A simple way to understand the word dynamic is to imagine how a variable can hold a string in one code line, and then hold an integer in another line at run time. This is in contrast with static compiled languages, where data types must be declared at compile time and cannot be changed at run time. However, dynamic translation is also understood as bytecodes being compiled into machine codes at run time (dynamically) for better performance.
Just-in-time compilation: A form of dynamic translation, combining speed of compiled code with the flexibility of interpretation. JIT technique is common among dynamic scripting languages, HHVM*, Node.js*, Lua*, to give a few examples, all targeting performance as a design goal. A JITed code section is a memory location where the dynamically generated and optimized instructions for the running machine are being stored at run time. JITed codes may be generated and destroyed constantly at run time.
PyPy: PyPy is an alternative implementation of Python, with the aim of faster execution speed. Unlike CPython, which does not have a JIT capability, PyPy provides the JIT compilation feature. Also unlike CPython, which has a very large development community and has the largest user base among all Python implementations, PyPy is maintained by a much smaller developer community. In this paper, PyPy and PyPy JIT are interchangeable.
OpenStack and Swift: OpenStack is an open source software platform for cloud computing, mostly deployed as an infrastructure-as-a-service (IaaS). The software platform consists of interrelated components (or services) that control diverse, multivendor hardware pools of processing, storage, and networking resources throughout a data center. Swift, a scalable, redundant storage system, is a part of the OpenStack services. Objects and files are written to multiple disk drives spread throughout servers in one or more data centers, with the OpenStack software responsible for ensuring data replication and integrity across the clusters. Storage clusters scale horizontally simply by adding new nodes. Swift release 2.11 was used for this experiment. More details about Swift will be provided in later sections.
A node is referred to here as a single physical machine or bare metal. A proxy server is typically referred to as a daemon process running on a proxy node, and listening to incoming client requests. A proxy node will typically have multiple proxy server processes running, while the storage node will have multiple storage server processes running. For the sake of simplicity, the server and node are interchangeable in this paper.
Python* performance
Python is a popular scripting language for two main reasons. Python makes it easy to quickly create code, and the language has an increasing rich set of open source libraries.
So yes, Python offers a lot of benefits, but it is also inherently slow as a dynamic scripting language. One issue is that the hardware-agnostic CPython—the standard Python interpreter—runs in pure interpreted mode. When running in interpreted mode, the application source codes must be analyzed at run time (dynamically) before being executed on the target’s underlying hardware. Applications written in statically compiled languages, on the other hand, are already converted into machine codes for the target hardware (in this case CPUs) at compile time before being distributed as a product. The latter runs much faster. Most developers are aware of its slow performance and can accept that. However, in some enterprise applications (such as OpenStack), users demand better performance.
Common approaches to improve Python performance
One of the solutions adopted by the Python community has been to write C modules, and thus offload CPU-intensive operations to performant C codes. A similar approach, called Cythonizing*, converts existing Python codes to C codes. This type of approach adds complexity, while increasing development, deployment, and maintenance costs.
In the scientific world, writing code blocks with decorators within the applications is also common. The decorators can instruct the underlying interpreter to execute the Python application code blocks in optimized or JITed mode.
Yet another alternative is to rewrite the application in a different programming language, such as Golang* (also known as Go*). Again, the cost of development, implementation, and maintenance remains a big factor to consider.
Using PyPy* JIT as a CPython* alternative for OpenStack* Swift*
We chose a different approach. We applied a Python JIT engine (PyPy JIT) as the interpreter. This approach does not require application source code change and/or additional hardware. Considering that the OpenStack code base is in the millions of lines, we think this is one of the best ways to lower the total cost of ownership (TCO), while maintaining good performance and scalability that rivals other solutions.
Enriching open source communities
One of our goals is enriching the open source community. We want to drive awareness of PyPy’s capabilities and potential by using and improving OpenStack Swift. To that end, this paper presents information that may be useful to both software architects and developers. The information here will help the audience understand the performance benefits of PyPy. This information will also help to better understand the challenges, solutions, and BKMs associated with adopting PyPy.
OpenStack Swift
Overview
OpenStack Swift is designed to durably store unstructured data at a massive scale, and keep that data highly available for fast access. To do this, Swift provides an HTTP application programming interface (API) to clients. API requests use standard HTTP verbs, and API responses use standard HTTP response codes.
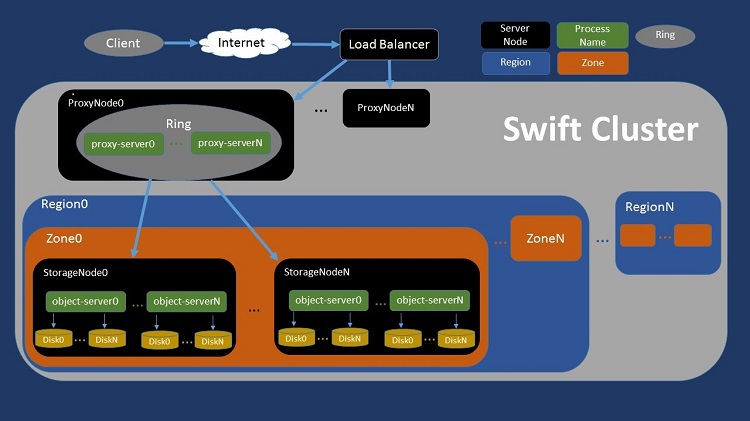
Figure 2. Schematic view of a generic OpenStack* Swift* architecture.
At a high level, a customer requesting any object (a photo, for instance) reaches a Swift cluster after being routed by a load balancer. The Swift cluster may contain multiple proxy server nodes, while the storage nodes may be divided into multiple regions (such as a data center in the United States and another one in Europe). Each region may contain a number of zones (such as a full rack within a data center) and each zone typically contains multiple storage nodes. A user request will eventually be fulfilled by fetching (or writing) the object file from (or to) one of the disks somewhere in the service provider’s facility.
Proxy server and storage servers
Internally, Swift has two major logical parts.
Proxy server: responsible for implementing most of the API. The proxy server coordinates and brokers all communication between clients and storage nodes. The proxy server is responsible for determining where data lives in the cluster. The proxy server is also responsible for choosing the right response to send to clients, depending on how the storage servers handled the initial request. Basically, the proxy server is responsible for accepting network connections from clients, creating network connections to storage servers, and moving data between the two.
Storage servers: responsible for persisting data on durable media, serving data when requested, replicating, and auditing data for correctness.
Focusing on the proxy server only
To limit our scope, in this paper we are only focusing on improving the performance of the proxy server where significant CPU-bound performance bottlenecks were observed in the past. No change was made on any of the storage servers. This does not imply that no CPU performance issues were observed on the storage server, which deserves a separate study.
Reading and writing objects
To write a new object into Swift:
- A client sends a PUT request to a Uniform Resource Identifier (URI) that represents the full name of the new object. The body of the request contains the data the client wants to store in the system.
- The proxy server (proxy) accepts the request.
- The proxy then deterministically chooses the correct storage locations for the data, and opens connections to the backend storage servers.
- The proxy then reads in bytes from the client request body, and sends that data to the storage servers.
- For redundancy, a new object is typically written into multiple storage servers.
To read an object:
- A client sends a GET request to the URI that represents the full name of the object.
- The proxy server accepts the request.
- The proxy deterministically chooses where the data should be in the cluster, and opens the necessary connections to backend storage servers.
Benchmarking, System Configuration, and Performance Metrics
Selecting microbenchmark for system health check and tuning
Before evaluating OpenStack Swift performance, we need to conduct a system-level health check and configure the systems to ensure performance consistency. At the time this work was started, the Grand Unified Python Benchmark* (GUPB) suite was the only Python benchmark suite recommended by the Python developer’s community. This was used during initial system health check and performance comparison. The suite included greater than 50 microbenchmarks (with each a single-threaded Python application running a specific task such as regular expression, ray trace algorithm, JSON parser, and so on). The suite was hosted at one of the Python Mercurial* repositories, and is now obsolete as of this writing. A similar yet different benchmark suite is now recommended and hosted on GitHub*.
System configuration BKM to reduce run-to-run performance variation
After a number of experiments running the GUPB, we established the following best known method (BKM) to reduce run-to-run performance variations to a minimum.
- Set all CPU cores to run at the exact same and fixed frequency. We did this by disabling the P-state in the system BIOS during system boot. On the Ubuntu* operating system, the CPU frequency could be set by setting the parameter value at “/sys/devices/system/cpu/cpu*/cpufreq/scaling_max_freq” and “/sys/devices/system/cpu/cpu*/cpufreq/scaling_min_freq” with sudo user. An application performance behavior could be quite different when a CPU runs at 1GHz versus 2GHz at run time. The dynamic frequency adjustment could be done by the hardware or the operating system, and may be due to multiple factors, including thermal and cooling.
- Disable ASLR, or address space layout randomization, a Linux security feature and is on by default, using this command:
echo 0/proc/sys/kernel/randomize_va_space
After setting the CPU frequency at a fixed value as a baseline, the next two graphs show the difference before and after disabling ASLR, running one of the microbenchmarks within the GUPB suite, CALL_METHOD. This method evaluates the overhead of calling Python functions. In this example, the performance metric is execution time (seconds), with lower values indicating better performance. To demonstrate the data scattering, a median value is calculated first from all the data points, then the delta relative to the median from each data point is plotted in the graph.
Before disabling ASLR:
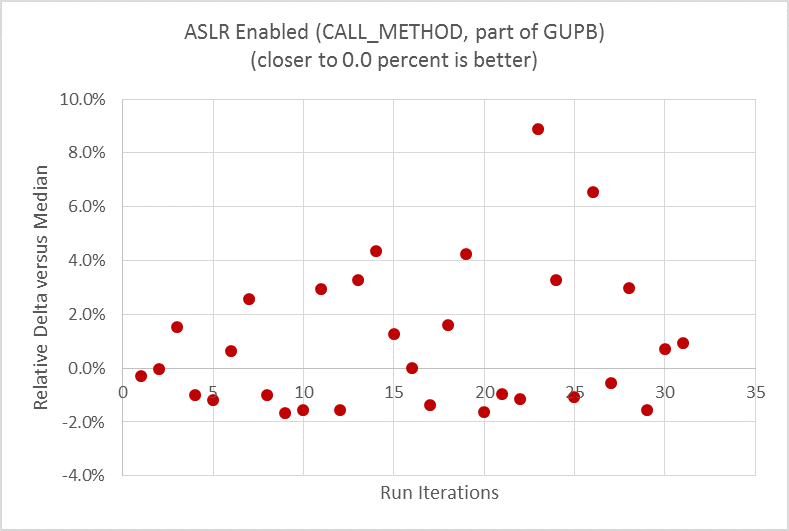
Figure 3. Significant run-to-run performance variation with microbenchmark CALL_METHOD before turning off ASLR.
Benchmark results were obtained prior to implementation of recent software patches and firmware updates that are intended to address exploits referred to as "Spectre" and "Meltdown." Implementation of these updates may make these results inapplicable to your device or system.
After disabling ASLR:
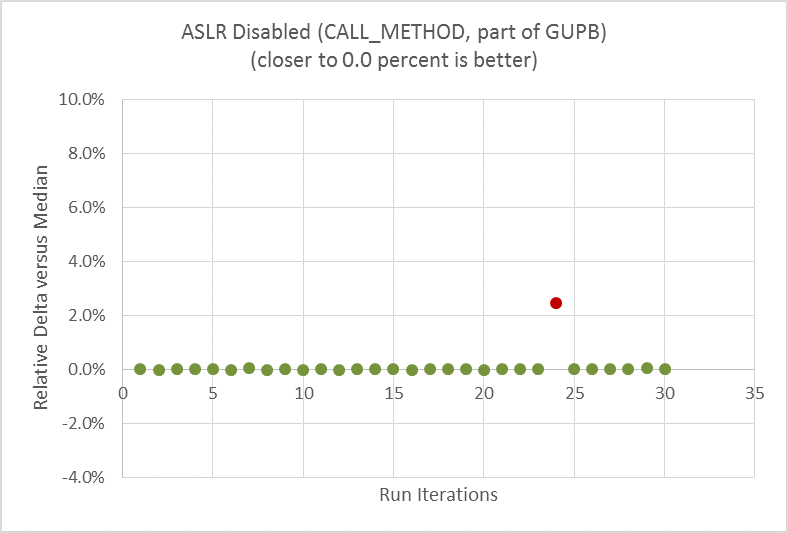
Figure 4. Much reduced run-to-run performance variation with same microbenchmark after turning off ASLR.
Benchmark results were obtained prior to implementation of recent software patches and firmware updates that are intended to address exploits referred to as "Spectre" and "Meltdown." Implementation of these updates may make these results inapplicable to your device or system.
When ASLR is enabled (Figure 3), the run-to-run delta was as high as 11 percent. One can clearly see the data scattering during the 30 repeated runs. When ASLR is disabled (Figure 4), the run-to-run variation is down to nearly zero, with just a single outlier, running the very same micro on the very same hardware.
Choosing a benchmark to measure OpenStack Swift performance
We need a benchmark tool to issue HTTP load, stress the OpenStack Swift cluster, and scale well. In addition, we need to find a tool that can track the performance of each request and create a histogram of the entire benchmark run. Only one tool matched our requirement, an open source tool called ssbench*, written in Python, and originally developed by SwiftStack*.
Ssbench generates payloads to the proxy server to simulate clients sending requests to the server. It prints running status to the console during the run, which is very useful. It also provides a summary at the end, reporting requests completed per second (RPS), as the performance metric. This metric is reported as throughput. Another performance metric is latency, measured in seconds, reflecting the round trip time required to complete each request.
Running ssbench* with input parameters
The following code is an example CRUD (Create, Read, Update and Delete) input file for ssbench, set at [0, 100, 0, 0], or 100 percent READ scenario. We created this file using an existing template from the ssbench package under the scenario folder.
In this experiment, we used 4k (or 4,096 bytes to be exact) as the object size to get the maximum I/O rate out of the storage nodes. 4k is the block size of our file systems on the disk. Unless explicitly specified, 4k was the default object size for the current experiment. Reading or writing 4k chunks aligns with the block boundary, and is the most efficient and fastest way to get bytes out of (or in to) the disk. One way to confirm the device block size is this command:
sudo blockdev --getbsz /dev/sda1 4096
In the following code experiment, we used the 4k size for both tiny and small objects while doing READ only:
{
 "name": "Small test scenario",
 "sizes": [{
  "name": "tiny",
  "size_min": 4096,
  "size_max": 4096
 }, {
  "name": "small",
  "size_min": 4096,
  "size_max": 4096
 }],
 "initial_files": {
  "tiny": 50,
  "small": 50
 },
 "operation_count": 500,
 "crud_profile": [0, 100, 0, 0],
 "user_count": 4,
 "container_base": "ssbench",
 "container_count": 100,
 "container_concurrency": 10
}
You can overwrite some of the parameters from the command-line input.
Here is a sample command line:
ssbench-master run-scenario -f ./very_small.scenario –A http://controller:8080/auth/v1.0 -U system:root -K testpass --pctile 90 --workers 4 -r 600 -u 256 -s ./ssbench-results/very_small.scenario.out
In this test case, we used a v1.0 authentication scheme. We did not use v2.0 or Keystone*, since we noticed that the Keystone service was another performance bottleneck, and should be studied separately.
The above command line dictates 256 users (or 256 concurrency), which overwrites the user_count value set in the input file. This is the default value for our experiment (unless specified explicitly). The command line dumps the results to the “very_small.scenario.out” file in ASCII text format. We use the number of workers at a constant of 4 (--workers 4) to match the four CPU cores available on the client machine, while varying the number of users (user concurrency) to adjust the load or stress level to the server. The “-r 600” parameter specifies keeping each ssbench run for 600 seconds continuously.
Tuning Memcached* and resolving its scaling issue
Memcached* is an important component in the OpenStack Swift software stack. It runs as a Linux service and provides key/value pairs as a cache. The application is written in C, and is highly efficient. However, if not used correctly, Memcached can lead to performance issues—we show these issues in the next throughput chart.
First, we looked at Memcached performance issues and symptoms. We then adjusted the way we ran Memcached, in order to optimize performance.
Figure 5 provides a histogram of throughput when running ssbench. Each dot represents a single throughput number for that second during the run.
Before resolving the Memcached issue, the histogram shows a wider spread, with dots in red color.
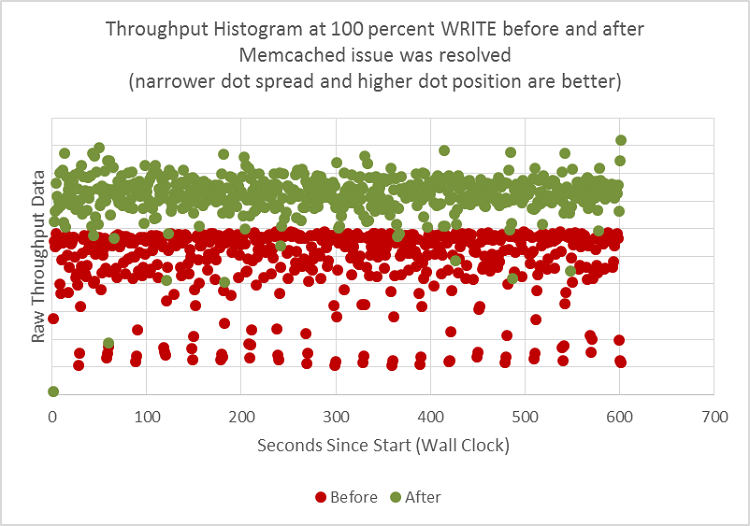
Figure 5. Throughput data histogram comparison before and after tuning Memcached*. The red colored dots represent the result from the “before”, and green colored dots represent the “after”.
Benchmark results were obtained prior to implementation of recent software patches and firmware updates that are intended to address exploits referred to as "Spectre" and "Meltdown." Implementation of these updates may make these results inapplicable to your device or system.
From the ssbench client’s terminal/console, we noticed a large number of errors coming back from the Swift proxy server. Digging into the proxy server log files, we found a significant number of timeouts. There could be multiple reasons for any given timeout, such as a storage node with an I/O bottleneck, intermittent loss of network packets, proxy or storage CPUs being saturated, and so on. In real-world environments, the root cause of a timeout can be complex.
However, the errors we saw were not caused by any of the usual suspects. It was only after we did application code instrumentation and network traffic sniffing that we narrowed the root cause to Memcached. Specifically, Memcached was not responding as quickly as expected.
That was surprising, and the first thing we did was to run a Memcached benchmark, and made sure the response was actually within the expected time range. The second thing we did was to spread the workload in a distributed fashion. In other words, we installed and ran Memcached in two to five separate nodes. This Memcached load spreading is configured in the /etc/swift/proxy-server.conf file, under [filter:cache]; for example:
memcache_servers = 192.168.0.101:11211,192.168.0.102:11211,192.168.0.103:11211 (this sets memcache server to run from 3 separate machines with 3 different IP addresses)
Distributing the workload helped, but the issue still existed, even after adding five machines (also known as nodes in this context) to host the Memcached services. Also, the number of response errors from the proxy server increased as we increased the stress level by raising the number of concurrent users (-u option) from ssbench. After significant searching, we finally saw that one parameter was commented out in the proxy configuration file (proxy-server.conf):
#memcache_max_connections = 2
This meant that the Memcached server was configured to run at a default value of maximum two connections at any point. For our tests, we increased that value to 256. We also used only one Memcached server running on the same proxy server. With those changes, all timeout errors disappeared.
After our changes, not only is the data scattering significantly reduced, but also the maximum throughput increased (green dots in Figure 5). On average, we achieved 1.75x speedup, or a whopping 75 percent improvement in throughput, just by tuning Memcached alone.
With system tuning and configuration completed to generate consistent throughput from ssbench runs, or a good baseline created, we were ready to collect performance data and compare results before and after using PyPy.
OpenStack Swift Performance Improvement with PyPy
We ran ssbench for 600 seconds with two types of experiments, 100 percent READ and 100 percent WRITE. Ssbench can track the throughput during the entire run, allowing us to check the throughput delta from CPython to PyPy from beginning to the end of the benchmark run. In Figure 6, the green dots represent the PyPy impact to throughput during 100 percent READ, and blue dots represent the impact from 100 percent WRITE. Any data value above 0.0 percent is good, indicating performance improvement from PyPy.
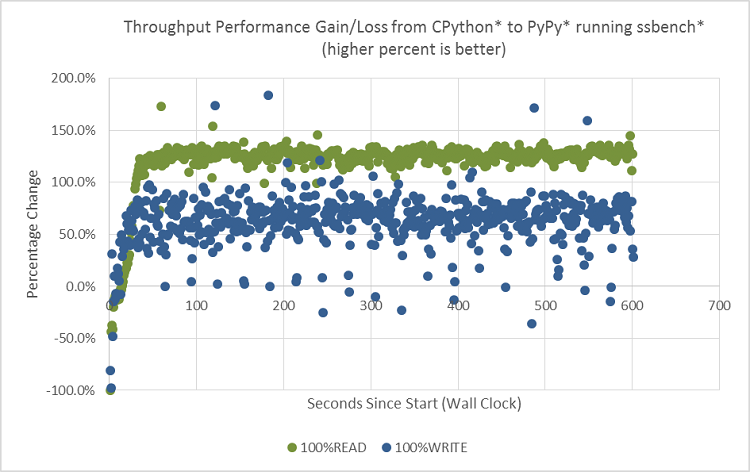
Figure 6. OpenStack* Swift* ssbench* runs histograms at 100 percent READ and 100 percent WRITE, comparing PyPy* with CPython*.
Benchmark results were obtained prior to implementation of recent software patches and firmware updates that are intended to address exploits referred to as "Spectre" and "Meltdown." Implementation of these updates may make these results inapplicable to your device or system.
As shown in Figure 6, the overall throughput from PyPy is higher than that from CPython, regardless of READ (green color) or WRITE (blue color), demonstrated by the positive percentage value. However, in the first 10 seconds, PyPy is actually lower than CPython. In the next 20 seconds or so, PyPy continues to rise and gradually exceeds CPython until it reaches a plateau. The chart also illustrates a greater performance improvement from PyPy during READ than during WRITE (with majority of the green dots, READ, above the blue dots, WRITE).
PyPy warmup
The PyPy behavior during the first 30 seconds is known as warm-up. During that time, the PyPy interpreter runs in interpreted mode (same as CPython), while at same time collecting instruction traces, generating JITed instructions, and optimizing those just-generated instructions. This is the initial overhead from PyPy, which cannot be avoided.
Up to 2.2x speedup PyPy over CPython during 100 percent READ
After the warmup period, the PyPy over CPython delta remains flat (near-constant throughput rate). As discussed earlier, server processes are long running, and so comparing the average values or trend over a long running time such as greater than 30 seconds is reasonable. With that in mind, PyPy over CPython throughput is roughly 120 percent or a speedup of 2.2x at 100 percent READ.
Up to 1.6x speedup PyPy over CPython during 100 percent WRITE
Figure 6 shows a comparison at 100 percent WRITE, and PyPy over CPython throughput improvement is roughly 60 percent, or 1.6x speedup in average after the warmup. This value is much smaller than the 2.2x. This is because WRITE is more I/O constrained than READ. With READ, various data caching mechanisms play roles in reducing the actual I/O activities on the disk itself in the OpenStack Swift storage nodes, and is more CPU-bound. At 100 percent WRITE, disk utilization reaches 60 percent in our experiment (based on data collected from iostat*, an open source tool), a sign of increasing I/O-bound. We can also see some blue dots dropping below 0.0 percent, indicating a performance regression from PyPy, again due to the same reason. In the latter case, a faster proxy server sending more requests than the backend storage servers could handle pushes more pressure to the disks, thus slowing everything down (doing more harm than good).
Performance impact by object size and user concurrency
In the previous experiment, we’ve been using 4KB object size with a fixed user concurrency at 256. In the next experiment, we studied the performance impact from PyPy with varying object size, which impacts I/O, and user concurrency, which impacts load. The result is shown in Figure 7. The chart reproduced roughly 2x (100 percent) performance gain using 1KB object size during 100 percent READ. However, with 10MB object size for READ, the performance gain is much smaller in the 10 to 20 percent range. For WRITE, the performance gain is in the 8 to 20 percent with 1KB object size, and 40+ percent for the 10MB object size. In this current experiment, increasing user concurrency from 200 to 300 and 400 improves performance gain slightly.
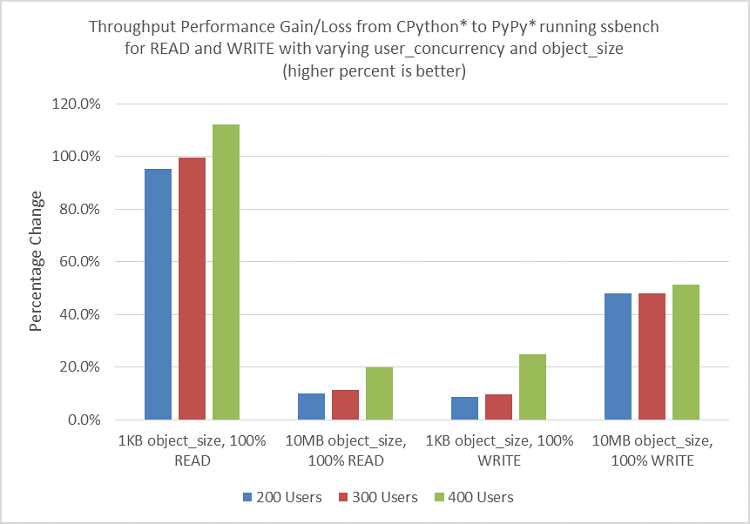
Figure 7. Ssbench* throughput comparison between CPython* to PyPy* at 100 percent READ and 100 percent WRITE with varying user concurrency and object size.
Benchmark results were obtained prior to implementation of recent software patches and firmware updates that are intended to address exploits referred to as "Spectre" and "Meltdown." Implementation of these updates may make these results inapplicable to your device or system.
Up to 78 percent reduction in response latency during READ
Throughput, which measures the RPS, is one vector of the performance metrics. Another way to track performance is by measuring the time it takes to complete a request, in the unit of seconds. Figure 8 shows response latency reduction by 57 percent at 256 user concurrency and 4k object size, and 78 percent at 2048 user concurrency and 4k object size during 100 percent READ. The throughput is what the service providers can see from the back-end server side while the latency impact is what the customer could feel directly. In that sense, the latter metrics could be valuable for simulating or predicting customer impact during peak traffic hours. This result shows greater PyPy performance benefit when system is under heavier load at 2048 user concurrency (versus 256 user concurrency as the baseline).
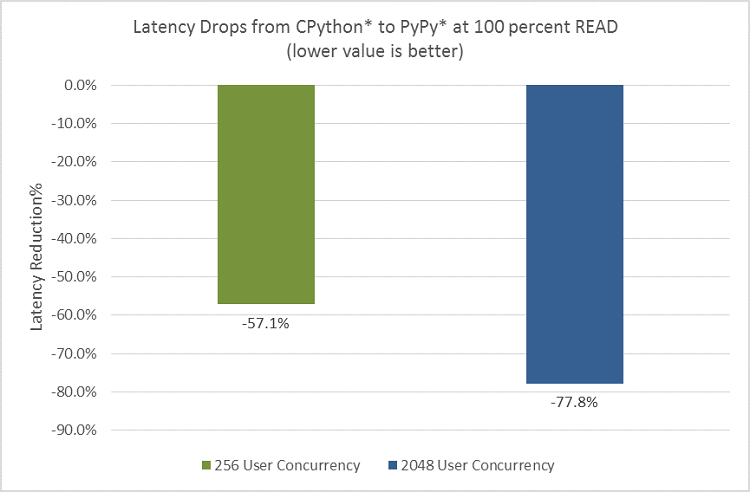
Figure 8. Latency reduction.
Benchmark results were obtained prior to implementation of recent software patches and firmware updates that are intended to address exploits referred to as "Spectre" and "Meltdown." Implementation of these updates may make these results inapplicable to your device or system.
Additional Discussion
How and why PyPy helps
We demonstrated that PyPy could improve performance. This is because PyPy can optimize the machine codes, or JITed instructions dynamically, reducing or eliminating some redundant calls such as removing repeated data type checking in a loop (while the data type remains constant for some variables). In short, PyPy reduced the number of CPU cycles required to complete the same amount of work. This is called CPU pathlength reduction. A further, deeper analysis would require a full and separate white paper.
PyPy only helps if mostly CPU-bound
To showcase the PyPy value, the application must be CPU-bound, with relatively small impact from other long latency hardware constraints, such as memory, networking, or I/O. We did this by using a fast network switch and memory DIMMs, and by adjusting the user concurrency parameter for ssbench in order to create the appropriate payloads. During our initial experiment, we notice our Intel® Xeon® processor based proxy node has a very low CPU utilization rate of 10 percent, no matter how much user concurrency we used running ssbench. After some further digging, we realized we were bottlenecked on the storage. In this kind of experiment setup or usage scenario, we know for sure we would not get much performance benefit by switching the Python interpreter on the proxy node. We were simply not CPU bound on the proxy node! However, as stated earlier that we would like to focus on the proxy node only in this experiment. To create a setup where proxy node is made the performance bottleneck, we reduced the number of available CPU cores down to 10. After that, we were able to push the CPU utilization to above 80 percent on all CPU cores on the proxy node. However, our performance results were still limited by I/O partially, especially during 100% WRITE, as demonstrated earlier.
On Linux-based operating systems, the CPU utilization can be dynamically monitored by a tool called Top. If the application is not CPU-bound, the performance of the programming language itself is no longer the main factor, and even a hand-tweaked assembly code may not help. While collecting performance data from ssbench on the client machine, we also collected system performance data including CPU, memory, networking, and I/O on the proxy server and storage servers. To monitor CPU behaviors under load, we collected CPU profiles using a Linux operating system-based tool called Perf. The Perf data revealed that the Python interpreter itself took greater than 80 percent of the CPU cycles, with the CPython’s main loop function, PyEval_EvalFrameEx, taking 24 percent of the CPU cycles. The Top results indicated that we were mostly CPU-bound, with the Perf data showing CPython as the performance bottleneck, before we started playing with PyPy.
The experiment result discussed in this paper demonstrate the potential performance benefit from PyPy. In a real world production setup where multiple factors are often presenting and influencing each other, a comprehensive system performance analysis is recommended before considering optimizing the Python runtime.
PyPy and module compatibility
One important aspect of OpenStack Swift’s design is that it supports third-party extensions. These middleware modules are typically loaded into the proxy, and can act on either a request or a response. Many features in Swift are implemented as middleware. In fact, there is a wide range of functionality in the ecosystem that is implemented in this way. Examples include S3 API compatibility. When considering ways to improve the performance of Swift’s proxy server, one of the requirements is to ensure a seamless integration with these third-party modules (including C extensions). Fortunately, we have resolved all known issues for integrating PyPy into OpenStack Swift as of this writing, such as a memory leaking issue from the Eventlet* module. A patch was created and merged since Eventlet 0.19.
OpenStack Swift application optimization
While analyzing the OpenStack Swift source codes and runtime characteristics, we noticed some additional issues. First, the hottest Python application codes on the proxy server are spending the majority of the CPU cycles repeatedly creating and destroying network sockets, while communicating with the storage servers. This is an architecture issue, and is not related to the implementation language itself.
We think there is an alternative way to communicate with the storage servers. We suggest creating a connection pool with each storage server from the proxy server, as soon as the processes are up and running. We believe there is huge potential for performance improvement with that kind of change. Additionally, a better data caching implementation at the software level in the proxy server could also help minimize or eliminate the trip to the storage servers. Thus, it would help make use case scenarios such as READ much more efficient.
Summary
With no application (Swift) source code changes or hardware upgrade, we have demonstrated that PyPy can potentially improve OpenStack Swift throughput by up to 2.2x speedup and reduce response latency by up to 78 percent. We believe this is a good way to enhance existing system performance without increasing the total cost of ownership. We recommend this approach to OpenStack Swift architects and developers. We shared tuning BKM to turn the systems into optimal condition by configuring ASLR and Memcached appropriately. We believe that these technical insights can be applied to other large Python applications where performance is one of the design criteria.
Configurations
| Client Nodes | Proxy Nodes | Storage Nodes | |
|---|---|---|---|
| Number of Nodes | 1 | 1 | 15 |
| Processor | Intel® Core™ i7-4770 | Intel® Xeon® E5-2699 v4 | Intel® Atom™ C2750 |
| CPU Cores/per node | 4 | 10 | 8 |
| CPU Frequency | 3.4GHz | 1.8GHz | 2.4GHz |
| CPU Hyper-Threading | Off | Off | Off |
| Memory | 8GB | 32GB | 8GB |
| Operating System | Ubuntu* 14.04 LTS | Ubuntu* 14.04 LTS | Ubuntu* 14.04 LTS |
| OpenStack* Swift Version | N/A | 2.11 | 2.11 |
| Ssbench* Version | 0.2.23 | N/A | N/A |
| Python* Version | 2.7.10 | 2.7.10 | 2.7.10 |