Bo Jiang, Machine Learning Engineer, and Haifeng Chen, Software Engineering Manager, Intel Corporation
Boosting Efficiency for Your Big Data Workloads
The explosion of big data has spurred tremendous increases in data analytics workloads. And compared to online transaction processing (OLTP), the queries in analytics workloads are usually complex, long-running, and CPU-bound. Code generation is an effective way to accelerate analytical data processing. It allows query-specific information known only at runtime, such as column types and expression operators, to be used in performance-critical functions as if they were available at compile time─yielding more efficient implementations.
LLVM is a collection of open-source compiler libraries and related tools designed to be modular and reusable. The LLVM core libraries provide a modern optimizer, along with code generation support for many popular instruction set architectures. LLVM enables analytics engines to perform just-in-time (JIT) compilation within a running process, taking advantage of the benefits of its powerful optimizer. LLVM runtime code generation is an effective technology used by many data analytics engines (e.g., Apache Impala*, Apache Arrow Gandiva*) to improve the execution performance of queries.
The performance of the LLVM code generation engine has a key impact on the overall data analytics engine performance. The current implementations don’t fully utilize the hardware capabilities of modern CPUs, such as vectorization. In this article, we describe our learnings from a real case using Intel® architecture-based vectorization to optimize runtime code generation.
The Problem and Acceleration via LLVM
Analyzing the Design
We started with test code that needed optimization help. It came from one of Intel’s customers, extracted from data analytics software, and consisted of the query expression evaluation module using LLVM-based runtime code generation. Figure 1 shows the LLVM engine’s block diagram.
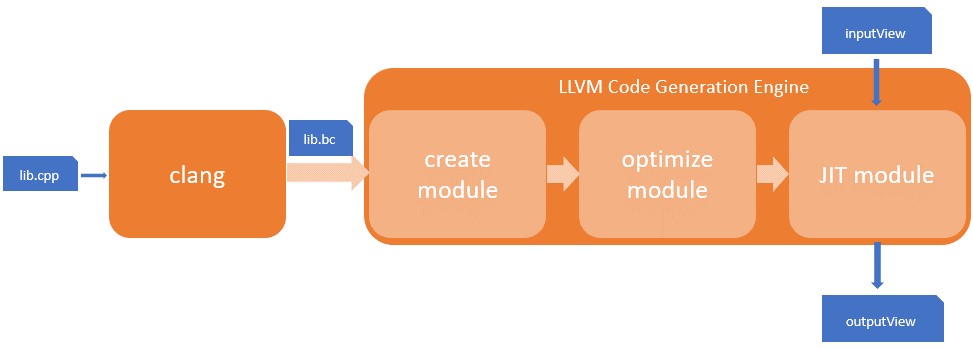
Figure 1. LLVM engine block diagram
The workflow has three stages:
- Create module. The engine creates an LLVM intermedia representation (IR) module using the SQL query from the caller.
- Optimize module. It optimizes the created module with LLVM’s optimizers, which are called passes, and outputs an optimized module for the JIT engine.
- JIT module. The LLVM JIT engine takes data from an inputView and executes the instructions in the optimized module. The resulting data is generated and output as an outputView.
In detail, LLVM primarily uses an IR for all parts of code generation. In the module creation stage, the engine uses LLVM’s IRBuilder to programmatically generate IR instructions. For example, for expression evaluation, it uses IRBuilder to generate the code of the loop function prototype, including the IRs to form the loop and the IRs to calculate the expression once inside the loop.
There are many duplicated IR codes in the function (e.g., the arithmetic operations, the data get/set), so the pre-compilation technique is used. These common codes are implemented in C++ first (e.g., lib.cpp in Figure 1), and then cross-compiled to IR files using Clang. These IR files are called precompiled libs (e.g., lib.bc in Figure 1). During code generation, these precompiled libs are loaded and linked with the IRBuilder-generated IR to get a combined IR module. This combined IR module, which consists of all necessary code, is then sent to the LLVM optimizer. After optimization, the IR module is executed in the LLVM JIT engine.
Although this design increased the SQL execution speed greatly compared to traditional approaches, it still doesn’t fully utilize the capabilities of modern Intel® CPU architecture. Specifically, the data processing is still row by row. As a result, the vectorization is not enabled.
Also, modern Intel CPUs support different vectorization widths using different SIMD instructions (e.g., Intel® Streaming SIMD Extensions [Intel® SSE]/Intel® Advanced Vector Extensions [Intel® AVX/AVX-512]). To fully take advantage of the power of Intel CPUs, we need to complete a series of specific steps.
Confirming Vectorization Opportunity by Profiling
The test code consists of several test cases. A typical test case calculates the expression l_extendedprice*(1-l_discount)*(1+l_tax) over 10 million rows of data.
The data is organized in columnar data format in memory. For each column, the data structure in memory consists of two buffers:
- char* mData
- int8_t* mNull
The mData buffer is for the data and the mNull buffer is used to indicate whether the corresponding data in mData is null or not.
To implement the test case:
- First, it creates a table schema with several columns and generates the table data with 10 million rows.
- Next, it generates the function prototype using the expression and optimizes the generated function.
- Finally, it evaluates (runs) the optimized function with the table data as input and measures the run time.
We analyzed the test code with several measures and discovered additional opportunities for optimization. First, we dumped the generated IR, as well as the machine code of the optimized function. We noticed there were no SIMD (Intel AVX/AVX-512) instructions. Next, we conducted profiling on the baseline program using Intel® VTune™ Profiler. Although the hotspot analysis didn’t provide much insight because it can’t analyze the code-generated function, the microarchitecture exploration report showed it’s CPU-bound (Figure 2), making it an area for further optimization. Finally, we analyzed the up limit of the performance. We wrote a minimal test program in C++ to calculate the expression directly in a loop. We compiled it with Clang -O3 and measured the run time. The result showed the run time is about 1/7 of the baseline test code. By checking the disassembly of the program, we see it’s vectorized with SIMD instructions, as expected.
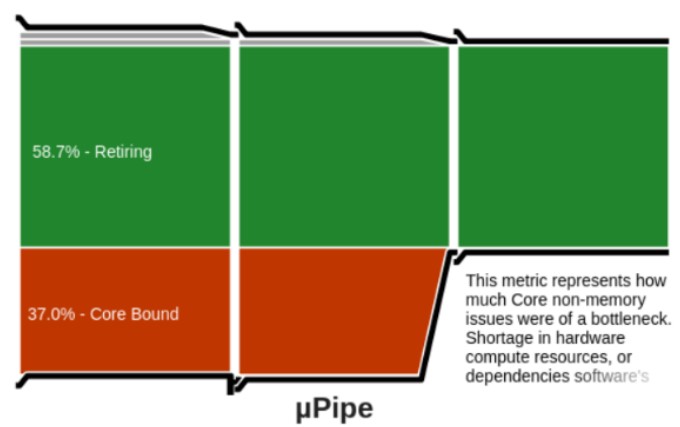
Figure 2. Profiling on the baseline program
The insights from our analysis are consistent. We see vectorization as an approach with high potential for optimizing the test code.
Vectorization Approaches
There are two kinds of auto-vectorizations, explicit and implicit:
- In explicit vectorization, the programmers implement the program using SIMD instructions.
- In implicit vectorization, the compiler automatically transforms IRs to SIMD. Implicit vectorization is also known as compiler auto-vectorization.
We decided to use LLVM loop auto-vectorization because it can be generalized for other expressions, making it more valuable.
In the compiler auto-vectorization approach, there are two factors that impact the LLVM loop auto-vectorization:
- First, the LLVM codegen engine should be properly configured for vectorized IR generation (e.g., use the proper Clang command line option, -Ox, to specify the optimization level and use necessary loop-vectorize passes in the module optimization stage to do correct transformation for vectorization).
- Second, the source code should be written in designs that are friendly to the loop vectorizer. The relevant techniques are widely discussed in the data-oriented programming paradigm that originated from video game development (e.g., proper data layout for efficient usage of the CPU cache and parallelization, address pointer aliasing issue to avoid hinder for LICM [Loop-Invariant Code Motion]).
In the next sections, we’ll elaborate on how to apply the techniques with sample code following this thinking.
Auto-Vectorization for LLVM Code Generation
Start from a Basic Example
The sample code below demonstrates the common LLVM code generation procedure. Based on it, we describe how to properly configure the codegen engine for auto-vectorization.
We created two files: plus.cpp and samplejit.cpp:
- Plus.cpp is used to simulate an expression which add 10 to the input and store the sum in the output.
- Samplejit.cpp is used to simulate the LLVM code generation engine, which loads the prototype module, optimizes it, and finally JIT executes it.
The code for plus.cpp is:
#define LENARRAY 10240
typedef char ele_t;
ele_t a [LENARRAY], b[LENARRAY];

input plus(ele_t aa[], ele_t bb[], int len)
{
	for(int i=0; i<len; i++) {
        bb[i] = aa[i] + 10;
    }
        return 3148;
}
It simulates the SQL expression b=a+10 logically for 10,240 input rows. It returns a magic number (3,148) for checking later.
The plus.cpp is compiled into an IR file (plus.ll) using Clang with the instructions below. This step is to simply simulate the creation of the module.
clang -c -emit-llvm -oO plus.cpp -o plus.bb
llvm-dis plus.bc -o plus.ll
You can easily get vectorized IR code with the proper compile option, -Ox. But here, we want to use the LLVM JIT engine to vectorize the loop, so we explicitly specify the optimize level to -oO (no optimization). From plus.ll, we can see the IR code is not vectorized.
The code structure of samplejit.cpp is:
int main(int argc, char **argv) {
	...
	// Parse the input LLVM IR file into a module.
	...
	// setup the MCJIT execution engine
	...
	// Optimize the module
	...
	// compile the module to mc
	executionEngine->finalizeObject();

	// run the mc in JIT engine
	int (*func_ptr) () = NULL;
	func_ptr = (int(*) ()) executionEngine->getFunctionAddress("_Z4plusPcS_i");
	int res = (*func_ptr) ();
	std::cout << "res: " << res << std::endl;

	return 0;
}
As shown, first the input IR file (i.e., plus.ll) is loaded into the engine as a module. Then the engine optimizes the module. After that, the module is JIT compiled into machine code. The function plus() is run in the JIT engine (_Z4plusPcS_i is the symbol of plus()). The expected value of the variable res is 3,148, which aligns with the return value of plus().
Next, we build and run the sample code:
echo "Building llvmtest ..."
$CPP -o llvmtest samplejit.cpp $CPPFLAGS $LDFLAGS
echo "Running llvmtest ..."
./llvmtest plus.ll
There are several key steps to make sure the LLVM engine is enabled by vectorization.
Enable the Loop Vectorization Optimization Pass
First, the required loop-optimize passes need to be added to passmanager. Here’s a known-good list of passes:
std::unique_ptr<llvm::legacy::PassManager> pass_manager (new llvm::legacy::PassManager());
	pass_manager->add(llvm::createFunctionInliningPass());
	pass_manager->add(llvm::createLoopRotatePass());
	pass_manager->add(llvm::createLICMPass());
	pass_manager->add(llvm::createInstructionCombiningPass());
	pass_manager->add(llvm::createPromoteMemoryToRegisterPass());
	pass_manager->add(llvm::createGVNPass());
	pass_manager->add(llvm::createCFGSimplificationPass());
	pass_manager->add(llvm::createLoopVectorizePass());
	pass_manager->add(llvm::createSLPVectorizerPass());
	pass_manager->add(llvm::createGlobalOptimizerPass());
The order of the passes matters. The FunctionInliningPass should be called before vectorization passes to help generate a function that’s friendlier to the loop-vectorize pass.
Setup CPU Information for the Engine
Now we specify the loop vectorize width. Loop vectorize width indicates how much data can be processed by the SIMD instructions at one time. Usually, it should align with the CPU architecture (e.g., for SSE, it is 128 bits; for Intel AVX-512, it is 512 bits). It’s recommended to use the EngineBuilder’s setMCPU() method as shown below because it automatically adapts to different generations of Intel® processors.
std::string cpuName = llvm::sys::getHostCPUName() .str();
mEngineBuilder->setMCPU(cpuName);
Set the Clang Optimization Option
Compiler auto-vectorization requires explicitly specified compile options. For Clang, the minimal compile option is -O2; for GCC, it is -O3. Here we set Clang options to enable optimization flags in the lib building step. For LLVM versions greater than 5.0, the -O1/2/3 option should be specified to avoid the optnone flag being added to the precompiled libs.
After applying all the measures above, we build and run samplejit.cpp. We see the output is res: 3148, which indicates successful JIT compiling and running of the plus() function. We dump the machine code after optimization and see the Intel AVX-512 instructions in place.
Data-Oriented Programming
Simply applying the above configurations to the customer test code couldn’t make it vectorize successfully. That’s because the real-world program isn’t as simple as the example code. Many loops can’t be vectorized due to complicated control flow or unvectorizable types or unvectorizable calls. So, the prototype IR code also needs to be written in a way that’s friendly to the vectorizer. There are many papers and presentations talking about how to write hardware-friendly code that enables the compiler to generate machine code that best utilizes CPU features. For this case, we used the direct pointer reference and the pointer noalias techniques. Shown below is example code to demonstrate the real-world use cases and how to apply the advanced techniques to make sure the loops are vectorized by Intel AVX/AVX-512.
Example: Simulating a Real Programming Structure
Here’s sample code for a real-world programming structure:
#define LENARRAY 10240
typedef unsigned char nullval_t;
class lvdt
{
public:
	lvdt(unsigned int capacity)
	{
		mNullVal = new nullval_t[capacity];
		for (int i=0; i<capacity; i++)
		{
			mNullVal[i] = rand() %2;
		}
	}
public:
	nullval_t* mNullVal;
};

int main()
{
	int loopcount = 10240;
	srand(time(0));
	lvdt* lvdt1 = new lvdt(LENARRAY);
	lvdt* lvdtout = new lvdt (LENARRAY);

	// the loop
	for (int i=0; i<loopcount; i++) {

		*(lvdtout->mNullVal+i) = *(lvdt1->mNullVal+i);
	}
	...
	return 0;
}
Build it with this command (note that the loop is not vectorized):
clang ./loopvect.cpp -fno-use-cxa-atexit -emit-llvm -S -02 -mavx512f -c -
Rpass=loop-vectorize -Rpass-analysis=loop-vectorize
The debug output shows “loop not vectorized: cannot identify array bounds.” This means the optimizer can’t verify that the pointers in the loop are not aliasing.
To understand pointer aliasing, let’s look at simpler code. To prove it’s safe to vectorize the following loop, array A must show that it’s not an alias of array B. However, the bounds of array A can’t be identified.
void test(int *A, int *B, int Length) {
  for (int i = 0; i < Length; i++)
    A[B[i]]++;
}

clang -03 -Rpass-analysis=loop-vectorize -S test.c -o /dev/null

test.c:3:5: remark:
 loop not vectorized: cannot identify array bounds
     for (int i = 0; i < Length; i++)
There are techniques to address the pointer aliasing problem. If it’s certain that A and B point to non-overlapping memory ranges, we can inform the compiler by explicitly using the #pragma Clang loop directive prior to the loop, such as:
#pragma clang loop vectorize(enable)
Another method that has the same effect is to add the restrict qualifier to the function parameters in the C/C++ code:
void test (int* restrict A, int* restrict B, int Length)
Now we have a question. Since the prototype module in the code generation scenario is written in IR using IRBuilder, neither the pragma nor the restrict keyword is applicable. How do we make it work in LLVM IR? The answer is that in LLVM, the noalias attribute is equivalent to the C restrict qualifier in function parameters.
In the test code, the situation is a bit complex because it used indirect pointers in the loop. That makes the LLVM’s optimizer harder to vectorize the loop. To address this, get the direct pointers to the buffers outside the loop and use them in the loop. The idea is shown in this real-world example code:
int main()
{
    int loopcount = 10240;
    srand(time(0));
    lvdt* lvdt1 = new lvdt (LENARRAY);
    lvdt* lvdtout = new lvdt (LENARRAY);
    nullval_t *p1 = lvdt1->mNullVal;
    nullval_t* pout = lvdtout->mNullVal;
    // updated loop which can be vectorized
    for (int i=0; i<loopcount; i++) {
        *(pout+i) = *(p1+i);
    }
    ...
    return 0;
}
Performance Results
After applying these techniques to the baseline test code from the customer, we successfully generated vectorized expression evaluation functions for all the test cases. We measured the performance improvement of the test cases on a server (Figure 3).
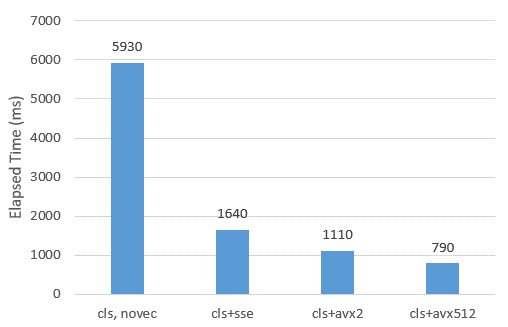
Figure 3. Performance improvement of the test cases
Server configuration: Intel® Xeon® Gold 6252 CPU @ 2.10GHz, 512GB memory, Fedora 29 OS (Server Edition), LLVM: Clang version 7.0.1. See end of magazine for notices and disclaimers.
For the expression l_extendedprice * (1 - l_discount) * (1 + l_tax), the result is shown, and the vectorization acceleration is at most 7.5x with Intel AVX-512 instructions. The data types are double-precision float point. We controlled the vectorize width to get the run time for SSE, AVX2, and AVX512, respectively. For the test cases with other simpler expression (e.g., single operator), the improvement is even higher (>10X).
Run the microarchitecture exploration again, we see the core-bound percentage is reduced and memory bound is appearing. This is reasonable, since Intel AVX-512 instructions increase the demand for data 8x over the original scalar version (Figure 4).
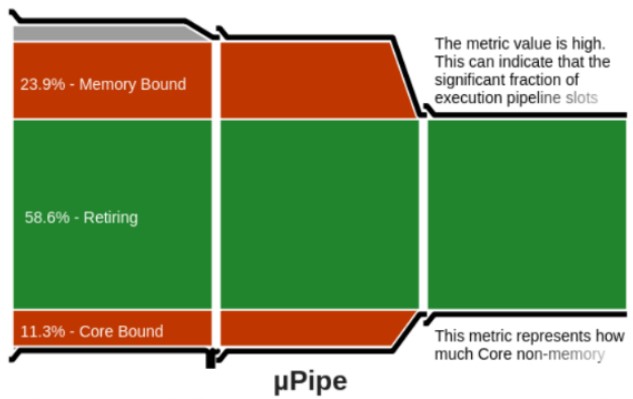
Figure 4. AVX-512 instructions increase the demand for data 8x over the original scalar version
Optimizing Data Analytics
In this article, we introduced the theory of LLVM runtime code generation and its implementation in data analytics engines. We also described our work analyzing and auto-vectorizing the codegen in a practical case. The results demonstrate significant performance improvement using Intel AVX-512 instructions on test code provided by an Intel customer.
LLVM code generation optimization is a big area for query acceleration in data analytics. The techniques we introduced here are only a small portion. There are also other methods, such as whole stage code generation and columnar data layout, that are worth further investigation.
We hope our learnings from this case can be helpful for similar optimizations in the data analytics world.
More Resources
Intel® VTune™ Profiler helps you locate performance bottlenecks fast. Advanced sampling and profiling techniques quickly analyze your code, isolate issues, and deliver insights for optimizing performance on modern processors. Download it for free or get it as part of the Intel® Parallel Studio XE tool suite.