BT Research & Innovation
Ipswich, UK
paul.veitch@bt.com
Intel Shannon
County Clare, Ireland
thomas.long@intel.com
Brocade
Bracknell, UK
paul.hutchison@brocade.com
Abstract. A key consideration for real-world network functions virtualization solutions is the ability to provide predictable and guaranteed performance for customer traffic. Although many proof-of-concepts have focused on maximizing network throughput, an equally important—indeed in some use cases a more important performance metric—is latency.This paper describes a testbed at BT’s Adastral Park laboratories based on the Intel® Open Network Platform architecture, devised to characterize the performance of a virtual Customer Premises Equipment setup.
The test results highlight significant performance improvements in terms of reduction of latency and jitter using an optimized setup which incorporates the Data Plane Development Kit. For example, the average latency was reduced from between 38 percent and 74 percent (depending on the packet profile), while maximum latency was reduced by up to a factor of six. Such insights into performance optimization will be an essential component to enable intelligent workload placement and orchestration of resources in both current networks and future 5G deployments.
I. Introduction
Network functions virtualization (NFV) is rapidly moving from laboratory testbeds to production environments and trials involving real-world customers1. Standardization efforts continue apace via the European Telecommunications Standards Institute Industry Specification Group (ETSI ISG), where a key consideration is performance benchmarking and best practice2. Although network throughput is a key performance metric, this paper addresses the problem from a different angle, namely tackling the problem of latency sensitivity. In particular, the virtual Customer Premises Equipment (vCPE) use case for enterprises involves a mix of virtualized network functions (VNFs) that typically reside at the customer premise. In the ETSI use case document3, this is referred to as VE-CPE (Figure 1).
Examples of network functions at customer premises that can run as VNFs on a standard x86 server with hypervisor include, but are not limited to, routers, firewalls, session-border-controllers, and WAN accelerators. The branch sites will often require modest access to WAN bandwidth compared with the hub sites, that is, tens or hundreds of Mbit/s WAN link rather than >=1Gibt/s. From a performance perspective, therefore, there is less emphasis on maximizing throughput in a branch site vCPE implementation and a greater emphasis on ensuring the latency and jitter is kept to a minimum.
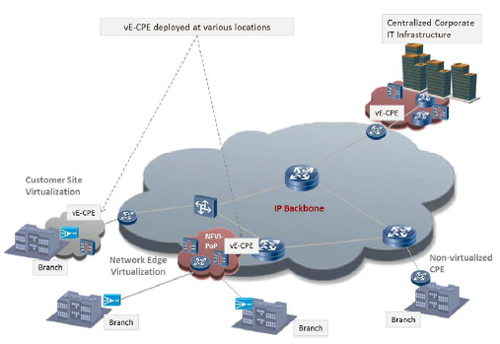
Figure 1: Virtual Enterprise CPE (VE-CPE) use case including branch locations.
Most corporate networks connecting branch sites across a WAN infrastructure will involve some proportion of Voice-over-IP (VoIP) traffic, and this will have much more stringent performance targets in terms of latency/jitter to ensure predictable and guaranteed performance. Even if voice-related network functions such as Session-Border Controllers (SBCs) have been implemented as “non-NFV” hardware appliances, if other functions at the customer premise that carry end-user traffic have been virtualized—an obvious example is the Customer Edge (CE) router—it is vital to ensure that the performance of the NFV infrastructure has been suitably “tuned” to provide some level of predictability for latency and jitter performance. This will provide a clearer view of the contribution that the NFV infrastructure components make to the overall performance characterization of latency-sensitive applications.
Section II explains the Intel® Open Networking Platform (Intel® ONP) and Data Plane Development Kit (DPDK), while Section III outlines the approach to testing a vCPE setup in terms of latency/jitter performance characterization. The actual test results are detailed in Section IV, followed by conclusions in Section V and recommended further work in Section VI.
II. Open Network Platform and Data Plane development kit
The way in which telecoms operators define and implement NFV solutions for specific use cases such as vCPE depend on a number of factors, including cost, technical criteria, and ensuring vendor interoperability. Combining these criteria results in increased motivation towards open-source solutions for NFV, for example those that leverage the use of Kernel-based Virtual Machine (KVM) hypervisor technology with Open vSwitch* (OVS), and open management tools such as OpenStack*. Intel ONP combines a number of such open source “ingredients” to produce a modular architectural framework for NFV4.
From a performance perspective, one of the key components of the Intel ONP architecture is the DPDK, which can be useful for maximizing performance characteristics for VNFs running on the KVM hypervisor. Figure 2(a) shows a simple overview of the standard Open vSwitch, while Figure 2(b) depicts the Open vSwitch with DPDK. In the standard OVS, packets that are forwarded between Network Interface Controllers (NICs) do so in the kernel space data path of the virtual switch that consists of a simple flow table indicating what to do with packets that are received. Only the first packets in a flow need to go to the user space of the virtual switch (using the “slow path”) as they do not match any entries in the simple table in the kernel data path. After the user space of the OVS handles the first packet in the flow, it will update the flow table in the kernel space so that subsequent packets in the flow are not sent to the user space. In this way, the number of kernel space flow table entries is reduced and the number of packets that need to traverse the computationally expensive user space path is reduced.
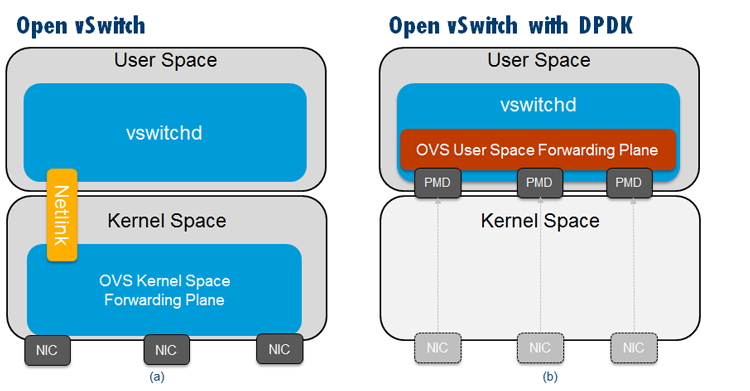
Figure 2: Overview of (a) Open vSwitch* and (b) Data Plane Development Kit vSwitch.
In the Open vSwitch with DPDK model (Figure 2(b)), the main forwarding plane (sometimes called the “fast path”) is in the user space of the OVS and uses DPDK. One of the key differences with this architecture is the fact that the NICs are now Poll Mode Drivers (PMDs), meaning incoming packets are continuously polled rather than being interrupt-driven in an asynchronous fashion. Initial packets in a flow are sent to another module in the user space, following the same path that is traversed by packets in the kernel fast path case.
Figure 3 depicts the actual traffic flows from OVS to the guest virtual machine (VM), which in the context of this paper is a virtual router function. In the case of standard OVS, the OVS forwarding is completed in the kernel space (Figure 3(a)), while for the OVS with DPDK model, the OVS forwarding is completed in the user space (Figure 3(b)), and the guest VM’s virtio queues are mapped to the OVS DPDK and hence can be read/written directly by the OVS. This “user space to user space” path should prove more performant than the “kernel-based” traffic path. Note that for both architectures, the guest VM can use either the DPDK or standard Linux* drivers. In the tests described later, the high-performance scenario uses a VNF with DPDK drivers.
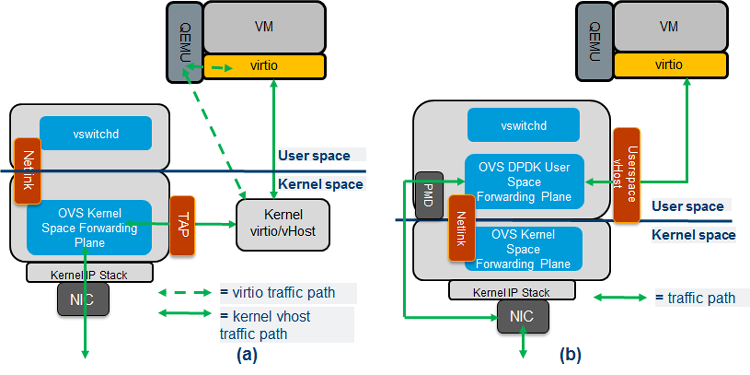
Figure 3: Traffic flows: (a) Open vSwitch* and (b) Data Plane Development Kit vSwitch.
In theory, the Open vSwitch with DPDK should enable improved performance over the standard OVS model. However it is important to conduct specific tests to validate this practically. The next section describes the testbed setup, with the actual results explained in the subsequent section.
III. Overview of testbed
The key components of the testbed are shown in Figure 4.
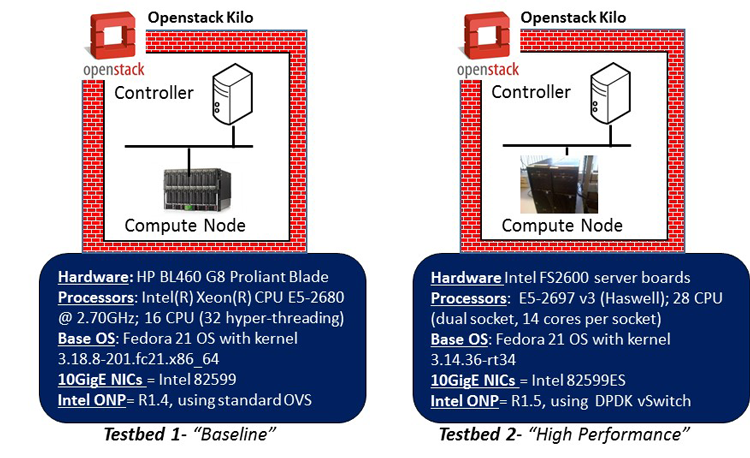
Figure 4: Baseline and high-performance testbeds (specific hardware details shown relate to compute nodes that are “systems-under-test”).
There were two reference testbed platforms used for the purposes of exploring and comparing the impact of high-performance tuning such as DPDK on latency/jitter test results. Each testbed comprises a single OpenStack controller node and a corresponding compute node, built using the “Kilo” system release. Essentially the compute node and associated guest VNFs running on the hypervisor represent the “systems-under-test” (SUT).
The baseline setup uses an Intel® Xeon® processor E5-2680 (code-named Sandybridge) and does not include any BIOS optimizations. In contrast, the high-performance setup uses an Intel® Xeon® processor E5-2697 v3 (code-named Haswell) and includes certain BIOS tuning such as “maximize performance versus power,” and disablement of C-states and P-states. The baseline uses the standard kernel data path whereas the high-performance setup uses the OVS DPDK data path. Although both testbeds use Fedora* 21 as the base OS, the baseline uses a standard non-real-time kernel (3.18), whereas the high-performance setup uses Linux Real-Time Kernel (3.14) with a tuned configuration (isolation of vSwitch and VM cores from the host OS, disabling Security Enhanced Linux, using idle polling and also selecting the perfect Time-Stamp Counter clock). The baseline setup uses “vanilla” OpenStack settings to spin up the VM and assign network resources. In contrast, the high-performance setup is more finely tuned to allow dedicated CPUs to be pinned for the vSwitch and VNFs respectively. The high-performance setup also ensures that the CPUs and memory from the same socket are used for the VNFs, and the specific socket in use is that which connects directly to the physical NIC interfaces of the server.
In both testbeds, the actual VNF used in all tests was a Brocade 5600* virtual router R3.5, and a Spirent Test Center C1* load-testing appliance was used for running test traffic. In the high-performance scenario, the virtual router uses DPDK drivers. As shown in Figure 5, both single VNF and dual VNF service chain permutations were tested.
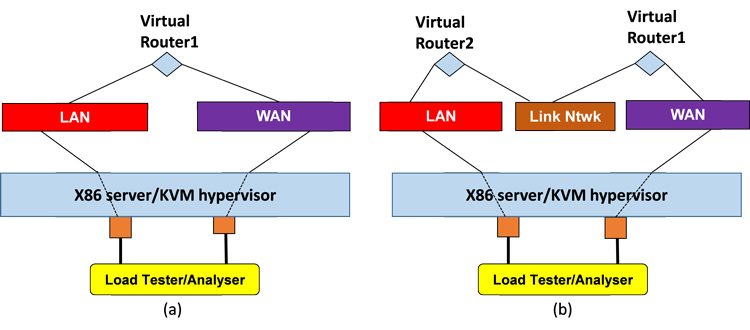
Figure 5: Systems-under-test: (a) single virtual router and (b) two virtual routers in series service chain.
The test cases were set up to ensure “safe” operational throughput for low-end branch offices (<=100Mbit/s) such that no adverse impact on the latency/jitter measurements would occur. The following packet profiles were used for all tests:
- 64-byte frames (bidirectional load of 25 Mbps)
- 256-byte frames (bidirectional load of 25 Mbps)
- “iMix” blending frame sizes in a realistic representation (bidirectional load of 50 Mbps)
- 1500-byte frames (bidirectional load of 100 Mbps)
The test equipment uses a signature with a timestamp to determine the latency between frames. This signature is at the end of the payload next to the FCS (Frame Check Sequence), and has a timestamp, sequence numbers, and stream ID. Jitter is defined here as the time difference between two arriving frames in the same stream. Hence this is a measure of packet delay variation. The same traffic load comprising a single traffic flow was generated to the SUT in each direction, and the results described in the following section capture the “worst-case” metrics observed for a particular direction (that is, the cited values of latency, jitter, and so on are for a single direction only and not round-trip values). It is also worth noting that the test results displayed are runtime in the sense that results are cleared after ~20 seconds, and then allowed to run for the designated duration to ensure that the first packets in a flow taking the slow path do not distort results.
IV. Test results
A. Mixed Tests
The average one-way latency measured over 5-minute durations for the four different packet profile scenarios is shown for the single VNF setup in Figure 6 and the dual VNF setup in Figure 7.
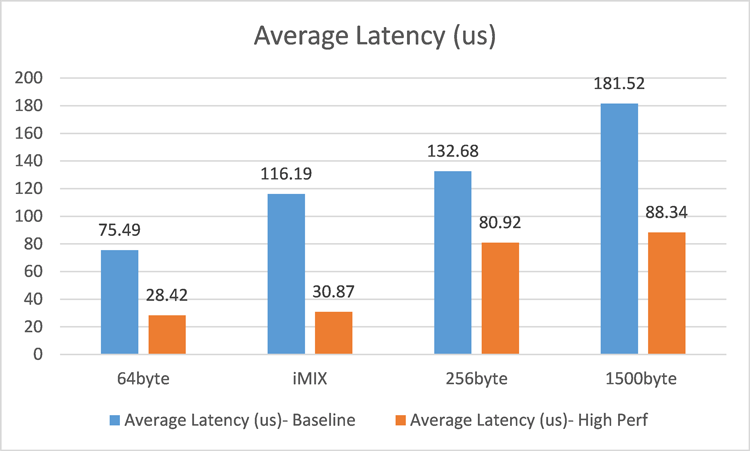
Figure 6: Average latency results in microseconds for single virtualized network function (lower is better).
The results for average latency across the range of packet profiles clearly show significantly improved performance (lower average latency) in the high-performance setup compared with the “vanilla” baseline testbed. For the single VNF tests, the average latency is reduced by a factor of between 38 percent and 74 percent, while in the dual VNF scenario the degree of reduction is between 34 percent and 66 percent. As would be expected, the dual VNF case involves higher overall latency results for both testbeds due to more packet switches between the VNF instances and through the virtual switches within the hypervisor. Note that zero packet loss was observed for these tests.

Figure 7: Average latency results in microseconds for two virtualized network function (lower is better).
B. Focus on 256-Byte Packet Tests
It is instructive to explore in more detail the results for a specific packet profile scenario. For example, the 256-byte packet tests are closely representative of VoIP frames generated using the Real-Time Transport Protocol (RTP) with G.711 encoding5. Figure 8 shows the minimum, average, and maximum one-way latency values for both single and dual VNF scenarios using 256-byte packets.
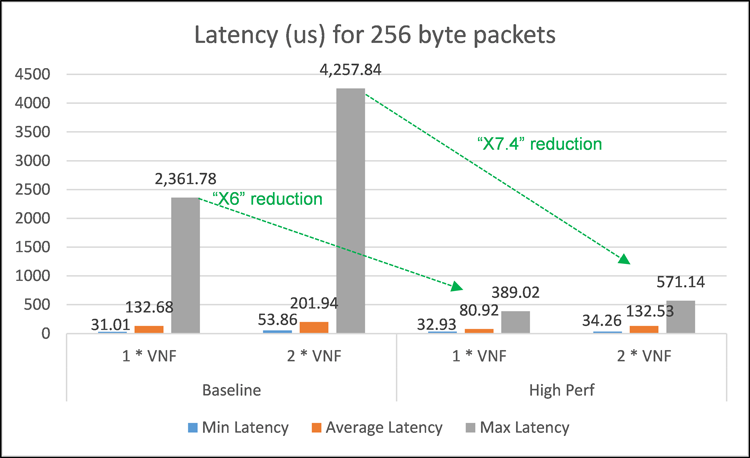
Figure 8: Detailed latency results in microseconds for 256-byte packets.
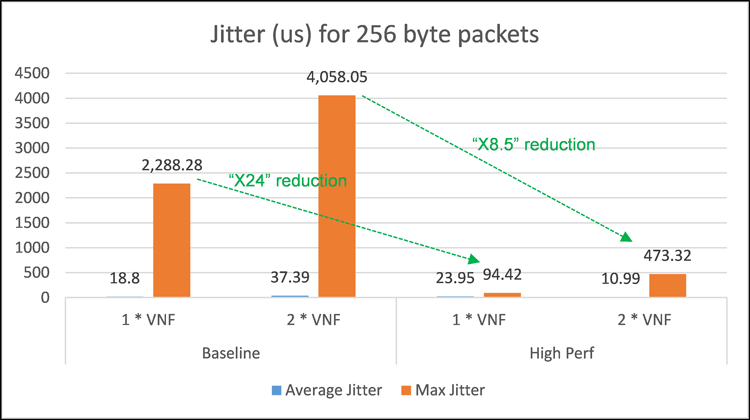
Figure 9: Detailed jitter results in microseconds for 256-byte packets.
Figure 9 shows the corresponding average and maximum one-way jitter values. The maximum values of latency and jitter are important for gauging worst-case performance characterization for both testbeds. Crucially, the maximum latency is reduced in the high-performance setup by factors of 6 and 7.4 for the single and dual VNF cases, respectively. The maximum jitter meanwhile is reduced by factors of 24 and 8.5 for the single and dual VNF cases, respectively. Note that zero packet loss was observed for these tests.
As well as assessing performance over short fixed duration intervals, it is important to understand the potential drift in performance over longer periods. Figure 10 shows the results for 5-minute maximum latency tests compared to 16-hour tests carried out using 256-byte packets and the single VNF setup. In essence, the test result highlights the similar performance improvement achieved using the optimized (that is, high performance) versus non-optimized (baseline) setup: the maximum latency is reduced by a factor of 5 for the 16-hour test and a factor of 6 for the 5-minute test. The key point to note however is that the maximum latency values are significantly higher in the 16-hour tests, which can be attributed to very occasional system interrupt events (that is, housekeeping tasks) which will have an impact on only a very small number of test packets. Despite this, the value of 2-msec maximum one-way latency for the 16-hour duration/256 byte packet test for the high-performance setup is still comfortably within the one-way transmission target of 150 msec for voice traffic, as specified in ITU-T specification G.1146. In other words, the 2-msec worst-case contribution added by the vCPE setup only amounts to 1.3% of the overall one-way recommended budget for latency. Indeed, even the non-optimized baseline setup comprising 9.95 msec maximum one-way latency is only 6.6% of this budget.
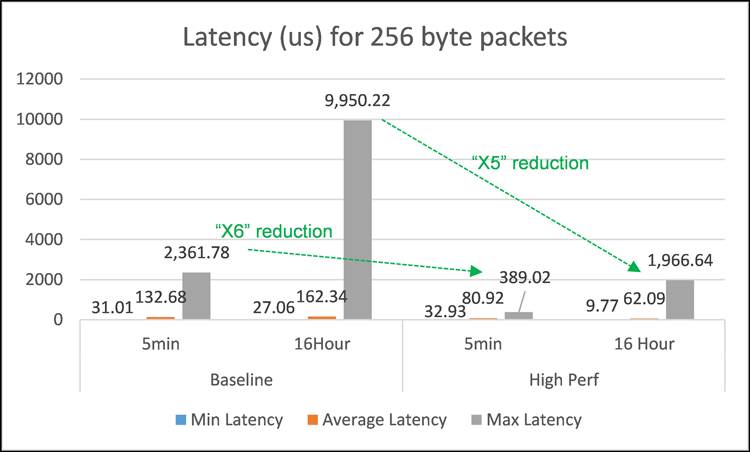
Figure 10: Soak test latency results in microseconds (16- hour compared to 5-minute tests).
V. Summary and Conclusions
This paper has demonstrated fine-tuning of a virtual CPE infrastructure platform based on a KVM hypervisor. Specifically leveraging some of the components of Intel ONP architecture such as the DPDK can provide significant improvements in performance over a baseline (that is, a non-optimized) setup. For the single VNF tests, the average one-way latency is reduced by a factor of between 38 percent and 74 percent, while in the dual VNF scenario, the degree of reduction is between 34 percent and 66 percent. For the more VoIP-representative test case using 256-byte packets, the maximum latency is reduced in the high-performance setup by factors of 6 and 7.4 for the single and dual VNF cases, respectively, while maximum jitter is reduced by factors of 24 and 8.5 for the single and dual VNF cases, respectively.
Based on the experimental results, it can be concluded that performance-tuning of NFV infrastructure for latency-sensitive applications such as VoIP will achieve better and more deterministic overall performance in terms of latency and jitter than a baseline (that is, non-optimized) setup. Whether a network operator decides to implement such optimizations will be driven largely by the required mix of VNFs being supported on the vCPE infrastructure, and the degree to which SLAs for performance metrics such as latency and jitter must be associated with the services underpinned by the VNFs. In practical terms, actual target SLAs used by network operators will cite performance targets within the scope of the operator’s own backbone/transit network domain, and will vary according to geography. IP Packet round-trip values of 30 msec to 40 msec for Europe, 40 msec to 50 msec for North America, and up to 90 msec for Trans-Atlantic links are typical examples and are targets for average latency.
If network operators do opt for optimized NFV setups using capabilities such as DPDK, rather than a vanilla out-of-the-box solution, they need to be aware of the possible impact on higher-layer orchestration solutions, which will need clearer visibility of underlying infrastructure parameters and settings to ensure VNFs with specific performance requirements are provisioned and managed accordingly. The experiments presented in this paper can be viewed as a foundation to help advance the understanding of such performance optimizations, equally applicable to current networks, and future 5G infrastructures.
VI. Future Work
Further research topics of interest include the following:
- Consideration of “layers of optimization” and what their individual contribution and impact to the “overall optimization” is: hardware choices (specifically, the contribution of Intel® Xeon® processor E5-2680 and Intel® Xeon® processor E5-2697 v3 to the differences in latencies), BIOS settings (for example, consider P-state enablement to allow utilization of Enhanced Intel® SpeedStep® Technology for improved power/load efficiency), Real-Time Kernel tuning options (for example “no hertz kernel,” read copy update/RCU polling), hypervisor settings, and VNF setup all contribute to the architecture. Therefore clearer visibility of possible optimizations and their effect at each layer should be assessed.
- Similar tests can be considered to perform a performance characterization based on a richer suite of diverse VNF types, including VoIP-specific VNFs.
- Test analytics can be further refined to assess profiling and frequency distributions of packet latency and jitter performance.
- Further analysis of the impact of NFV optimizations on higher-level management: making an orchestrator aware of underlying resources and the ability to leverage specific fine-tuning of NFV infrastructure using capabilities like DPDK, adds complexity to the management solution, but makes it possible to customize the allocation of latency-sensitive VNFs onto the most suitable NFV infrastructure.
As is evident, there are a number of interesting challenges and problems yet to be addressed in this space.
References
1. J. Stradling. “Global WAN Update: Leading Players and Major Trends,” Current Analysis Advisory Report, Sept 2015.
2. “Network Functions Virtualization Performance & Portability Best Practices,” ETSI ISG Specification GS NFV-PER001, V1.1.1. June, 2014.
3. “Network Functions Virtualisation Use Cases,” ETSI ISG Specification GS NFV001, V1.1.1. October 2013.
4. “Intel® Open Network Platform Server (Release 1.5),” Release Notes, November 2015.
5. “NFV Performance benchmarking for vCPE,” Network Test Report, Overture Networks, May 2015.
6. “ITU-T Specification G114- One Way Transmission Time,” May 2003.