Introduction
Modern CPUs include different levels of parallelism. High-performance software needs to take advantage of all opportunities for parallelism in order to fully benefit from modern hardware. These opportunities include vectorization, multithreading, memory optimization, and more.
The need for increased performance in software continues to grow, but instead of getting better performance from increasing clock speeds as in the past, now software applications need to use parallelism in the form of multiple cores and, in each core, an increasing number of execution units, referred to as single instruction, multiple data (SIMD) architectures, or vector processors.
To take advantage of both multiple cores and wider SIMD units, we need to add vectorization and multithreading to our software. Vectorization in each core is a critical step because of the multiplicative effect of vectorization and multithreading. To get good performance from multiple cores we need to extract good performance from each individual core.
Intel’s new processors support the rising demands in performance with Intel® Advanced Vector Extensions 512 (Intel® AVX-512), which is a set of new instructions that can accelerate performance for demanding computational workloads.
Intel AVX-512 may increase the vectorization efficiency of our codes, both for current hardware and also for future generations of parallel hardware.
Vectorization Basics
Figure 1 illustrates the basics of vectorization using Intel AVX-512.
In the grey box at the top of Figure 1, we have a very simple loop performing addition of the elements of two arrays containing single precision numbers. In scalar mode, without vectorization, every instruction produces one result. If the loop is vectorized, 16 elements from each operand are going to be packed into 512-bit vector registers, and a single Intel AVX-512 instruction is going to produce 16 results. Or 8 results, if we use double-precision floating point numbers.
How do we know that this loop was vectorized? One way is to get an optimization report from the Intel® C compiler or the Intel® C++ compiler, as shown in the green box at the bottom of the figure. The next section in this article shows how to generate these reports.
However, not all loops can run in vector mode. This simple loop is vectorizable because different iterations of this loop can be processed independently from each other. For example, the iteration when the index variable i is 3 can be executed at the same time when i is 5 or 6, or has any other value in the iteration range, from 0 to N in this case. In other words, this loop has no data dependencies between iterations.
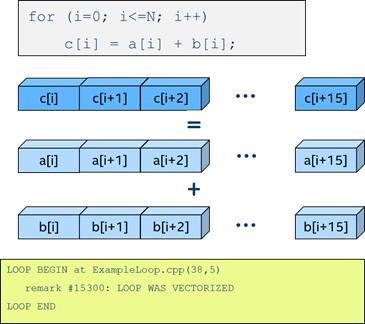
Figure 1: Simple loop adding two arrays of single precision floating point numbers. Operations are performed simultaneously on 512-bit registers. No dependencies present. Loop is vectorized.
Figure 2 illustrates the case where a loop might not be directly vectorizable. The figure shows a loop where each iteration produces one value in the array c, which is computed using another value of c just produced in the previous iteration.
If this loop is executed in vector mode, the old values of the array with name c (16 of those values in this case) are going to be loaded into the vector register (as shown by the red circles in Figure 2), so the result will be different compared to the execution in scalar mode.
And so, this loop cannot be vectorized. This type of data dependency is called a Read-After-Write, or a Flow dependency, and we can see that the compiler will detect it and will not vectorize this loop.
There are other types of data dependencies; this is just an example to illustrate one that will prevent the compiler from automatically vectorizing this loop. In these cases we need to modify the loop or the data layout to come up with a vectorizable loop.

Figure 2: Simple loop, yet not vectorized because a data dependency is present.
Intel® Advanced Vector Extensions 512 (Intel® AVX-512): Enhanced Vector Processing Capabilities
The Intel AVX-512 instruction set increases vector processing capabilities because the new instructions can operate on 512-bit registers. There is support in Intel AVX-512 for 32 of these vector registers, and each register can pack either 16 single-precision floating point numbers or 8 double-precision numbers.
Compared to the Intel® Advanced Vector Extensions 2 instruction set (Intel® AVX2), Intel AVX-512 doubles the number of vector registers, and each vector register can pack twice the number of floating point or double-precision numbers. Intel AVX2 offers 256-bit support. This means more work can be achieved per CPU cycle, because the registers can hold more data to be processed simultaneously.
As of today, Intel AVX-512 is currently available on Intel® Xeon Phi™ processors, and on the Intel® Xeon® Scalable processors.
The full specification of the Intel AVX-512 instruction set consists of several separate subsets:
A. Some are present in both the Intel Xeon Phi processors and in the Intel Xeon Scalable processors:
- Foundation Instructions
- Conflict Detection Instructions
B. Some are supported by Intel Xeon Phi processors:
- Exponential and Reciprocal Instructions
- Prefetch Instructions
C. Some are supported by Intel Xeon Scalable processors:
- Byte (char or int8) and Word (short or int16) Instructions
- Double-word (int32 or int) and Quad-word (int64 or long) Instructions
- Vector Length Extensions
The subsets shown above can be accessed in different ways. The easiest way is to use a compiler option. As an example, Intel C++ compiler options that control which subsets to use are as follows:
- Option -xCOMMON-AVX512 will use:
- Foundation Instructions
- Conflict Detection Instructions
- Instructions enabled with -xCORE-AVX2
- Option -xMIC-AVX512 will use:
- Foundation Instructions
- Conflict Detection Instructions
- Exponential and Reciprocal Instructions
- Prefetch Instructions
- Instructions enabled with -xCORE-AVX2
- Option -xCORE-AVX512 will use:
- Foundation Instructions
- Conflict Detection Instructions
- Byte and Word Instructions
- Double-word and Quad-word Instructions
- Vector Length Extensions
- Instructions enabled with -xCORE-AVX2
- Option -xCORE-AVX2 will use:
- Intel Advanced Vector Extensions 2 (Intel AVX2), Intel® Advanced Vector Extensions (Intel® AVX), Intel® Streaming SIMD Extensions (Intel® SSE), Intel® SSE 4.2, Intel® SSE 4.1, Intel® SSE 3, Intel® SSE 2, and Supplemental Streaming SIMD Extensions 3 instructions for Intel® processors
For example, if it is necessary to keep binary compatibility for both Intel Xeon Phi processors and Intel Xeon Scalable processors, code can be compiled using the Intel C++ compiler as follows:
icpc Example.cpp -xCOMMON-AVX512 <more options>But if the executable will run on Intel Xeon Scalable processors, the code can be compiled as follows:
icpc Example.cpp -xCORE-AVX512 <more options>Vectorization First
The combination of vectorization and multithreading can be much faster than either one alone, and this difference in performance is growing with each generation of hardware.
In order to use the high degree of parallelism present on modern CPUs, like the Intel Xeon Phi processors and the new Intel Xeon Scalable processors, we need to write new applications in such a way that they take advantage of vector processing on individual cores and multithreading on multiple cores. And we want to do that in a way that guarantees that the optimizations will be preserved as much as possible for future generations of processors, to preserve code and optimization efforts, and to maximize software development investment.
When optimizing code, the first efforts should be focused on vectorization. Data parallelism in the algorithm/code is exploited in this stage of the optimization process.
There are several ways to take advantage of vectorization capabilities on a single core on Intel Xeon Phi processors and the new Intel Xeon Scalable processors:
- The easiest way is to use libraries that are already optimized for Intel processors. An example is the Intel® Math Kernel Library, which is optimized to take advantage of vectorization and multithreading. In this case we can get excellent improvements in performance just by linking with this library. Another example is if we are using Python*. Using the Intel® Distribution for Python will automatically increase performance, because this distribution accelerates computational packages in Python, like NumPy* and others.
- On top of using optimized libraries, we can also write our code in a way that the compiler will automatically vectorize it, or we can modify existing code for this purpose. This is commonly called automatic vectorization. Sometimes we can also add keywords or directives to the code to help or guide automatic vectorization. This is a very good methodology because code optimized in this way will likely be optimized for future generations of processors, probably with minor or no modifications. Only recompilation might be needed.
- A third option is to directly call vector instructions using intrinsic functions or in assembly language.
In this article, we will focus on examples of optimizing applications using the first two methods shown above.
A typical vectorization workflow is as follows:
- Compile + Profile
- Optimize
- Repeat
The first step above can be performed using modern compilers, profilers, and optimization tools. In this article, an example of an optimization flow will be shown using the optimization reports generated by the Intel® compilers, as well as advanced optimization tools like Intel® Advisor and Intel® VTune™ Amplifier, which are part of the new Intel® Parallel Studio XE 2018.
Example: American Option Pricing
This example is taken from a book by James Reinders and Jim Jeffers titled High Performance Parallelism Pearls Volume Two1. In chapter 8, Shuo Li (the author of that chapter and the code that will be used in this article) describes a possible solution to the problem of American option pricing. It consists of finding an approximate solution to partial differential equations based on the Black-Scholes model using the Newton-Raphson method (based on work by Barone-Adesi and Whaley2). They have implemented this solution as C++ code and the source code is freely available at the authors’ website (http://lotsofcores.com/).
Figure 3 shows two fragments of the source code am_opt.cpp (downloaded from the link shown above), containing the two main loops in their code. The first loop initializes arrays with random values. The second loop performs the pricing operation for the number of options indicated in the variable OptPerThread, which in this case has a value of about 125 million options. In the rest of this article we will focus on Loop 2, which uses most of the CPU time. In particular, we will focus on the call to function baw_scalaropt (line 206), which performs option pricing for one option.
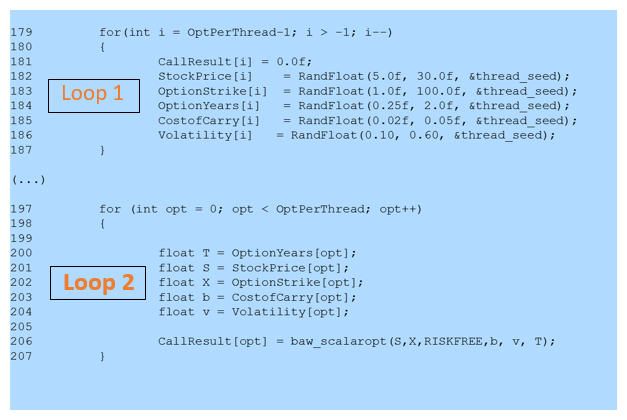
Figure 3: Fragments of the source code from the author's book and website showing the two main loops in the program.
The following code snippet shows the definition of function baw_scalaropt:
 90 float baw_scalaropt( const float S,
 91                  const float X,
 92                  const float r,
 93                  const float b,
 94                  const float sigma,
 95                  const float time)
 96 {
 97     float sigma_sqr = sigma*sigma;
 98     float time_sqrt = sqrtf(time);
 99     float nn_1 = 2.0f*b/sigma_sqr-1;
100     float m = 2.0f*r/sigma_sqr;
101     float K = 1.0f-expf(-r*time);
102     float rq2 = 1/((-(nn_1)+sqrtf((nn_1)*(nn_1) +(4.f*m/K)))*0.5f);
103
104     float rq2_inf = 1/(0.5f * ( -(nn_1) + sqrtf(nn_1*nn_1+4.0f*m)));
105     float S_star_inf = X / (1.0f - rq2_inf);
106     float h2 = -(b*time+2.0f*sigma*time_sqrt)*(X/(S_star_inf-X));
107     float S_seed = X + (S_star_inf-X)*(1.0f-expf(h2));
108     float cndd1 = 0;
109     float Si=S_seed;
110     float g=1.f;
111     float gprime=1.0f;
112     float expbr=expf((b-r)*time);
113     for ( int no_iterations =0; no_iterations<100; no_iterations++) {
114         float c  = european_call_opt(Si,X,r,b,sigma,time);
115         float d1 = (logf(Si/X)+
116                    (b+0.5f*sigma_sqr)*time)/(sigma*time_sqrt);
117         float cndd1=cnd_opt(d1);
118         g=(1.0f-rq2)*Si-X-c+rq2*Si*expbr*cndd1;
119         gprime=( 1.0f-rq2)*(1.0f-expbr*cndd1)+rq2*expbr*n_opt(d1)*
120                (1.0f/(sigma*time_sqrt));
121         Si=Si-(g/gprime);
122     };
123     float S_star = 0;
124     if (fabs(g)>ACCURACY) { S_star = S_seed; }
125     else { S_star = Si; };
126     float C=0;
127     float c  = european_call_opt(S,X,r,b,sigma,time);
128     if (S>=S_star) {
129         C=S-X;
130     }
131     else {
132         float d1 = (logf(S_star/X)+
133                    (b+0.5f*sigma_sqr)*time)/(sigma*time_sqrt);
134         float A2 =  (1.0f-expbr*cnd_opt(d1))* (S_star*rq2);
135         C=c+A2*powf((S/S_star),1/rq2);
136     };
137     return (C>c)?C:c;
138 };
Notice the following in the code snippet shown above:
- There is a loop performing the Newton-Raphson optimization on line 113.
- There is a call to function
european_call_opton line 114 (inside the loop) and on line 127 (outside the loop). This function performs a pricing operation for European options, which is needed for the pricing of American options (see details of the algorithm in1).
For reference, the following code snippet shows the definition of the european_call_opt function. Notice that this function only contains computation (and calls to math functions), but no loops:
75 float european_call_opt( const float S,
 76                 const float X,
 77                 const float r,
 78                 const float q,
 79                 const float sigma,
 80                 const float time)
 81 {
 82     float sigma_sqr = sigma*sigma;
 83     float time_sqrt = sqrtf(time);
 84     float d1 = (logf(S/X) + (r-q + 0.5f*sigma_sqr)*time)/(sigma*time_sqrt);
 85     float d2 = d1-(sigma*time_sqrt);
 86     float call_price=S*expf(-q*time)*cnd_opt(d1)-X*expf(-r*time)* cnd_opt(d2);
 87     return call_price;
 88 };
To better visualize the code, Figure 4 shows the structure of functions and loops in the am_opt.cpp program. Notice that we have labeled the two loops we will be focusing on as Loop 2.0 and Loop 2.1.
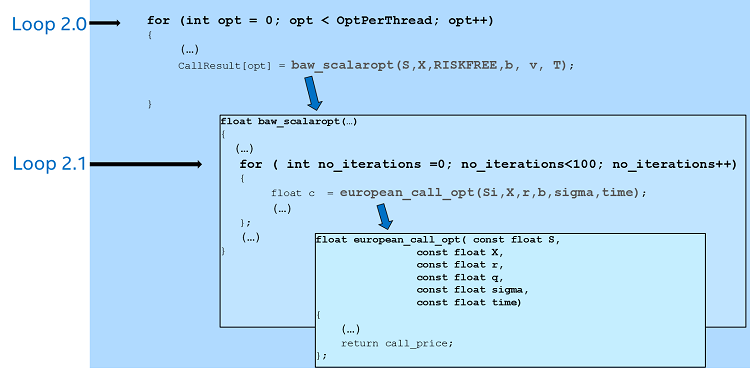
Figure 4: Structure of functions and loops in the program.
As a first approach, we can compile this code with the options shown at the top of the yellow section in Figure 5 (the line indicated by label 1). Notice that we have included the option “O2”, which specifies a moderate level of optimization, and also the option “-qopt-report=5”, which asks the compiler to generate an optimization report with the maximum level of information (possible levels range from 1–5).
A fragment of the optimization report is shown in the yellow section in Figure 5. Notice the following:
- Loop 2.0 on line 201 was not vectorized. The compiler suggests a loop interchange and the use of the SIMD directive.
- The compiler also reports Loop 2.1 was not vectorized because of an assumed dependence, and also reports that function
baw_scalaropthas been inlined. - Inlining the function
baw_scalaroptpresents both loops (2.0 and 2.1) as a nested loop, which the compiler reports as an “Imperfect Loop Nest” (a loop with extra instructions between the two loops), and for which it suggests the permutation.
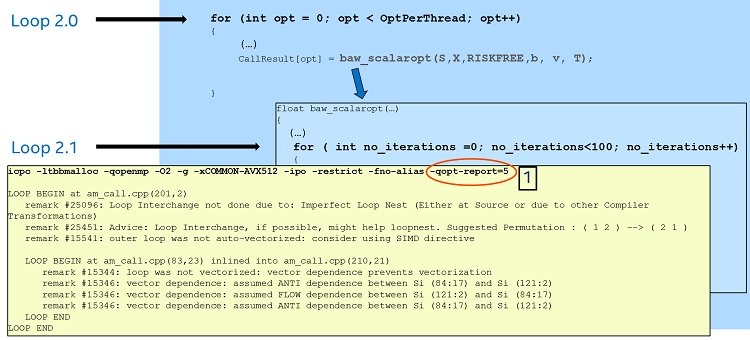
Figure 5: Compiling the code with optimization option "O2" and targeting the Intel® AVX-512 instructions.
Before trying the SIMD option (which would force vectorization), we can try compiling this code using the optimization flag “O3”, which specifies a higher level of optimization from the compiler. The result is shown in Figure 6. We can observe in the yellow section that:
- The compiler reports that the outer loop (Loop 2.0) has been vectorized, using a vector length of 16.
- The compiler’s estimated potential speedup for the vectorized loop 2.0 is 7.46.
- The compiler reports a number of vectorized math library calls and one serialized function call.
Given that the vector length used for this loop was 16, we would expect a potential speedup close to 16 from this vectorized loop. Why was it only 7.46?
The reason seems to come from the serialized function call reported by the compiler (which refers to the call of the function european_call_opt inside the inner loop (Loop 2.1). One possible way to fix this would be to ask the compiler to recursively inline all the function calls. For this we can use the directive “#pragma inline recursive” right before the call to the function baw_scalaropt.
After compiling the code (using the same compiler options as in the previous experiment), we get the new optimization report informing that the compiler’s estimated potential speedup for the vectorized loop 2.0 (Figure 7) is now 14.180, which is closer to the ideal speedup of 16.
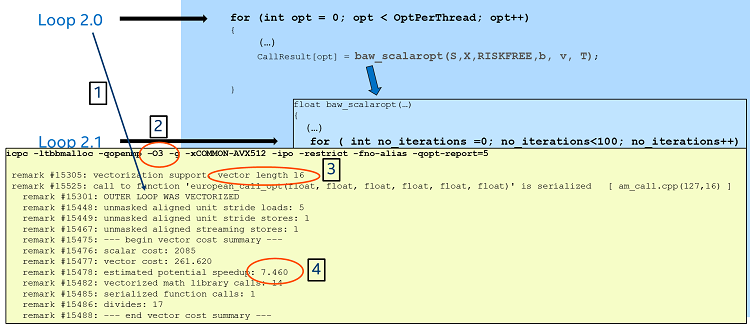
Figure 6: Compiling the code with optimization option "O3" and targeting the Intel® AVX-512 instructions.
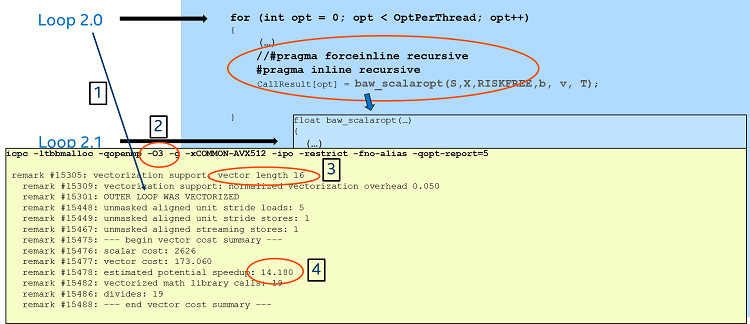
Figure 7: Adding the "#pragma inline recursive" directive.
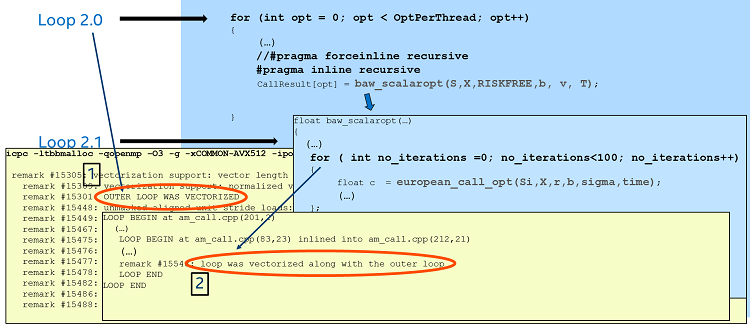
Figure 8: Fragment of optimization report showing both loops vectorized.
Figure 8 shows the sections of the optimization report confirming that both loops have been vectorized. More precisely, as we can see in the line with label 2, the inner loop (Loop 2.1) has been vectorized along with the outer loop, which means that the compiler has generated efficient code, taking into account all the operations involved in the nested loops.
Once the compiler reports a reasonable level of vectorization, we can perform a runtime analysis. For this, we can use Intel Advisor 2018.
Intel Advisor 2018 is one of the analysis tools in the Intel Parallel Studio XE 2018 suite that lets us analyze our application and gives us advice on how to improve vectorization in our code.
Intel Advisor analyzes our application and reports not only the extent of vectorization but also possible ways to achieve more vectorization and increase the effectiveness of the current vectorization.
Although Intel Advisor works with any compiler, it is particularly effective when applications are compiled using Intel compilers, because Intel Advisor will use the information from the reports generated by Intel compilers.
The most effective way to use Intel Advisor is via the graphical user interface. This interface gives us access to all the information and recommendations that Intel Advisor collects from our code. Detailed information can be found at Intel Advisor Support, where documentation, training materials, and code samples can be found. Product support and access to the Intel Advisor community forum can also be found there.
Intel Advisor also offers a command-line interface (CLI) that lets the user work on remote hosts, and/or generate information in a way that is easy to automate analysis tasks; for example, using scripts.
As an example, let us run the Intel Advisor CLI to perform a basic analysis of the example code am_opt.cpp.
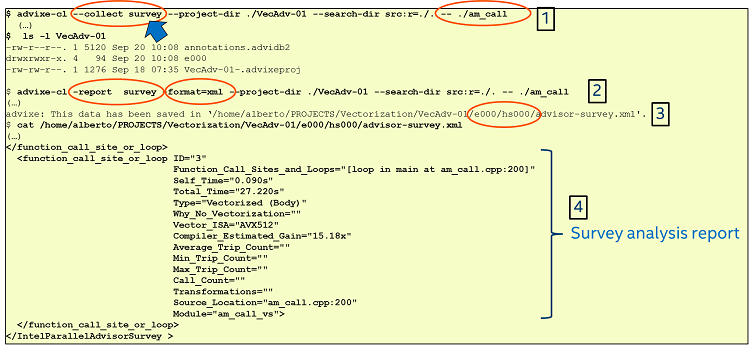
Figure 9: Running Intel® Advisor to collect survey information.
The first step for a quick analysis is to create an optimized executable that will run on the Intel processor (in this case, an Intel Xeon Scalable processor 81xx). Figure 9 shows how we can run the CLI version of the Intel Advisor tool. The survey analysis is a good starting point because it provides information that lets us identify how our code uses vectorization and where the hotspots for analysis are.
The command labeled as 1 in Figure 9 runs the Intel Advisor tool and creates a project directory VecAdv-01. Inside this directory, Intel Advisor creates, among other things, a directory named e000, containing the results of the analysis. The command is:
$ advixe-cl --collect survey --project-dir ./VecAdv-01 --search-dir src:r=./. -- ./am_callThe next step is to view the results of the survey analysis performed by the Intel Advisor tool. We will use the CLI to generate the report. To do this, we replace the -collect option with the -report one (as shown in the command with label 2 in Figure 9), making sure we refer to the project directory where the data is collected. We can use the following command to generate a survey report from the data contained in the results directory in our project directory:
$ advixe-cl -report survey -format=xml --project-dir ./VecAdv-01 --search-dir src:r=./. -- ./am_callThe above command creates a report named advisor-survey.xml in the project directory. If we do not use the –format=xml option, a text-formatted report will be generated. This report is in a column format and contains several columns, so it can be a little difficult to read on a console. One option for a quick read is to limit the number of columns to be displayed using the filter option.
Another option is to create an XML-formatted report. We can do this if we change the value for the -format option from text to XML, which is what we did in Figure 9.
The XML-formatted report might be easier to read on a small screen because the information in the report file is condensed into one column. Figure 9 (the area labeled with 4) shows a fragment of the report corresponding to the results of Loop 2.0.
The survey option in the Intel Advisor tool generates a performance overview of the loops in the application. For example, Figure 9 shows that the loop starting on line 200 in the source code has been vectorized using Intel AVX-512. It also shows an estimate of the improvement of the loop’s performance (compared to a scalar version) and timing information.
Also notice that the different loops have been assigned a loop ID, which is the way the Intel Advisor tool labels the loops in order to keep track of them in future analysis (for example, after looking at the performance overview shown above, we might want to generate more detailed information about a specific loop by including the loop ID in the command line).
Once we have looked at the performance summary reported by the Intel Advisor tool using the Survey option, we can use other options to add more specific information to the reports. One option is to run the Trip counts analysis to get information about the number of times loops are executed.
To add this information to our project, we can use the Intel Advisor tool to run a Trip Counts analysis on the same project we used for the survey analysis. Figure 10 shows how this can be done. The commands we used are:
$ advixe-cl --collect tripcounts --project-dir ./VecAdv-01 --search-dir src:r=./. -- ./am_call
$ advixe-cl –report tripcounts -format=xml --project-dir ./VecAdv-01 --search-dir src:r=./. -- ./am_call
Now the XML-formatted report contains information about the number of times the loops have been executed. Specifically, the Trip_Counts fields in the XML report will be populated, while the information from the survey report will be preserved. This is shown in Figure 10 in the area labeled 5.
In a similar way, we can generate other types of reports that give us other useful information about our loops. The –help collect and –help report options in the command-line Intel Advisor tool show what types of collections and reports are available. For example, to obtain memory access pattern details in our source code, we can run a Memory Access Patterns (MAP) analysis using the -map option. This is shown in Figure 11.
Figure 11 shows the results of running Advisor using the -map option to collect MAP information. The MAP analysis is an in-depth analysis of memory access patterns and, depending on the number of loops and complexity in the program, it can take some time to finish the data collection. The report might also be very long. For that reason, notice that in Figure 11 we selected only the loop we are focusing on in this example, which has a loop ID of 3. In this way, data will be collected and reported only for that loop. The commands we are using (from Figure 11) to collect and report MAP information for this loop are:
$ advixe-cl --collect map --project-dir ./VecAdv-01 --mark-up-list=3 --search-dir src:r=./. -- ./am_call
$ advixe-cl –report map -format=xml --project-dir ./VecAdv-01 --search-dir src:r=./. -- ./am_call
Also notice that the stride distribution for all patterns found in this loop are reported, and information for every memory pattern is reported also. In Figure 11, only one of them is shown (for pattern with pattern ID = “186”, showing a unit stride access).
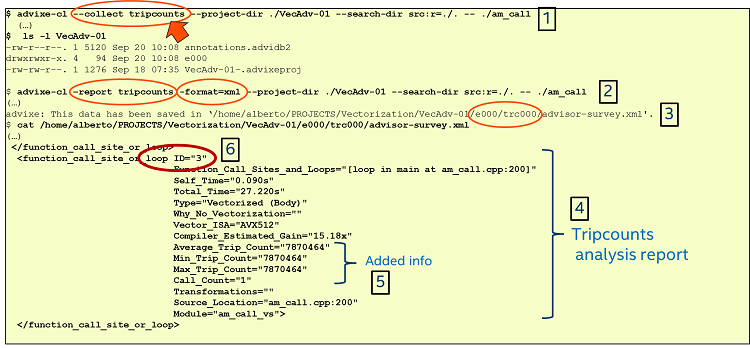
Figure 10: Adding the "tripcounts" analysis.
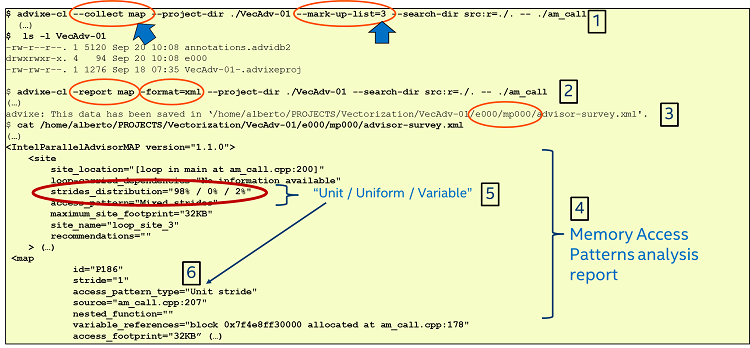
Figure 11: Adding the "MAP" analysis.
Summary
Software needs to take advantage of all opportunities for parallelism present in modern processors to obtain top performance. As modern processors continue to increase the number of cores and to widen SIMD registers, the combination of vectorization, threading and efficient memory use will make our code run faster. Vectorization in each core is going to be a critical step because of the multiplicative effect of vectorization and multithreading.
Extracting good performance from each individual core will be a necessary step to efficiently use multiple cores.
This article presented an overview of vectorization using Intel compilers Intel optimization tools, in particular Intel Advisor XE 2018. The purpose was to illustrate a methodology for vectorization performance analysis that can be used as an initial step in a code modernization effort to get software running faster on a single core.
The code used in this example is from chapter 8 of1, which implements a Newton-Raphson algorithm to approximate American call options. The source code is available for download from the book’s website (http://www.lotsofcores.com/).
References
1. J. Reinders and J. Jeffers, High Performance Parallelism Pearls, vol. 2, Morgan Kaufmann, 2015.
2. Barone-Adesi and W. R. G., Efficient analytic approximation of american option values, J. Finance, 1987.