Abstract
It is often challenging to find bugs in complex libraries, especially those targeting offload accelerators. To ease this challenge, debuggers like Intel® Distribution for GDB * can be used on both CPUs and GPUs. In this article, we use the Intel® Distribution for GDB debugger to pin-point obscure bugs in the ZFP library that we recently migrated to DPC++; ZFP is an open-source library for (de)compression of floating-point arrays that support high-throughput read and write random access, often used in HPC Oil and Gas workloads. We will demonstrate how Intel® Distribution for GDB can be used to step through the DPC++ enabled ZFP library to identify and resolve software bugs and share the best-known methods for characterizing and resolving runtime issues.
Introduction
Application developers often find it challenging to debug complex applications and libraries. This challenge is eased with debuggers. But debugging is not just limited to applications running on CPUs anymore. With the current shift towards heterogeneous computing, application developers have started to adapt to the SYCL-based Data Parallel C++ (DPC++) programming language due to its ease of portability across CPUs, GPUs, FPGAs, and other accelerators, which is collectively known as XPUs. This introduces the need for debugging across different architectures. Intel® Distribution for GDB is one such debugger that can be used to debug on different XPUs.
The Intel® DPC++ Compatibility Tool (DPCT) is often used to assist the migration of CUDA applications and libraries. While DPCT does migrate most of the application or library, it can generate additional code that requires developers’ attention and validation. The Intel® Distribution for GDB becomes very useful when the developer can use it to identify further and fix bugs. This article uses this situation to motivate the use case for using the Intel® Distribution for GDB to show how we pinpointed obscure bugs in the ZFP library we recently migrated to SYCL.
ZFP is an open-source library for compressed floating-point arrays that support high-throughput read and write random access, often used in HPC Oil and Gas workloads. ZFP provides compressed-array classes for 1D, 2D, 3D and 4D arrays. ZFP also supports serial and parallel (OpenMP, CUDA and SYCL) compression of whole arrays, e.g., for applications that read and write large data sets to and from disk. One such application that uses ZFP compression is Reverse Time Migration (RTM).
Problem Statement and Setup
After migrating the CUDA version of the ZFP library to SYCL, we encountered unit test failures, especially the 1D double, 2D float and double and all 3D cases. This article will focus on how to use Intel® Distribution for GDB to identify and resolve the bug by stepping into the migrated ZFP library code.
The DPC++ version of ZFP was debugged on Intel Gen9 GPU. At the time of this writing, the oneAPI version used was 2021.32.0, but this procedure should work similarly with newer versions of the oneAPI distribution.
Setting up ZFP library for the debugging process
To use the Intel® Distribution for GDB, the application/library needs to be set up in debug mode. This involves making changes to CMakeList.txt files or Makefile and rebuilding the application with the inclusion of debug flags. This section will cover the changes that need to be made to the CMakeList.txt file of the ZFP library and the building process of ZFP.
Changes to CMakeList.txt
The ZFP library must be compiled with -g and -O0 or -O2 flags to successfully use the Intel® Distribution for GDB. For ZFP, we will also add -gline-for-tables and -fdebug-info-for-profiling. These changes can be added to CMakeList.txt in the ZFP_root/src directory. ZFP_root is the top directory of the ZFP application. Ensure the below code (for SYCL build) is present in the CMakeList.txt file in the ZFP_root/src directory:
if(ZFP_WITH_SYCL)
SET(CMAKE_CXX_COMPILER "dpcpp")
SET(CMAKE_CXX_FLAGS_PREVIOUS ${CMAKE_CXX_FLAGS})
SET(CMAKE_CXX_STANDARD "11")
SET(CMAKE_CXX_FLAGS  "-fPIC -O0 -std=c++11 -fdebug-info-for-profiling -fsycl" )
SET(CMAKE_EXE_LINKER_FLAGS "${CMAKE_EXE_LINKER_FLAGS} -g -gline-tables-only -lOpenCL -lsycl")
add_definitions(-DZFP_WITH_SYCL)
set(SYCLZFP_SOURCE dpcpp_zfp/syclZFP.dp.cpp)
endif()
Building ZFP
If you already have a ZFP build in your environment, we recommend creating a separate debug build. Follow the instructions below to build the SYCL version of ZFP. At the ZFP_root directory:
$ mkdir debug
$ cd debug
$ cmake -DCMAKE_BUILD_TYPE=Debug -DZFP_WITH_SYCL=1 ..
$ make -j
This will build ZFP successfully with the necessary flags for using Intel® Distribution for GDB. You can test the build with a simple GPU sanity test. Before you test, you will need to compile the simple test cases using the following command:
$ cd ../tests
$ make -f Makefile.gpu
This will compile the sanity test cases successfully and place the executable files in the ZFP_root/bin directory. The source files can be located in ZFP_root/tests/gpu_tests directory. To run the test, use the following commands:
$ cd ../bin
$ ./gpu_sanity_test_1d
$ ./gpu_sanity_test_2d
Other sanity test cases are available to run in the same directory.
To run the unit test cases, go back to the debug directory and run the make test. If you want to run individual SYCL test cases, you can find them located in ZFP_root/debug/bin directory. Some of the command examples to run individual unit test cases are shown below:
$ ./testZfpSycl1dInt32
$ ./testZfpSycl1dFloat
$ ./testZfpSycl1dDouble
$ ./testZfpSycl2dInt64
$ ./testZfpSycl2dDouble
$ ./testZfpSycl3dFloat
When running the tests individually or through make test, the following test fails:
- 1D Double
- 2D Float and Double
- 3D Int32, Int64, Float and Double To identify the bug, Intel® Distribution for GDB will be used.
Debugging using Intel® Distribution for GDB
After building the ZFP SYCL version, Intel® Distribution for GDB can be used to identify the bug that was causing the unit test cases to fail. In this article, we will use a 1d double unit test case as an example. Since this unit test case also failed on the CPU, we will be debugging on the CPU to identify the bug. Nevertheless, similar steps also apply for debugging on a GPU. Once all the environment variables have been set, use the following command to run Intel® Distribution for GDB.
$ gdb-oneapi --args ./testZfpSycl1dDouble
If the debug build was successful with all the flags set correctly, you would see:
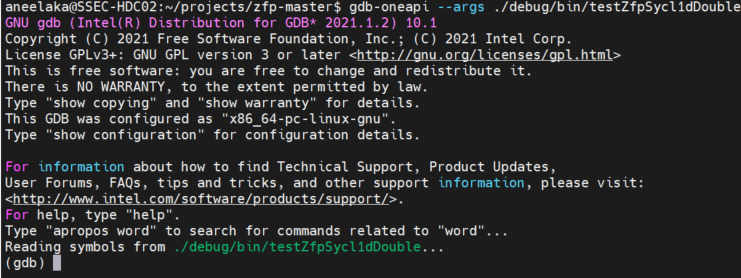
Alternatively, you can also use the -q flag alongside gdb-oneapi, which will invoke the debugger in quiet mode as follows:
![]()
If you do not see “Reading symbols from …” or instead see "No symbols to read", then the debug build failed to read all the flags required for Intel® Distribution for GDB. So make sure to add all the flags as mentioned above before building ZFP.
Some of the commonly used GDB commands are:
- b or breakpoint – to set a breakpoint in the application.
- n or next – to move to the next line of the code.
- s or step – step into a function/kernel.
- r or run – run the application binary from the start.
- c or continue – continue running the application from the current point.
- p or print
variable– print the value of the variable. Different formats of print are- p/t – print in binary format.
- p/o – print in octa format.
- p/x – print in hexadecimal format.
- p – print in decimal format (default).
- info locals – print the values of all variables in the current context.
- l or list – list the next few lines of the code from the current line.
- tui enable – Text User Interface mode is a terminal interface that shows the application/library code alongside the terminal where GDB commands can be entered (as shown in the image below). By default, this mode is disabled, and hence you only have a terminal interface without the code being shown.
Refer to Appendix B for additional GDB commands.
A pre-step to using the Intel® Distribution for GDB was to narrow down the array indices that were causing the unit tests to fail. This was done by comparing the compressed array of the serial ZFP library to the SYCL ZFP library. This part is covered in detail in Appendix A. During this pre-step, we identified that less than 20 out of a million indices failed due to incorrect encoding. Upon further investigation, we identified that
- either a couple of bits (out of the 64 bits) were flipped.
- or in some cases, it was an overflow of the bits.
Since ZFP uses bitwise encoding, the p/t GDB command will be used later to identify the bug.
Parallelization of the ZFP library is done by combining four indices into one block and performing encoding and decoding on these blocks (called block ids) in parallel. Thus, once we printed the encoded array, we could find the block ids where the error occurred. In this article, block id = 65534 will be used to identify the error.
Stepping through the SYCL ZFP library and its device kernels
When passing the unit test binary as an argument to Intel® Distribution for GDB, the program executes from the main function of the unit test. Therefore, the easiest way to enter the ZFP library is to directly insert a breakpoint within the ZFP library SYCL code at our desired line number. Alternately, you can also use the step command (s or step) at the ZFP SYCL function call to step into the library.
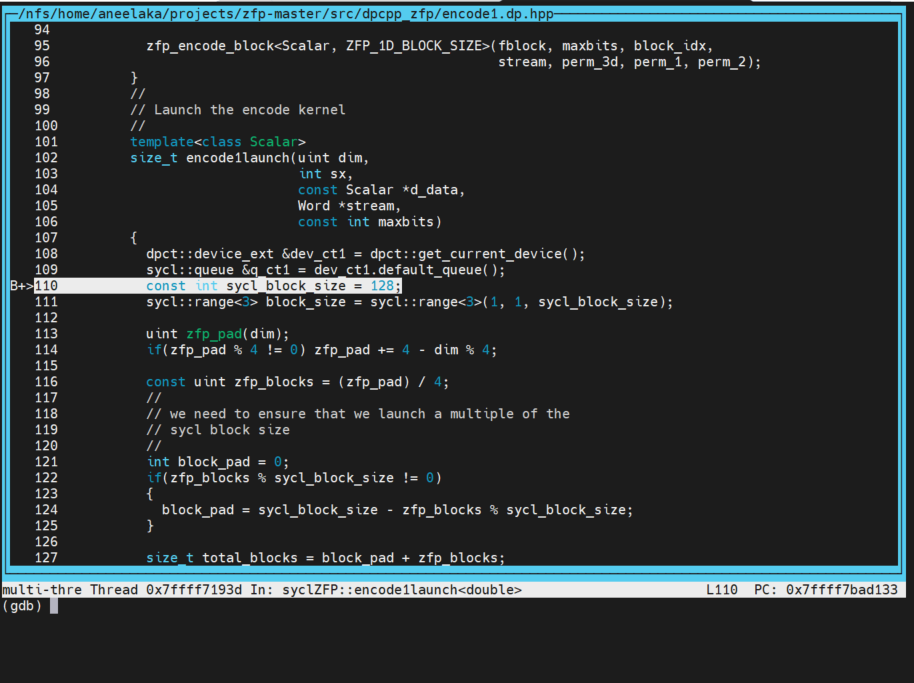
For the process of stepping into the ZFP library SYCL code, the unit test binary considered here is testZfpSycl1dDouble. First, we insert a breakpoint in encode1.dp.hpp at line number 110, within the function encode1launch. This function runs on the host where the SYCL queues are set up, and the device kernel is launched. When the breakpoint is inserted in this code, you receive the following message:
Reading symbols from ./bin/testZfpSycl1dDouble...
(gdb) b encode1.dp.hpp:110
No source file named encode1.dp.hpp.
Make breakpoint pending on future shared library load? (y or [n]) y
Breakpoint 1 (encode1.dp.hpp:110) pending.
There is no source file encountered yet because we haven’t run the binary, which has currently only read the main function of the unit test case and nothing within the library. But once you run the binary with the run or r command, it will break at the encode1.dp.hpp:110 as shown in image below.
Once you step into the host part of the ZFP library code, you can use the regular GDB commands to execute one line at a time until you reach the kernel invocation. The kernel invocation is done using lambda functions in SYCL. In a simple C++ program, stepping into a function is as simple as using the GDB command s or step when present on the function call line. Of course, this would apply to regular functions in SYCL/DPC++ programs too. But to step into a device kernel through lambda function in SYCL, the same GDB command won’t suffice. Instead, using the s or step command will step into the SYCL header files.
To step into a device kernel call, we will need to insert another breakpoint within the kernel function and continue execution to that breakpoint. This will forward execution to the breakpoint within the device kernel. Going from one device kernel to another within the same kernel function can be done using the regular step command (s or step).
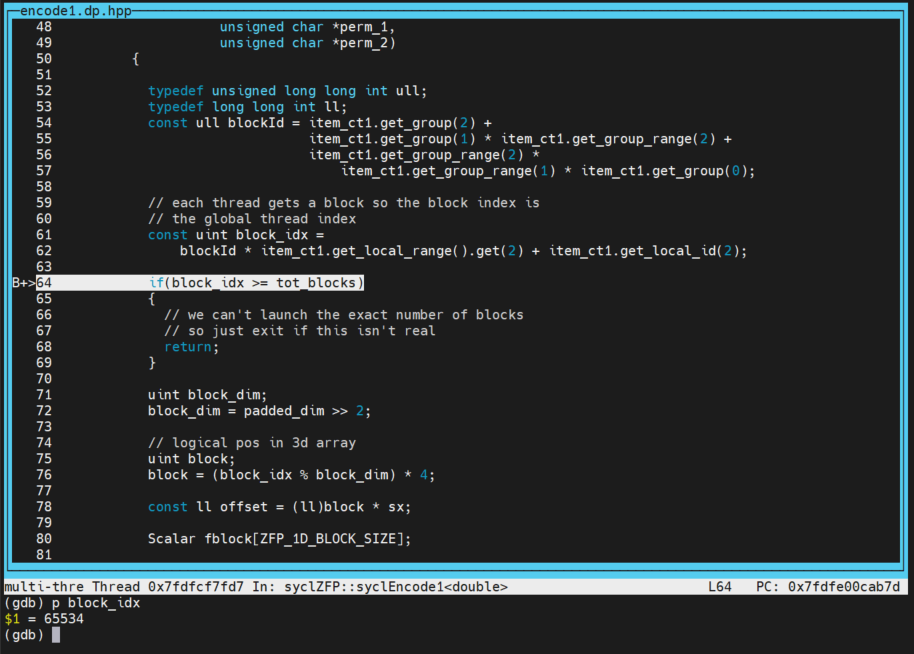
As mentioned before, we will be using block id=65534 when inserting the breakpoint within the device kernel, syclEncode1, present in the same source code, encode1.dp.hpp at line number 64 using the command:
b 64 if block_idx==65534
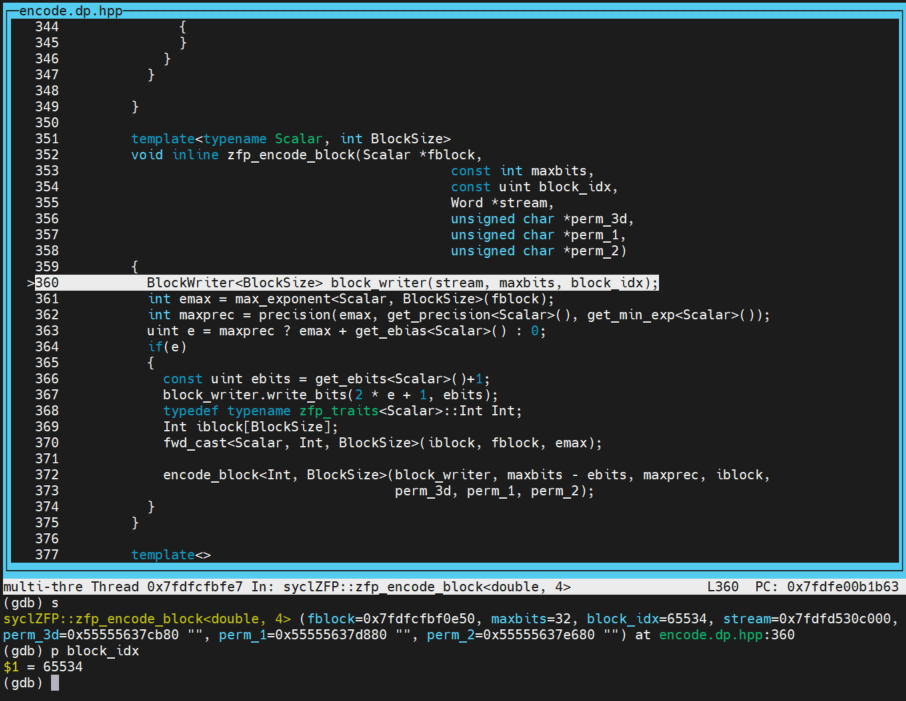
Since it is present in the same source code, you don’t have to mention the file's name. Once the breakpoint has been inserted, you continue the execution using continue or c. This will step into the device kernel, syclEncode1 for block id=65534. The below image also shows the printed value of block_idx.
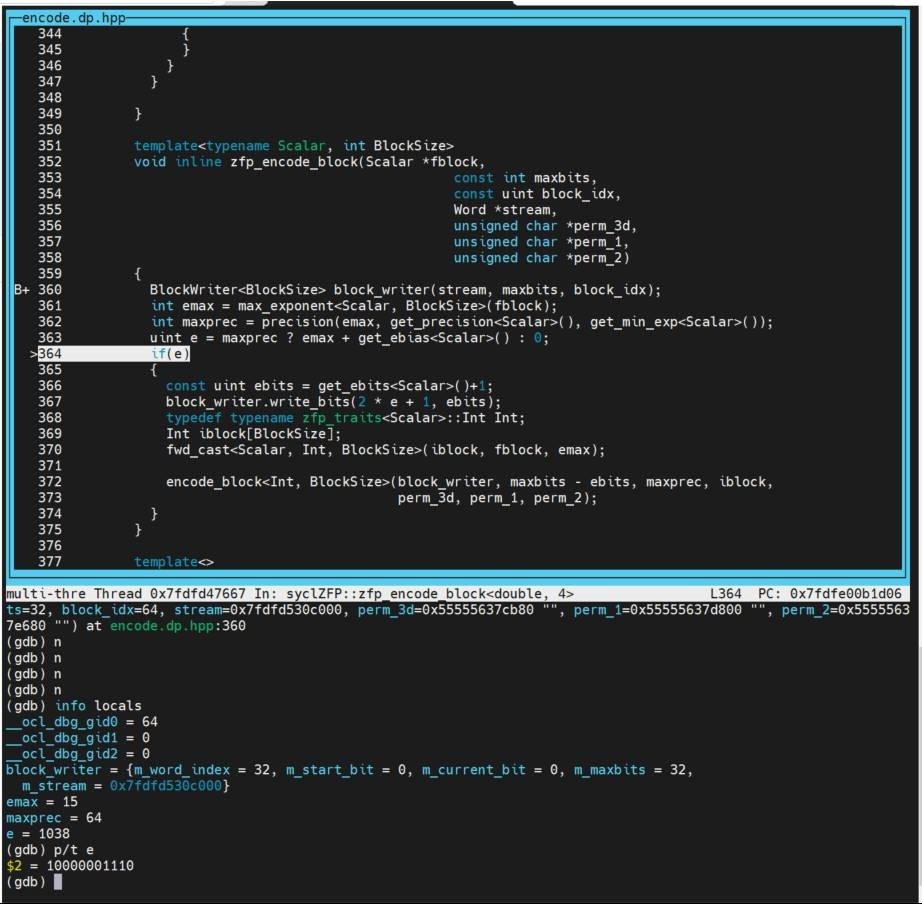
This kernel includes a function call to the zfp_encode_block kernel that also runs on the device. Since we are already in the device code, we can step into this kernel using the step or s command. It is unnecessary to use a breakpoint to step into this function like we had to do before since we are already in the device kernel. The image below shows after stepping into the zfp_encode_block kernel. Since we used the if condition while breaking into the kernel code, the debugger will execute for that condition only. This can be seen as locking onto the thread that is executing the if condition.
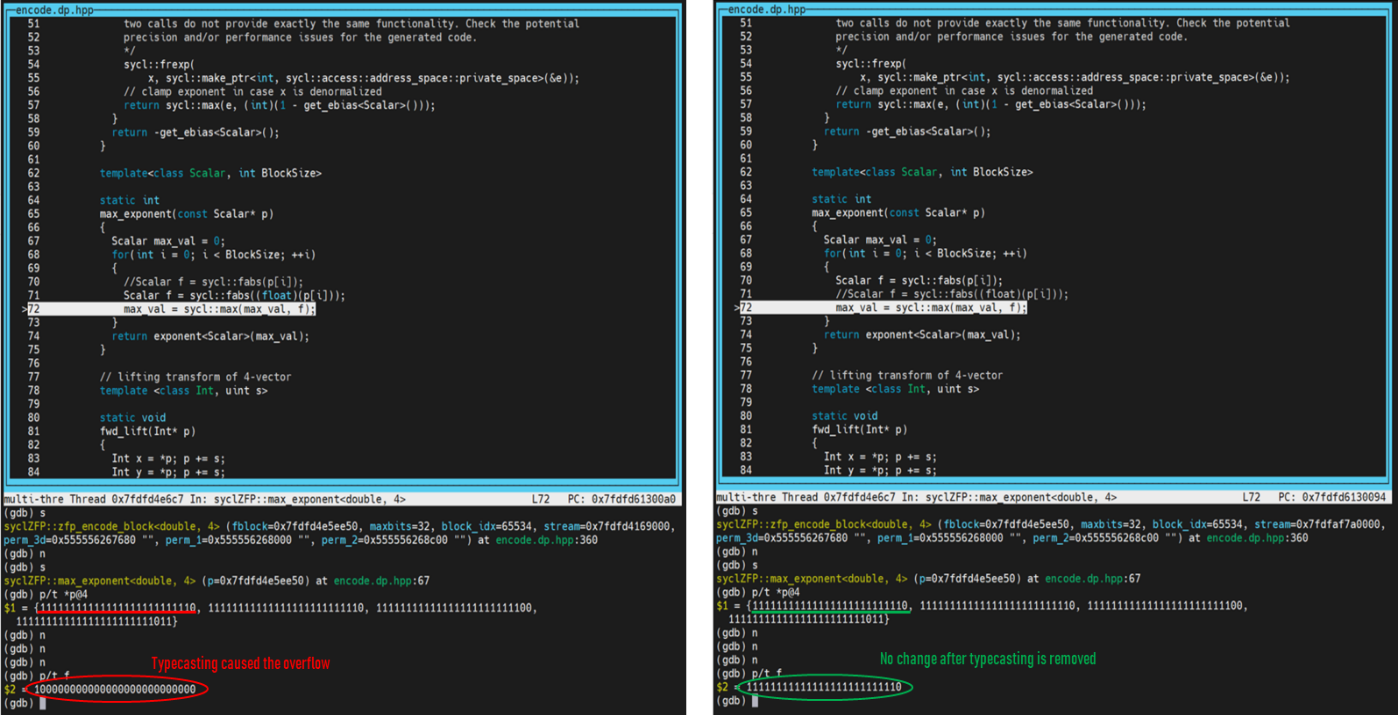
The encoding of each block takes place in the encode_block kernel that will be called in this kernel. This kernel essentially preps the values in the variable fblock to be encoded. In preparation, the variable emax needs to be calculated through the function max_exponent that uses the variable fblock as an input argument. Once we step into this function, we see the max of the four values within the fblock initially converted, but the values are typecasted to a float during this process. This ended up in loss of precision thus causing the bits to overflow. This would lose the precision and hence was suspected to be a bug that could have caused the tests to fail. At this point, we used the p/t command to print the values in bits. On the left side of the image below, it shows how the first value in the block overflows with the typecasting, and the right side of the image shows that it does not overflow without the typecasting.
To understand why there was typecasting, the CUDA version was compared to the migrated SYCL-based DPC++ version of ZFP. The comparison showed there was no typecasting present in the CUDA version, and hence the typecasting was done during the migration process.
Following this discovery, the float typecasting was removed, and ZFP was recompiled. This time the 1D double unit test ran successfully.
Conclusion
Debugging complex libraries like ZFP that target offload accelerators can be eased with the Intel® Distribution for GDB. It would have been extremely time-consuming to find this bug in the migrated ZFP code without a debugger. Although the DPCT migration is evolving positively, it is also possible that functional issues need to be addressed after the migration process. Hence, it is advantageous to use Intel® Distribution for GDB in such cases.
This article demonstrated how to use Intel® Distribution for GDB to step into a complex library like ZFP on both the host and the kernel code. Using Intel® Distribution for GDB, we successfully identified and fixed the bug that caused the unit test cases to fail in the first place. Application developers are strongly encouraged to take advantage of powerful debuggers like the Intel® Distribution for GDB.
REFERENCE
- Debugging SYCL Programs on Heterogeneous Intel® Architectures
- Get Started with Intel® Distribution for GDB* on Linux* OS Host
Appendix A – Identifying indices with incorrect encoding
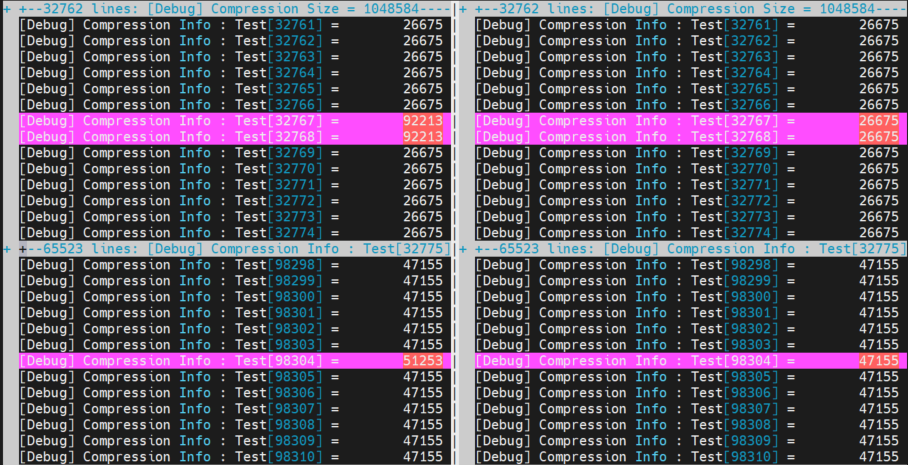
On running the SYCL 1dDouble unit test case, it was identified that the tests were failing during the checksum matching after encoding. Hence, a print statement was inserted in the ZFP library after the encoding process (before the checksum matching function) to output the encoded array on both the SYCL and the serial versions of their respective 1dDouble test case. Once the results were obtained, they were compared using the vimdiff command, as shown in the image below. The image highlights the indices in which there were mismatches.
When the decimal representation of these values is converted to binary representation, you notice that only a couple of bits are flipped along with an overflow bit, ass shown in the image below. The reason to view them in binary is that ZFP encoding involves a lot of bitwise operations. This helps narrow down the search for the bug.
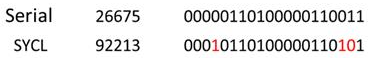
With this investigation, we now have a better understanding of where to look for the bug in the SYCL version of the ZFP library. Now, we can use Intel® Distribution for GDB to locate and fix the bug.
Appendix B – Additional GDB commands
Here are some additional GDB commands which might be useful during the debugging process. Some of the commonly used GDB commands are:
- info inferiors – Display information about the inferiors. GPU debugging will display additional inferior(s).
- info threads
thread– Display information about the threads, including their active SIMD lanes. - thread
thread:lane– Switch context to the SIMD lane of the specified thread. - thread apply
thread:lanecmd– Applycmdto specified lane of the thread. - set scheduler-locking on/step/off – Lock the thread scheduler. Keep other threads stopped while the current thread is stepping (step) or resumed (on) to avoid interference. Default (off).
- set nonstop on/off – Enable/disable nonstop mode. Set before the program starts. (off) : When a thread stops, all other threads stop. Default. (on) : When a thread stops, other threads keep running.
- print/t $emask – Inspect the execution mask to show active lanes.
- delete
Nor dN– Remove Nth breakpoint. - info break – Show defined breakpoints.
- disassemble – Disassemble the current function.
- backtrace or bt – Show the function call stack.