How to Balance Advanced Code Optimization, Code Size, and Symbol Info Accuracy
When using the Intel® oneAPI DPC++/C++ Compiler or Intel® Fortran Compiler, developers have a variety of options at their disposal to control both
- The ability to debug an application
- The optimization levels applied to the compiler’s SPIR-V* and binary output.
These options can significantly affect the generated debug information, executable size, build times, and performance.
This post will explore the top-level compiler optimization options, what they do, and how they impact the debug info and code size. All referenced options assume the Linux* targeted compiler versions. Compiler options for Windows* may be slightly different.
Optimization Options
The compiler provides several optimization levels, each with a different focus:
-O0:
This flag turns off most of the compiler optimization. This level generates the largest and slowest code but retains all debug information and is ideal for debugging.
-O1/-Os:
Optimize for size. It omits optimizations that tend to increase object size and creates the smallest optimized code in most cases.
-O2:
Maximize speed. The default setting for Intel® compilers enables many optimizations, including vectorization and intra-file inter-procedural optimizations. In most cases, this creates faster code than -O1.
-O3:
Enables -O2 optimizations plus more aggressive loop and memory-access optimizations, such as scalar replacement, loop unrolling, and loop blocking, to allow more efficient use of cache and additional data prefetching. This option is recommended for applications that have loops with many floating-point calculations or process large data sets. These aggressive optimizations may occasionally slow down other types of applications compared to -O2.
A detailed list of all compiler optimizations can be found in the Compiler Developer Guide .
Choosing a compiler optimization level is crucial for controlling the trade-off between performance and debuggability. The Intel compilers default to an optimization level of -O2, which contrasts with most other compilers, such as GCC or Clang that default to -O0. Moreover, users do not expect “-g”, which generates debug information, also to change their optimization levels. However, specifying "-g" without an explicit optimization level with Intel compilers will automatically set the optimization to -O0, overriding the default -O2. This behavior is unique to Intel compilers and can catch developers off guard if they are accustomed to the defaults of other compilers, potentially leading to unexpected performance characteristics in their debug builds. Developers must be aware of these differences and explicitly specify optimization levels to ensure consistent behavior across different toolchains.
Note: The Intel compiler default optimization level is -O2, except when symbol info generation is requested using -g. Then the default optimization level reverts to -O0
Higher optimization levels generally reduce the size of the executable and improve runtime performance but can make debugging more challenging because the relationship between source code and generated code is more complex. When compiling with different optimization levels, the compiler may make transformations to the code that can affect the debugging experience. For example, variables may be optimized away, or entire blocks of code may be removed if the compiler deems them unnecessary. Here's an example where the code might be optimized out at higher optimization levels, potentially affecting the use of breakpoints and variable inspection in a debugger:
#include <iostream>
int main() {
int a = 10;
int result = 0;
for (int i = 0; i < 1000000; ++i) {
result += a;
}
if (result > 0) {
std::cout << "Positive result: " << result << std::endl;
}
return 0;12.	}
When you compile this code with -O0 with the Intel oneAPI DPC++/C++ Compiler (compiler front-end command line driver “icpx”), the compiler performs no optimizations. All variables are preserved as-is, and the debugger can honor a breakpoint placed on any line of the code. For example, setting a breakpoint at line 6 and then stepping through each iteration of the loop is possible because the loop is
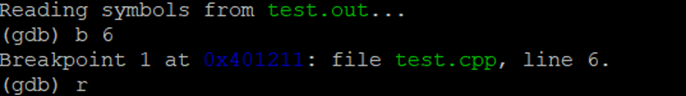
fully present in the executable:
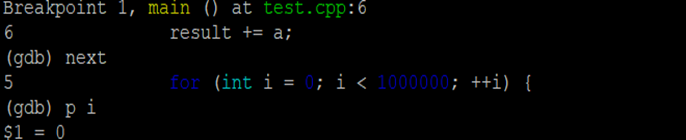
However, when you compile with -O2, the compiler might optimize the loop, recognizing that it can be reduced to a single calculation (result = 1000000 * a;).
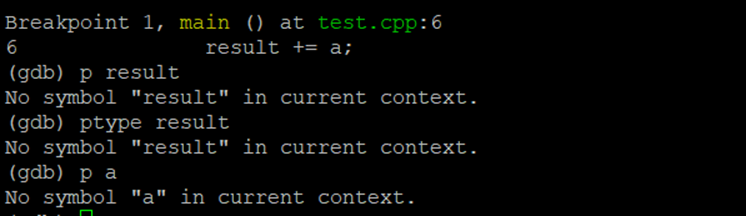
This optimization eliminates the loop and leads to a typical scenario when debugging optimized code: Any breakpoints set inside the loop would not be honored because the corresponding code no longer exists in the optimized executable. Attempting to step into the loop with GDB will result in the debugger skipping over the loop entirely as if it were a single operation:
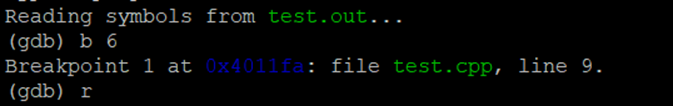
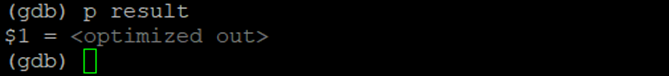
In the above example, you can see that GDB has skipped setting the breakpoint at line 6 but set it in line 9 instead, bypassing the loop. Additionally, if you try to inspect the value of the variable result, you may find that it has been optimized out and is not available:
The Impact of Interprocedural Optimization
Another important optimization option that can affect debugging is Interprocedural Optimization (IPO). This option allows the compiler to perform optimizations across source files and analyze multiple functions and modules, allowing it to detect patterns and make optimizations that are not possible when compiling code separately. For example:
// File: math_functions.c
int square(int x) {
    return x * x;
}

// File: main.c
#include "math_functions.h"

int main() {
    int result = square(4);
    // ... rest of the program
}
When compiling code without IPO, the compiler optimizes square() and main() separately. It does not know how square() is used in main(), so it assumes that square could be called with any integer value.
With IPO enabled, the compiler can analyze both the functions together. It notices that square is only called with a constant value of 4. The compiler can then perform a constant propagation optimization, replacing the call to square(4) with the constant 16. This eliminates the need to call the function at runtime, resulting in faster code. This, of course, affects debugging since the generated machine code does not correspond directly to the source code. The debugger may not be able to step into the square function, and it can be difficult to inspect the values of variables and understand the flow of the program. A comprehensive list of optimizations applied with –ipo can be found in the Compiler Developer Guide.
Developers should be aware that any optimization that alters the generated machine code will affect debugging. Some of these optimizations include but are not limited to: Loop Permutation, Loop Distribution,
Loop Fusion, Loop Unrolling, Variable assignment to registers, Vectorization as part of loop unrolling, etc.
Debug Options
-g:
The -g option tells the compiler to generate debug information. This information is crucial when debugging your program using a debugger like GDB or Intel® Distribution of GDB. It includes data about variable names, data types, line numbers, and conditional code branches, which are essential for stepping through code and setting breakpoints. On Linux* using -g increases the size of the executable because it embeds additional information into the binary. Use -g when you need to debug your program and require detailed information about its execution. It is typically used during the development phase and is often turned off for production code to reduce the executable size and avoid potential security issues.
When you pass -g to the compiler, it embeds information about the source code into the executable, which increases the size of the executable, and it may include details that are not always necessary for every debugging scenario.
-gline-tables-only:
A flag that can help reduce an executable's size is the -gline-tables-only flag. It is a more lightweight version of the -g flag. With -gline-tables-only, the compiler generates minimal debug information, including just enough to allow source-level debugging. Specifically, it includes line number information, which maps the machine code back to the source code lines. This allows a debugger to correlate the program's execution with the source code, enabling you to set breakpoints and step through the code line by line. For example, the code above compiled without the -gline-tables-only flag produces an executable of 30296 bytes, while with the flag, its size reduces to 18240 bytes.
With -gline-tables-only, the debug information does not include other details such as the types of variables, the structure of the program's data, or local variable information. This means that while you can still debug at the source level, you may not be able to inspect the values of variables or get detailed type information.
It can be beneficial when you want to keep the binary size smaller or are only interested in basic debugging capabilities. It is also useful in scenarios where you want to have some level of debugging information but are concerned about revealing too much about the program's internals, which might be the case for certain proprietary or sensitive applications.
-gsplit-dwarf :
Another area where the presence of debug information has an effect is build times. In an incremental build, the main time-consuming task is linking due to the overhead of rebuilding libraries or executables with changed source files and relinking dependent binaries, often from scratch. Additionally, the linker processes all debug information, which is large and accounts for most of the size in both input object files and output binaries.
This processing of debug information is also a significant build performance bottleneck in incremental builds despite being crucial for debugging. Incremental build times could be significantly improved if the linker did not have to process debug information. Split DWARF addresses allow this by creating a separate file for debug info with a .dwo extension, allowing the linker to bypass it. This technique, which uses the DWARF debugging file format common on Unix systems, results in binaries that contain references to these .dwo files instead of the debug information itself.
For example, the code referenced above in the article compiled with -gsplit-dwarf creates an executable of p only 20776 bytes, in contrast to the executable compiled without it, which is 30296 bytes. The reason is that it references the debug info instead of containing it:
readelf -wi test-split-dwarf.out | grep dwo
    <14>   DW_AT_GNU_dwo_name: (indirect string, offset: 0x2f): test-split-dwarf.out-test.dwo
    <18>   DW_AT_GNU_dwo_id  : 0xa704d743512e55f5
That reference is already present in the object file, so all the linker had to do regarding debugging information was copy that reference. Since the test case is small, the improvements are negligible, and there would be no noticeable increase in incremental build time because we are dealing with just a single source file. But for large C++ projects with multiple source files, this flag can be essential in speeding up incremental builds.
In conclusion, Intel's compiler options for debugging and optimization allow developers to balance the need for detailed debug information with the desire for high-performance executables. The -g option is crucial for debugging, while optimization flags like -O0 to -O3 allow for tailored performance enhancements. Debug flags like -gline-tables-only and -gsplit-dwarf can be used to reduce the size of an executable and improve build times. However, a developer should be aware that higher optimization levels can complicate debugging by altering code structure and optimizing away certain elements, making debugging more difficult.
Learn More About Balancing Debugging and Optimization
There are a lot more interesting nuances when it comes to debugging optimized code.
- Check out the Intel Compiler Optimization Options in the
- Intel® oneAPI DPC++/C++ Compiler Developer Guide and Reference
- Intel® Fortran Compiler Developer Guide and Reference
- Check out the Intel Compiler Debug Info Generation Options in the
- Intel® oneAPI DPC++/C++ Compiler Developer Guide and Reference
- Intel® Fortran Compiler Developer Guide and Reference
- Check out Debug Guidance in the
Download the Compiler and Debugger Now
You can download the Intel oneAPI DPC++/C++ Compiler and the Intel Distribution for GDB on Intel’s oneAPI Developer Tools product page.
They are also included in the Intel® oneAPI Base Toolkit, which includes an advanced set of foundational tools, libraries, and analysis, debug and code migration tools.
Additional Resources
[1] Methods to Optimize Code Size
[2] CLANG* Compiler User’s Manual
[3] Productive C++: Improving C++ Builds with Split DWARF