What can you do if you suspect that you have memory violations on the stack?
Stack memory issues are usually not a problem for most users, so Intel® Inspector does not enable this expensive functionality by default. However, if you need to check for these issues, you can use a custom analysis to enable this functionality.
Consider the following code where all local variables in a function are created in stack and go out of scope when the function returns. So you would expect to see a memory issue.
#include <iostream>

int foo(char** bb, double **dd)
{
  char* aa = "aaaa";
  double barray [10];

  barray[0] = 100.0 + rand() % 99;
  std::cout << "local d: " << barray[0] << std::endl;
  *dd = barray;
}

int main()
{
  char* cc = "bbbb";
  std::cout << cc << std::endl;
  double *dd;
  foo(&cc, &dd);
  std::cout << "after fct call: " << cc << ", dd: " << dd[0] << std::endl;
}
To see stack memory errors:
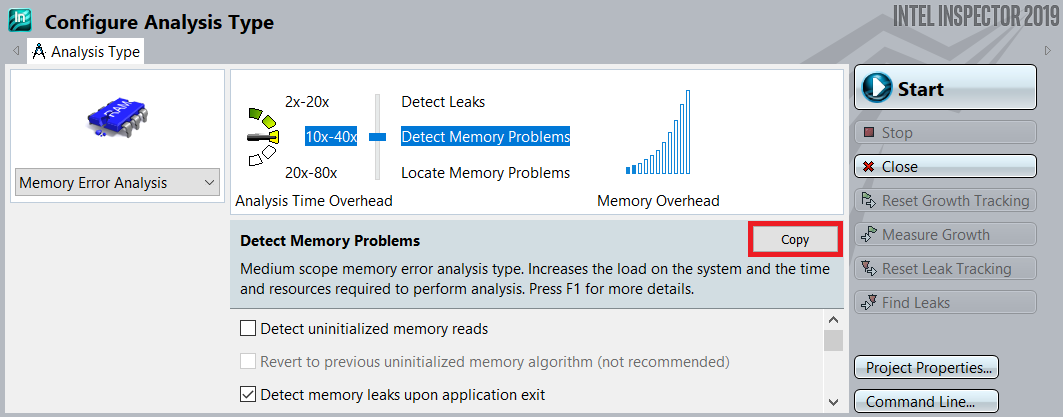
- Choose a Detect Memory Problems or Locate Memory Problems analysis type when you configure a memory error analysis. When you scan the Details region, notice that Analyze stack accesses is disabled.
- Click the Copy button to create a custom analysis.
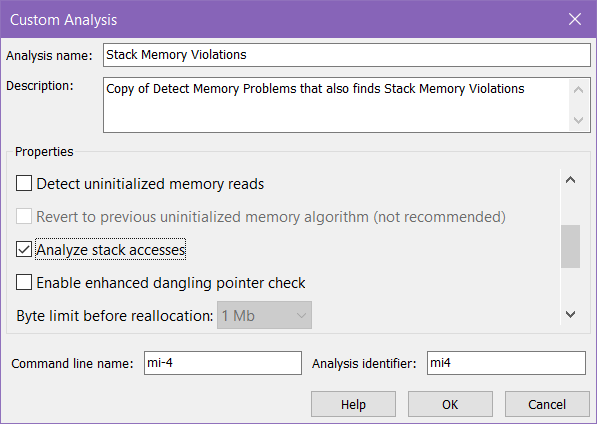
- Complete the Custom Analysis dialog box. (Make sure you enable Analyze stack accesses and choose an Analysis name you will remember.
- Run the memory error analysis using this custom analysis type.
To analyze stack memory violations in the future, simply choose this custom analysis type.
This functionality is available via the command line, but setting up the command can be tricky. We recommend preparing the custom analysis type in the GUI and then clicking the Command Line… button in the lower right corner of the Configure Analysis Type window. For this particular example, this yields the following command line:
inspxe-cl -collect mi-4 -mrte-mode=auto -module-filter-mode=include -app-working-dir C:\Banner.exe