Get Started with Intel® Distribution for GDB* on Windows* OS Host
Get Started with Intel® Distribution for GDB* on Windows* OS Host
Start using the Intel® Distribution for GDB* for debugging applications. Follow the instructions below to set up the debugger to debug applications with kernels offloaded to CPU devices.
Intel® Distribution for GDB* is available as part of the Intel® oneAPI Base Toolkit. For more information on oneAPI toolkits, visit the product page.
Visit the Release Notes page for information about key capabilities, new features, and known issues.
You can use a SYCL* sample code, Array Transform, to get started with the Intel® Distribution for GDB*. The sample does not generate errors and simply illustrates debugger features. The code processes elements of the input array depending on whether they are even or odd and produces an output array. You can use the sample to debug on a CPU.
Prerequisites
Install the Intel® oneAPI Base Toolkit for Windows* OS.
Install Microsoft Visual Studio* 2019 or 2022.
NOTE:Support for Visual Studio* 2017 is removed starting Intel® oneAPI 2022.2 release.
Get Started with CPU Debugging
Build the Application
In Microsoft Visual Studio*, go to File > New > Browse Intel oneAPI Samples and select Debugger: Array Transform.
If you have already fetched the sample or you have your own sample, simply open the solution file with Microsoft Visual Studio*.
In the Solution Explorer, right-click the array-transform project and select Properties. Alternatively, press Alt+Enter.
Under Configuration Properties, select General and set Platform Toolset to Intel® oneAPI DPC++ Compiler.
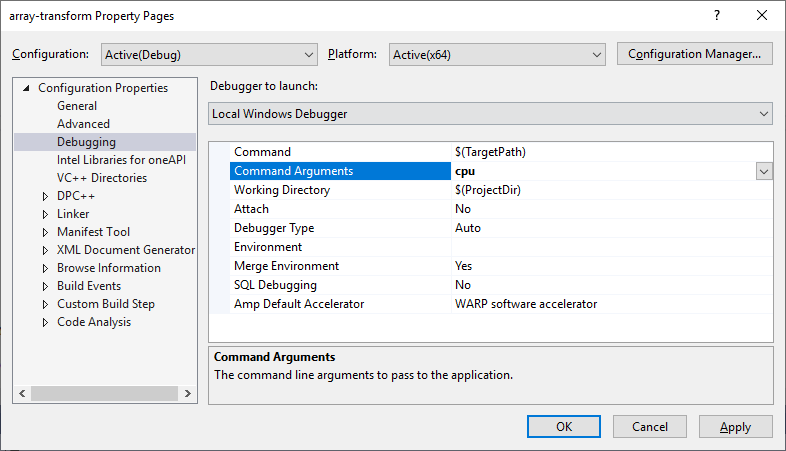
Under Configuration Properties, select Debugging. Set Command Arguments to cpu.
Select Linker and set the Pass additional options to device compilers field to /Od. This setting disables kernel optimizations to provide a smooth debug experience.
Click Apply to save the changes.
To build the solution, select Build > Build Solution in the main Visual Studio toolbar. In the Output window, verify that the build is successful.
Debug the Application
You are ready to debug your project.
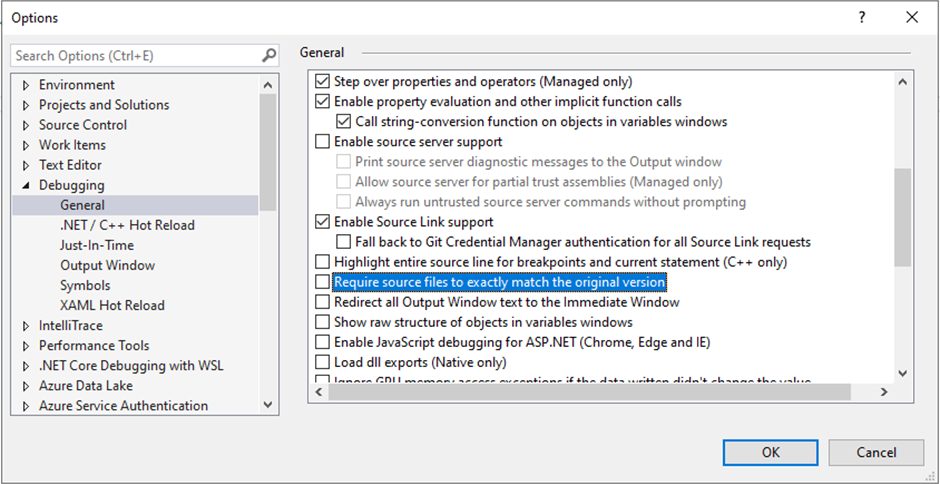
Open Tools > Options > Debugging.
Uncheck the option “Require source files to exactly match the original version”.
Set breakpoint at line 83 in the array-transform.cpp file.
From the Debug menu, select Start Debugging.
Click the Local Windows Debugger menu.
You will see when the thread hits the breakpoint.
Learn More
Document |
Description |
|---|---|
This document describes the basic scenarios to follow while debugging SYCL* and OpenCL with Intel® Distribution for GDB*. |
|
This document describes all common tasks that you can complete with Intel® Distribution for GDB* and provides necessary technical details. |
|
The notes contain information about key capabilities, new features, and known issues of Intel® Distribution for GDB*. |
|
This page contains brief introduction on oneAPI toolkits and links to useful resources. |
|
This small SYCL* application has two versions: bugged and fixed. Use the sample to exercise application debugging with Intel® Distribution for GDB*. |
Notices and Disclaimers
Intel technologies may require enabled hardware, software or service activation.
No product or component can be absolutely secure.
Your costs and results may vary.
© Intel Corporation. Intel, the Intel logo, and other Intel marks are trademarks of Intel Corporation or its subsidiaries. Other names and brands may be claimed as the property of others.
No license (express or implied, by estoppel or otherwise) to any intellectual property rights is granted by this document.
The products described may contain design defects or errors known as errata which may cause the product to deviate from published specifications. Current characterized errata are available on request.
Intel disclaims all express and implied warranties, including without limitation, the implied warranties of merchantability, fitness for a particular purpose, and non-infringement, as well as any warranty arising from course of performance, course of dealing, or usage in trade.
OpenCL and the OpenCL logo are trademarks of Apple Inc. used by permission by Khronos.