Introduction
This document presents developer guidance and optimization methods for the graphics hardware architecture of Intel® Processor Graphics Gen11. It provides developers best practices to most effectively harness the architecture’s capabilities and peak performance. The document also provides specific API guidance for using the latest graphics APIs on Intel Processor Graphics Gen11.
The intended audience of this guide is developers who seek to optimize their interactive 3D rendering applications for Gen11. It is assumed that the developer has a fundamental understanding of the graphics API pipelines for Microsoft DirectX* 12, Vulkan*, and/or Metal 2*. Gen11 also supports the DirectX 11 and OpenGL* graphics APIs; however, there are performance benefits and lower CPU overhead for applications that use the newer and lower level APIs such as DirectX12, Vulkan, and Metal 2, and also new graphics architecture features that are only available in these APIs.
Intel® Gen11 Architecture Highlights
Gen11 offers improved performance and efficiency over Gen9, and new features such as coarse pixel shading, tile-based rendering, and new display controller features. In addition, Gen11 offers the following improvements over previous generations:
- Compute capabilities that deliver up to a teraflop of performance
- Significantly lower shared local memory (SLM) latency
- Larger L3 cache size
- Increased memory bandwidth
- Improved multisample anti-aliasing (MSAA) performance
For a more in-depth overview of the Gen11 architecture and new features, see the Intel® Processor Graphics Gen11 Architecture guide.
Tile-Based Rendering
Gen11 implements a tile-based rendering solution known as position only shading tile-based rendering (PTBR). The motivation of tile-based rendering is to reduce memory bandwidth by efficiently managing multiple render passes to data per tile. In order to support tile-based rendering, Gen11 adds a parallel geometry pipeline that acts as a tile binning engine. It is used ahead of the render pipeline for visibility binning pre-pass per tile. It loops over geometry per tile and consumes visibility stream for that tile. PTBR uses the L3 cache to keep per tile data on die, reducing external memory bandwidth. For more information, refer to the architecture guide or talk with an Intel application engineer to see if your workload will benefit.
Coarse Pixel Shading
Coarse pixel shading, also known in DirectX 12 as variable-rate shading, gives the programmer the ability to vary the shading rate independent from the render target resolution and rasterization rate. Among other use cases, this feature allows developers to reduce the number of pixel shader invocations with content that has slowly varying shading parameters, or for pixels that may be blurred later in the rendering pipeline. The feature enables developers to direct shader operations to the pixels that matter most in their content. This can provide a better visual solution than rendering at a lower resolution and then upscaling, since we preserve the depth and stencil at full pixel rate. Gen11 hardware supports DirectX 12 variable-rate shading (VRS) Tier 1.
High Dynamic Range Displays
Gen11 adds improved support for high dynamic range (HDR) displays. To make use of this capability, refer to the Microsoft document, High Dynamic Range and Wide Color Gamut Overview.
Adaptive Sync—Variable Refresh Rate
Adaptive Sync is the VESA standard for variable refresh rate displays. This display controller and display feature enables a better experience for the user by reducing tearing and stuttering. Adaptive Sync may also reduce overall system power consumption. Basic requirements for Adaptive Sync are:
- Full screen rendering by the game or 3D application
- Simple application swap chain modification to ensure asynchronous buffer flips
- A Gen11 or later graphics device with DisplayPort 1.4 VESA Adaptive Sync support
- A DisplayPort 1.4 VESA Adaptive Sync capable display panel
- Windows® 10 RS5 and beyond
The game or 3D application must ensure that its rendering swap chain implements asynchronous buffer flips. On displays that support Adaptive Sync, this results in smooth interactive rendering, with the display refresh dynamically synchronized with the asynchronous swap chain flips. If application and platform conditions are met, the Gen11 driver enables Adaptive Sync by default. There is also an option to disable it using the Intel graphics control panel.
Tools for Performance Analysis
Use a suite of Intel software tools to analyze and optimize the performance of graphics applications running on your CPU or Graphics Processing Unit (GPU):
| Performance Analysis Tool | Description | Download Link |
|---|---|---|
| Intel® Advisor | Use this toolset to ensure that your C/C++, Fortran, Data Parallel C++, OpenMP*, and OpenCL™ native/managed applications realize maximum performance on modern processors | Download Intel® Advisor |
| Intel® VTune™ Profiler | Find and fix performance bottlenecks in CPUs, GPUs, and FPGAs | Download Intel® VTune Profiler |
| Intel® Graphics Performance Analyzers (GPA) | Use this toolset for graphics performance analysis and optimization of games as well as graphics-intensive applications | Download Intel® GPA |
Other tools like RenderDoc*, Microsoft PIX*, and Windows* Performance Analyzer may work on Intel platforms and can also provide valuable information about the performance of your application. For more information, see their product documentation.
Intel® VTune™ Profiler
Use Intel® VTune™ Profiler as a performance analysis tool to locate CPU or GPU bottlenecks and optimize applications for improved performance. You can also use this tool to identify:
-
The most time-consuming (hot) functions in your application and/or on the whole system
-
Sections of code that do not effectively utilize available processor time
-
The best sections of code to optimize for sequential performance and for threaded performance
-
Synchronization objects that affect the application performance
-
Whether, where, and why your application spends time on input/output operations
-
Whether your application is CPU or GPU bound and how effectively it offloads code to the GPU
-
The performance impact of different synchronization methods, different numbers of threads, or different algorithms
-
Thread activity and transitions
-
Hardware-related issues in your code such as data sharing, cache misses, branch misprediction, and other cases
Learn More about VTune Profiler:
- Intel® VTune™ Profiler User Guide
- Get Started with Intel® VTune™ Profiler
-
Optimize Applications for Intel® GPUs with Intel® VTune™ Profiler
Automatic DirectX* Frame Detection for Windows*
You can use VTune Profiler on Windows systems to detect slow frames and DirectX events. This way, you can filter the events in a slow frame.
Learn More about Frame Analysis:
Frame and Event API
Use the Frame and Event APIs in VTune Profiler to customize the same tracing events that you profile.
You can use the Frame API to customize on a per frame basis. For instance, in a game application, surround the game loop with begin and end events to profile per frame.
With the Event API, you can create custom demarcation of events in your target application. For instance, to help optimize tasks in a game, use the Event API to track individual tasks that are required to compute a frame in a gaming application.
Learn More about Frame and Event API:
Intel® Graphics Performance Analyzers
Intel GPA includes powerful, agile tools that enable game developers to use the full performance potential of their gaming platform, including, though not limited to, Intel® Core™ processors and Intel Processor Graphics. Intel GPA tools visualize performance data from your application, enabling you to understand system-level and individual frame performance issues. These tools also let you perform what-if experiments to estimate potential performance gains from optimizations.
System Analyzer/Heads-Up Display Overlay
The Intel GPA System Analyzer is a real-time tool that displays CPU, graphics API, and GPU performance metrics. System Analyzer can help you quickly identify key performance opportunities and whether your workload is CPU or GPU bottlenecked—allowing you to focus optimization efforts on elements that have the most performance impact on your application. With the tool, you can use state override experiments to conduct a fast, high-level, iterative analysis of your game, all without changing a single line of code. System Analyzer is supported for DirectX and OpenGL applications.
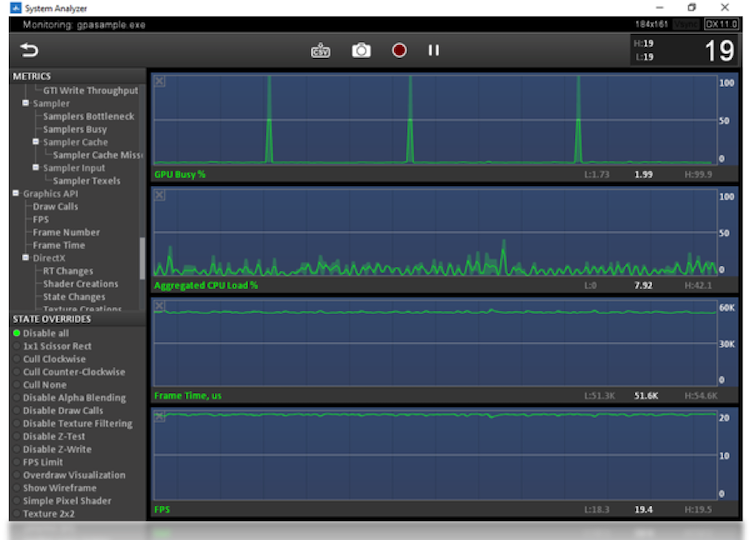
Figure 1. System Analyzer shows real-time status for graphics applications and at a system level
With System Analyzer you can:
- Display the overall system metrics, or specific metrics, for a selected application.
- Select from a range of metrics from the CPU, GPU, graphics driver, and APIs.
- Perform various what-if experiments using override modes to quickly isolate many common performance bottlenecks.
- Capture frames, traces, export metric values, and pause/continue data collection.
- Show the current, minimum, and maximum frame rate.
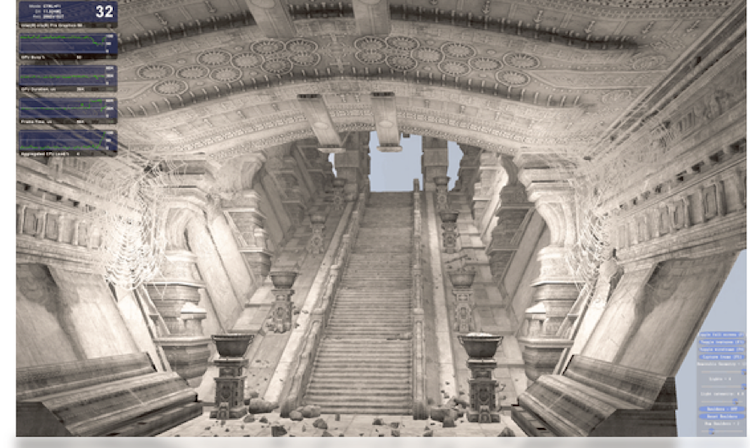
Figure 2. The head-up display overlay shows real-time metrics
For more information see the System Analyzer Getting Started Guide.
Graphics Frame Analyzer
The Intel GPA Graphics Frame Analyzer is a powerful, intuitive, single frame and multiframe (DirectX 11, DirectX 12, and Vulkan) analysis and optimization tool for major graphic API workloads. It provides deep frame performance analysis down to the draw call level, including shaders, render states, pixel history, and textures. You can conduct what-if experiments to see how changes iteratively impact performance and visuals without having to recompile your source code.
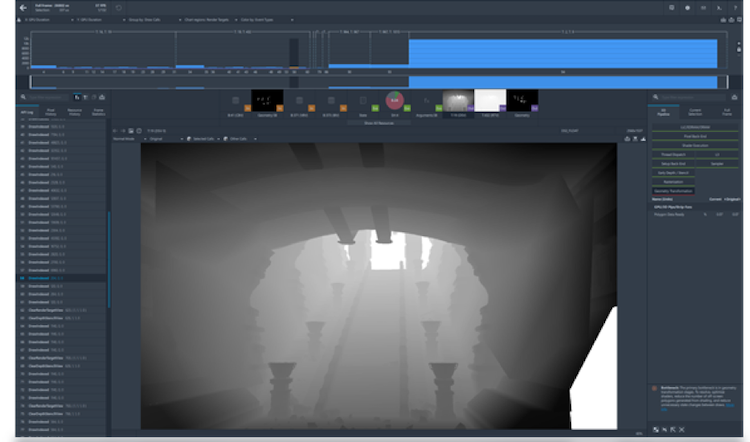
Figure 3. Intel® GPA Graphics Frame Analyzer
With Graphics Frame Analyzer you can:
- Graph draw calls with axes based on a variety of graphics metrics.
- View the history of any given pixel.
- Select regions and draw calls in a hierarchical tree.
- Implement and view the results of real-time experiments on the graphics pipeline to determine bottlenecks and isolate any unnecessary events, effects, or render passes.
- Import and modify shaders to see the visual and performance impact of a simpler or more complex shader, without modifying the game as a whole.
- Study the geometry, wireframe, and overdraw view of any frame.
- Use hardware metrics to determine bottlenecks with the GPU pipeline.
- Group and color draw calls by hardware bottlenecks using Hotspot mode.
- Automate and streamline multiple aspects of your profiling workflow using the Python* plug-in interface; explore the preloaded plug-ins or make your own.
Graphics Trace Analyzer
The Intel GPA Graphics Trace Analyzer lets you see where your application is spending time across the CPU and GPU. This helps to ensure that your software takes full advantage of the processing power available from today’s Intel® platforms.
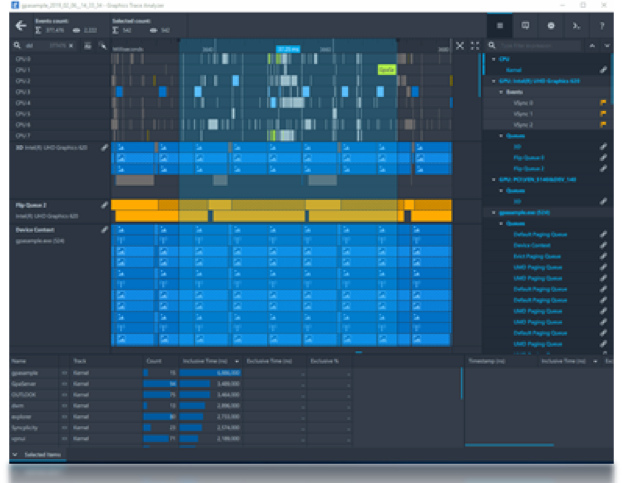
Figure 4. Intel® GPA Graphics Trace Analyzer
Graphics Trace Analyzer provides offline analysis of CPU and GPU metrics and workloads with a timeline view for analysis of tasks, threads, major graphics APIs, and GPU-accelerated media applications in context.
With Graphics Trace Analyzer, you can:
- View task data in a detailed timeline.
- Identify CPU and GPU bound processes.
- Explore queued GPU tasks.
- Explore CPU thread utilization and correlate to API use if applicable.
- Correlate CPU and GPU activity based on captured platform and hardware metric data.
- Filter and isolate the timeline to focus on a specific duration in time.
- Capture data at a system-wide level as well as on an application level.
Additional Intel® GPA Resources
For additional information and to see up-to-date details about Intel GPA, visit the product page.
Performance Recommendations for Intel® Processor Graphics Gen11
Modern graphics APIs like DirectX 12, Metal, and Vulkan give developers more control over lower level choices that were once handled in driver implementations. Although each API is different, there are general recommendations for application developers that are API independent.
Configuring Graphics Pipeline State
When configuring pipeline states, consider the following:
- When creating Pipeline State Objects (PSOs), make sure to take advantage of all the available CPU threads on the system. In previous APIs, the driver would create these threads for you, but now you must create the threads yourself.
- Compile similar PSOs on the same thread to improve deduplication done by the driver and runtime.
- Define optimized shaders for PSOs instead of using combinations of generic shaders mixed with specialized shaders.
- Avoid defining depth plus stencil format if stencil will not be used. Use depth-only formats such as D32.
Resource Binding
Modern Graphics APIs give you more control over resource binding, such as with DirectX Root Signatures and Vulkan Pipeline Layout. Using these requires particular attention to maximize performance. When designing an application strategy for resource binding, employ the following guidance:
- Minimize the number of root signature slots or descriptor sets to only what will be used by a shader.
- Try to find a balance between root signature or descriptor set reuse across shaders.
- For multiple constant buffers that do not change between draws, consider packing all constant buffer views into one descriptor table.
- For multiple Unordered Access Views (UAVs) and Shader Resource Views (SRVs) that do not span a consecutive range of registers and do not change between draws, it is best to pack them into a descriptor table.
- Minimize descriptor heap changes. Changing descriptor heaps severely stalls the graphics pipeline. Ideally, all resources will have views appropriated out of one descriptor heap.
- Avoid generic root signature definitions where unnecessary descriptors are defined and not leveraged. Instead, optimize root signature definitions to the minimal set of descriptor tables needed.
- Favor root constants over root descriptors, and favor root descriptors over descriptor tables when working with constants.
- Make use of root/push constants to enable fast access to constant buffer data (they are pre-loaded into registers).
- Root/push constants are great to use on frequently changing constant buffer data.
- Use root/push constants for cases where the constants are changing at a high frequency.
- Be sure to use hints that allow the driver to perform constant-based optimizations, such as D3D12_DESCRIPTOR_RANCE_FLAG_DATA_STATIC.
- For placed resources, initialize with a clear, copy, or discard before rendering to the resource. This helps enable proper compression by putting the placed resource into a valid state.
Render Targets and Textures
General Guidance
The following application guidelines ensure the efficient use of bandwidth with render targets:
- Use as few render targets as necessary and combine render targets when possible to make better use of lower level caches.
- Avoid defining unnecessary channels or higher precision data formats when not needed to conserve memory bandwidth and optimize cache fetches.
- Create multiple resources from the same memory object.
- Vulkan specific for optimal device access:
- Always use VK_IMAGE_LAYOUT_{}_OPTIMAL for GPU access.
- Only use VK_IMAGE_LAYOUT_GENERAL when really needed.
- Only use VK_IMAGE_CREATE_MULTIPLE_FORMAT_BIT when really needed.
UAVs and SSBOs
When dealing with resources that have both read and write access in a shader, such as UAVs and shader storage buffer objects (SSBOs), consider the following:
- These resource types may cause inefficient partial writes over the Gen11 64-byte cache lines. Avoid these partial writes to get maximum bandwidth through the cache hierarchy. This can be done by ensuring that a single thread executing a given shader on a 4x2 group of pixels writes a contiguous 64 bytes on its own for output.
- Access to read-only data is much more efficient than read/write data. Use these kinds of resources with caution and when there are no better options.
- Do not set a resource to use a UAV bind flag if the resource will never be bound as a UAV. This programming behavior may disable resource compression.
Anti-Aliasing
To get the best performance when performing multisample anti-aliasing, the following are recommended:
- Minimize the use of stencil or blend when MSAA is enabled.
- Avoid querying resource information from within a loop or branch where the result is immediately consumed or duplicated across loop iterations.
- Minimize per-sample operations. When shading per sample, maximize the number of cases where any kill pixel operation is used to get the best surface compression.
We do recommend using optimized compute shader post-processing anti-aliasing such as Conservative Morphological Anti-Aliasing 2.0.
Resource Barriers
Each resource barrier generally results in a cache flush or GPU stall operation, affecting performance. Given that, the following guidelines are recommended:
- Batch pipeline barriers and use render passes to help properly batch barriers and allow the driver to defer and hoist barriers to render pass edges.
- Avoid command buffers that include only barriers. If needed, put these barriers at the end of the command queue.
- Use implicit render pass barriers when possible.
- Limit the number of resource transitions by batching them, and avoid interleaving with dispatches/render passes.
- Generally, avoid barriers outside of render target changes and avoid states like D3D12_RESOURCE_STATE_COMMON unless necessary for presenting, context sharing, or CPU access.
- When possible, supply resources for barriers; they allow more optimal GPU cache flushing, especially for aliasing buffers.
- When possible, employ split-barriers to allow for maximum predication of synchronizing events.
- When transitioning resource states, do not over-set them when not in use; it can lead to excessive cache flushes.
Command Submissions
When working with command queues and buffers, the following are recommended:
- Batch command list submission at ExecuteCommandLists in DirectX 12 when possible, but not to the point where the GPU is starved. This ensures efficient use of the CPU and GPU.
- When filling command buffers or command queues, use multiple CPU cores when possible. This reduces single core CPU bottlenecking of your application. Using Intel® Threading Building Blocks (Intel® TBB) can help.
- The Gen11 architecture does not support simultaneous execution of 3D and compute (what DirectX calls asynchronous compute); therefore, specifying them in separate asynchronous queues will not improve performance on Gen11. When it makes sense, batch compute work together and avoid intermixing with 3D work. This optimizes work submission and reduces penalties from switching between compute work and 3D work, and vice versa.
- Use reusable command buffers with caution.
- DirectX 12 specific:
- Avoid the overuse of bundles as they may incur additional CPU and GPU overhead.
- Vulkan specific:
- Use primary command buffers where possible as these provide better performance due to internal batch buffer usage.
- For primary command buffers, use USAGE_ONE_TIME_SUBMIT_BIT.
- For primary command buffers, avoid USAGE_SIMULTANEOUS_USE_BIT.
- Minimize the use of secondary command buffers as they are less efficient than primary command buffers and not as efficient with depth clears.
Optimizing Clear, Copy, and Update Operations
For the best performance on clear, copy, and update operations, follow these guidelines:
- Use the API provided functions for clear, copy, and update operations, and refrain from implementing your own versions. Drivers have been optimized and tuned to ensure that these operations work with the best possible performance.
- Enable hardware ‘fast clear’ values as defined per API:
- In DirectX 12, clear values are defined at resource creation as an argument with ID3D12Device::CreateCommittedResource.
- For Vulkan, use VK_ATTACHMENT_LOAD_OP_CLEAR and avoid using vkCmdClearColorImage.
- For other APIs, use (0,0,0,0) or (1,1,1,1).
- Ensure horizontal alignment = 128b and vertical alignment = 64b.
- Copy depth and stencil surfaces only as needed instead of copying both unconditionally; they are stored separately on Gen11.
- Batch blit and copy operations.
Geometry Transformation
Ensure that vertex and geometry shader functions operate optimally by the following guidelines:
- Vertex fetch throughput is six attributes per clock (and max two vertices per clock). Ensure all bound attributes are used. When a draw is bottlenecked on geometry work, reducing the number of attributes per vertex can improve performance.
- Implement a level of detail system that allows flexibility in model accuracy by adjusting the number of vertices per model per level of detail.
- Analyze primitive to pixels covered ratios. When this ratio is high, the extra vertex shader threads add very little value to the final render target. Keep this ratio below 1:4.
- Implement efficient CPU occlusion culling to avoid submitting hidden geometry. This approach can save both CPU (draw submission), and GPU (render) time—we suggest using our highly optimized Masked Software Occlusion Culling for this. It can eventually be used in combination to finer grain GPU culling.
- Define input geometries as a structure of arrays for vertex buffers. Try to group position information vertex data in its own input slot to assist the tile binning engine for tile-based rendering.
- The Gen11 vertex cache does not cache instanced attributes. For instanced calls, consider loading attributes explicitly in your vertex shader.
- Optimize transformation shaders (that is, vertex to geometry shader) to output only attributes that will be used by later stages in the pipeline. For example, avoid defining unnecessary outputs from a vertex shader that will not be consumed by a pixel shader. This enables better use of bandwidth and space with the L3 cache.
- Metal 2 Specific—Tessellation factors are calculated in the compute engine, then returned to the 3D engine to get rendered. Calculate tessellation factors back to back for multiple draws to reduce the amount of context switching between 3D and compute workloads.
Tile-Based Rendering
To ensure the most efficient use of Gen11 PTBR hardware, follow these guidelines for bandwidth limited passes:
- Only use trilist or tristrip topologies.
- For DirectX 12, use ID3D12GraphicsCommandList4::EndRenderPass with D3D12_RENDER_PASS_ENDING_ACCESS_TYPE_DISCARD.
- For Vulkan, Use VkRenderPass/VkSubpass with VK_ATTACHMENT_STORE_OP_DONT_CARE.
- Avoid tessellation, geometry, and compute shaders. Passes with tessellation and geometry shaders will not benefit from PTBR hardware improvements.
- Avoid intra-render pass read after write hazards.
- Separate the attributes required to compute position into separate vertex buffers.
Shader Optimizations
General Shader Guidance
When writing shaders, look for these opportunities to optimize:
- Structure the shader to avoid unnecessary dependencies, especially high latency operations such as sampling or memory fetches.
- Avoid shader control flow based on results from sampling operations.
- Aim for uniform execution of shaders by avoiding flow control based on non-uniform variables.
- Implement early returns in shaders where the output of an algorithm can be predetermined or computed at a lower cost of the full algorithm.
- Use shader semantics to flatten, branch, loop, and unroll wisely. It is often better to explicitly specify the desired unrolling behavior, rather than let the shader compiler make those decisions.
- Branching is preferable if there are enough instruction cycles saved that outweigh the cost of branching.
-
Extended math and sampling operations have a higher weight and may be worth branching (see Figure 6 for issue rate).
Instruction Single Precision (ops/EU/clk) Theoretical Cycle Count FMAD 8 1 FMUL 8 1 FADD 8 1 MIN,MAX 8 1 CMP 8 1 INV 2 4 SQRT 2 4 RSQRT 2 4 LOG 2 4 EXP 2 4 POW 1 8 IDIV 1 – 6 1.33 – 8 TRIG 2 4 FDIV 1 8 Table 1. Gen11 EU Instruction Issue Rates
- Small branches of code may perform better when flattened.
- Unroll conservatively. In most cases, unrolling short loops helps performance; however, unrolling loops does increase the shader instruction count. Unrolling long loops with high iteration counts can impact shader residency in instruction caches, and therefore negatively impact performance.
- Avoid extra sampler operations when it is possible that the sampler operation will later be multiplied by zero. For example, when interpolating between two samples, if there is a high probability of the interpolation being zero or one, a branch can be added to speed up the common case and only perform the load only when needed.
- Avoid querying resource information at runtime; for example, High-Level Shading Language (HLSL) GetDimensions call to make decisions on control flow, or unnecessarily incorporating resource information into algorithms.
- When passing attributes to the pixel shader, mark attributes that do not change per vertex within a primitive as constant.
- For shaders where depth test is disabled, use discard (or other kill operations) where output will not contribute to the final color in the render target. Blending can be skipped where the output of the algorithm has an alpha channel value of zero, or adding inputs into shaders that are zeros that negate output.
Texture Sampling
To get the best performance out of textures and texture operations, please consider the following items:
- When sampling from a render target, avoid sampling across mip levels of the surface with instructions such as sample_l/sample_b.
- Use API defined and architecture supported compression formats (that is, BC1-BC7) on larger textures to improve memory bandwidth utilization and improve memory locality when performing sampling operations.
- Avoid dependent texture samples between sample instructions. For example, avoid making the UV coordinates of the next sample operation dependent upon the results of the previous sample operation. In this instance, the shader compiler may not be able to optimize or reorder the instructions, and it may result in a sampler bottleneck.
- Avoid redundant and duplicate sampler states within shader code, and use static/immutable samplers, if possible.
- Define appropriate resource types for sampling operation and filtering mode. Do not use volumetric surface as a 2D array.
- When fetching from an array surface, ensure that the index is uniform across all single instruction, multiple data (SIMD) lanes.
- Avoid defining constant data in textures that could be procedurally computed in the shader, such as gradients.
- Avoid anisotropic filtering on sRGB textures.
- Sample_d provides gradient per pixels and throughput drops to one-fourth. Prefer sample_l unless anisotropic filtering is required.
- When using VRS, anisotropic filtering may not be needed, as pixels in that draw will be coarser. Non-anisotropic filtering improves sampler throughput.
Constants
When defining shader constants, the following guidelines can help to achieve better performance:
- Structure constant buffers to improve cache locality so that memory accesses all occur on the same cache line to improve memory performance.
- Favor constant access that uses direct access since the offset is known at compile time, rather than indirect access, in which the offset has to be computed at runtime. This benefits high latency operations like flow control and sampling.
- Group the more frequently used constants for better cache utilization and move them to the beginning of the buffer.
- Organize constants by frequency of update and only upload when the values change.
- When loading data from buffers or structured buffers, organize the data access such that all or the majority of the cache line is used. For example, if a structured buffer has ten attributes and only one of those attributes is used for reading and/or writing, it would be better to split that one attribute into its own structured buffer.
- Consider using ByteAddressBuffers when performing consecutive data loads instead of loading data from a Typed Buffer. Those can be optimized by our shader compiler.
Temporary Register Variable Usage
Each thread on an execution unit has its own set of registers to store values. The more work that can be done using register to register operations can help reduce memory penalties. However, if there are more temporary variables than registers, some of those variables will have to be stored in memory, where reading and writing have a latency cost. Avoiding this spillover can help to improve performance.
When writing shaders, the following guidelines should be considered to help reduce spillover and improve performance:
- Try to optimize the number of temporaries to 16 or fewer per shader. This limits the number of register transfers to and from main memory, which has higher latency costs. Check the instruction set assembly code output and look for spill count. Spills are a good opportunity for optimization as they reduce the number of operations that depend on high latency memory operations. This can be done in Intel GPA by selecting a shader and choosing to look at the machine code generated by the compiler.
- If possible, move the declaration and assignment of a variable closer to where it will be referenced.
- Weigh the options between full and partial precision on variables as this can store more values in the same space. Use caution when mixing partial precision with full precision in the same instruction as it may cause redundant type conversions.
- Move redundant code that is common between branches out of the branch. This can reduce redundant variable duplication.
- Avoid non-uniform access to constant buffer/buffer data. Non-uniform access requires more temporary registers to store data per SIMD lane.
- Avoid control flow decision based on constant buffer data, as this forces the compiler to generate sub-optimal machine code. Instead, use specialization constants, or generate multiple specialized shader permutations.
Compute Shader Considerations
When developing compute shaders, the following guidelines can help to achieve optimal performance when selecting thread group sizes:
- Pick thread group sizes and dimensions that fit the nature of your workload’s memory access patterns. For instance, if your application accesses memory in a linear fashion, specify a linear dimension thread group size, such as 64 x 1 x 1.
- For two-dimensional thread groups, smaller thread group sizes typically lead to better performance and achieve better execution unit thread occupancy.
- Generally, a thread group size of 8 x 8 performs well on Gen11. In some cases, this may not be optimal due to memory access patterns and/or cache locality. In this case, 16 x 16 or higher dimensions should be experimented with and chosen based on their performance in testing.
- Thread group size higher or equal to 256 threads can cause thread occupancy issues.
When developing compute shaders that use SLM, consider the following:
- Minimize the number of reads and writes. For instance, an array of float4 data should be loaded and stored in one bank of float4 types, rather than four banks of float arrays.
- Try to keep variables in registers rather than SLM to save on memory access penalties.
- Load and store data in a manner such that data elements that are consecutively accessed are located back to back. This allows read and write access to be coalesced and to use memory bandwidth efficiently.
- Use HLSL interlocked functions to perform min, max, or, and other reductions, instead of moving data to and from SLM to perform the same operation with a user-defined operation. The compiler can map HLSL functions to a hardware-implemented version.
Wave Intrinsics
Gen11 supports the use of wave intrinsics for both 3D and compute workloads. These can be used to write more efficient reductions and influence registers to reduce reliance on global or local memory for communication across lanes. This allows threads within the thread group to share information without the use of barriers and to enable other cross lane operations for threads in the same wave. While working with wave intrinsics on Gen11, consider the following:
- On Gen architecture, wave width can vary across shaders from SIMD8, SIMD16, and SIMD32, and is chosen by the shader compiler. Because of this, use instructions such as WaveGetLaneCount() in algorithms that depend on wave size.
- Wave operations can be used to reduce memory bandwidth by enabling access to data already stored in registers by other threads, instead of storing and re-loading results from memory. It is a great fit for optimizing operations such as texture mipmap generation.
Frame Presentation
When presenting frames, it is best to use full-screen presentation modes, when possible. Windowed and other modes require an extra context switch.
Design for Low Power
Mobile and ultra-mobile computing are ubiquitous. On these platforms, power is shared between CPU and GPU, so optimizing for CPU can frequently result in GPU performance gains. As a result, battery life, device temperature, and power-limited performance have become significant issues. As manufacturing processes continue to shrink and improve, we see improved performance per-watt characteristics of CPUs and processor graphics. However, there are many ways that software can reduce power use on mobile devices, as well as improve power efficiency. In the following sections, you will find insights and recommendations illustrating how to best recognize these performance gains.
Idle and Active Power
Processors execute in different power states, known as P-states and C-states. C-states are essentially idle states that minimize power draw by progressively shutting down more and more of the processor. P-states are performance states where the processor consumes progressively more power and runs faster at a higher frequency.
These power states define how much time the processor is sleeping and how it distributes available power when active. Power states can change very quickly, so sleep states are relevant to most applications that do not consume all the power available, including real-time applications.
When you optimize applications, try to save power in two different ways:
- Increase the amount of idle time your application uses where it makes sense.
- Improve overall power usage and balance under active use.
You can determine the power state behavior of your application by measuring how much time it spends in each state. Since each state consumes a different amount of power, you will get a picture over time of your app’s overall power use.
Analysis Tips
To start, begin by measuring your app’s baseline power usage in multiple cases and at different loads:
- At near idle, as in the user interface (UI) during videos
- Under an average load during a typical scene with average effects
The worst-case load may not occur where you expect it to. We have seen very high frame rates (1000 frames per second (fps)) during cut-scene video playback in certain apps, a situation that can cause the GPU and CPU to use unnecessary power. As you study your application, try a few of these tips:
- Measure how long (on average) your application can run on battery power, and compare its performance with other, similar apps. Measuring power consumption regularly informs you if any recent changes caused your app to use more power.
- The Battery Life Analyzer (BLA) is a good (Windows-only) tool for this work. For more information, see this article showcasing BLA, and how it can collect high-level data and analyze an app's power use. If the data BLA provides shows that you have issues residing in the wrong C-states for too long, it is time to look deeper.
- If your app is reported as deficient or there are unexpected wakeups, start optimizing for power. To do so, you will want to look at the Windows Performance Analyzer (WPA) tool, which showcases workflow using WPA for CPU analysis.
- VTune™ Amplifier XE is also useful to get power call stacks, since it can identify the cause of the wakeup.
Use the data gained through these methods to reduce or consolidate wakeups, thus remaining in a lower power state longer.
Investigating Idle Power
As you study power at near idle, watch for very high frame rates.
If your app has high frame rates at near idle power (during cut scenes, menus, or other low-GPU intensive parts), remember that these parts of your app will look fine if you lock the present interval to a 60 Hz display refresh rate (or clamp your frame rate lower, to 30 fps).
Watch for these behaviors in menus, loading screens, and other low-GPU intensive parts of games, and scale accordingly to minimize power consumption. This can also improve CPU intensive loading times, by allowing turbo boost to kick in, when necessary.
Active Power and Speed Shift
While in active states, the processor and the operating system jointly decide frequencies for various parts of the system (CPUs, GPU, and memory ring, in particular). The current generation of Intel Core processors add more interaction between the operating system and the processor(s) to respond more efficiently and quickly to changes in power demand—a process referred to as Intel® Speed Shift Technology.
The system balances the frequencies based on activity and increases frequency (and thus consumed power) where it is needed most. As a result, a mostly active workload may have its GPU and CPU balance frequencies based on power consumption.
Reducing the amount of work done on the CPU can free up power for the GPU and vice versa. This can result in better overall performance, even when the other side was the primary performance bottleneck.
Tools such as Intel® Power Gadget can also help you see the frequencies of each clock domain in real time. You can monitor the frequencies of different subsystems on target devices by running this tool.
You can tell that your app’s power distribution is getting balanced when the primary performance bottleneck is not running at full frequency but power consumption is reaching the maximum limits available.
When and How to Reduce Activity
There are times when the user explicitly requests trading performance for battery life, and there are things you can do to more effectively meet these demands. There are also patterns in application usage that always consume extra power for little return, patterns that you can more effectively address to handle overall power usage. In the next sections you will see some issues to watch for when trying to reduce overall power consumption.
Scale Settings to Match System Power Settings and Power Profile
It was once necessary to poll for power settings and profile (for example, GetSystemPowerStatus()), but since the launch of Windows Vista, Windows supports asynchronous power notification APIs.
- Use RegisterPowerSettingNotification() with the appropriate globally unique identifier (GUID) to track changes.
- Scale your app's settings and behavior based on the power profile and whether your device is plugged in to power. Scale the resolution, reduce the max frame rate to a cap, and/or reduce quality settings.
- If you cap the frame rate, you can use V-Sync. You can also manage the frame rate and resolution yourself as well. The dynamic resolution rendering (DRR) sample shows how to adjust frame resolution to maintain a frame rate.
Run as Slow as You Can While Remaining Responsive
If you run as slow as you can (but still remain responsive) then you can save power and extend battery life.
- Detect when you are in a power-managed mode and limit frame rate. This prolongs battery life and also allows your system to run cooler. Running at 30 Hz instead of 60 Hz can save significant power.
- Provide a way to disable the frame rate limit, for benchmarking. Warn players that they will use their battery quickly. You should also want to let the player control the frame rate cap.
- Use off-screen buffers and do smart compositing for in-game user interfaces (which are often limited to small panels for displays like health, power-ups, and so on). Since user interfaces usually change much more slowly than in-game scenes, there is no need to change them at the same rate as the game frame. Here again, DRR may be useful in helping you decouple UI rendering from main scene rendering.
Manage Timers and Respect System Idle, Avoid Tight Polling Loops
There are several other related points to watch:
- Reduce your app's reliance on high-resolution periodic timers.
- Avoid Sleep() calls in tight loops. Use Wait*() APIs instead. Sleep() or any other busy-wait API can cause the operating system to keep the machine from being in the Idle state. Intel's Mobile Platform Idle Optimization presentation offers an extensive rundown of which APIs to use and to avoid.
- Avoid tight polling loops. If you have a polling architecture that uses a tight loop, convert it to an event-driven architecture. If you must poll, use the largest polling interval possible.
- Avoid busy-wait calls. This can cause unnecessary power use. There is no way for the operating system or the power management hardware to detect that the code does nothing useful.
Multithread Sensibility
Balanced threading offers performance benefits, but you need to consider how it operates alongside the GPU, as imbalanced threading can also result in lower performance and reduced power efficiency. Avoid affinitizing threads so that the operating system can schedule threads directly. If you must, provide hints using SetIdealProcessor().
Use of SIMD
Using SIMD instructions, either through the Intel® SPMD Program Compiler (Intel® ISPC) or intrinsics, can provide a significant power and performance boost. These improvements can be even bigger by using the latest instruction set.
However, on Intel Core processors, using SIMD instruction requires a voltage increase in order to power the SIMD architecture block. In order to avoid power increase, Intel Core processors will run at a lower frequency, which can decrease performance for a mostly scalar workload with a few SIMD instructions. For this reason, sporadic SIMD usage should be avoided.
Power Versus Frame Rate
The latest graphics APIs (DirectX 12, Vulkan, and Metal 2) can dramatically reduce CPU overhead, resulting in lower CPU power consumption given a fixed frame rate (33 fps), as shown on the left side in Figure 7. When unconstrained by frame rate the total power consumption is unchanged, but there is a significant performance boost due to increased GPU utilization. See the Asteroids* and DirectX* 12 white paper for full details.
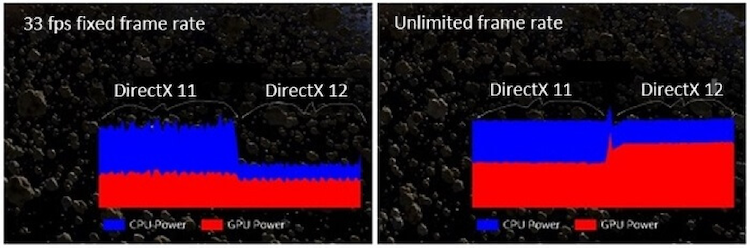
Figure 5. Asteroids* demo—power versus frame rate
Additional Resources on Intel® Developer Zone and Game Dev Websites
Intel® Software Developer Zone and Game Dev Websites
Intel regularly releases code samples covering a variety of topics to the developer community. For the most up-to-date samples and links, see the following resources:
Following are descriptions and links to samples that may also be of interest to developers targeting current Intel® systems.
Dynamic Resolution Rendering
DRR is an algorithm that aims to increase and smoothen game performance by trying to keep a fixed displayed render target resolution, but dynamically varies the resolution that is driving the engine shading.
One of the primary issues inhibiting adoption of DRR is the modification to post-processing pipelines that it requires. With the introduction of DirectX 12 and placed resources we are introducing an updated algorithm implementation that removes the need for most, if not all, post-processing pipeline modifications at the cost of increasing your memory requirements with an additional dynamic resolution render target buffer.
Checkerboard Rendering
While some graphics optimizations focus on reducing geometric level of detail, checkerboard rendering (CBR) reduces the amount of shading done that is imperceptible. The technique produces full resolution pixels that are compatible with modern post processing techniques, and can be implemented for both forward and deferred rendering. More information, implementation details, and sample code can be found in the white paper Checkerboard Rendering for Real-Time Upscaling on Intel Integrated Graphics.
Conservative Morphological Anti-Aliasing 2.0
Conservative Morphological Anti-Aliasing 2.0 (CMAA-2) is an update to the image-based conservative morphological anti-aliasing algorithm. This implementation provides improvements to the anti-aliasing quality and performance of previous implementations. For more information, refer to the Conservative Morphological Anti-Aliasing 2.0 white paper.
Adaptive Screen Space Ambient Occlusion
Screen space ambient occlusion (SSAO) is a popular effect used in real-time rendering to produce small-scale ambient effects and contact shadow effects. It is used by many modern game engines, typically using 5 to 10 percent of the frame GPU time. Although a number of public implementations already exist, not all are open source or freely available, or provide the level of performance scaling required for both low-power mobile and desktop devices. This is where Adaptive Screen Space Ambient Occlusion (ASSAO) fills needed gaps. ASSAO is specially designed to scale from low-power devices and scenarios up to high-end desktops at high resolutions, all under one implementation with a uniform look, settings, and quality that is equal to the industry standard. For more information, refer to the white paper Adaptive Screen Space Ambient Occlusion.
GPU Detect
The GPU Detect sample demonstrates how to get the vendor and ID from the GPU. For Intel Processor Graphics, the sample also demonstrates a default graphics quality preset (low, medium, or high), support for DirectX 9 and DirectX 11 extensions, and the recommended method for querying the amount of video memory. If supported by the hardware and driver, it also shows the recommended method for querying the minimum and maximum frequencies.
The sample uses a configuration file that lists many of the Intel Processor Graphics by vendor ID and device ID, along with a suggested graphics quality level for each device. To maximize performance, you should test some representative devices with your application and decide which quality level is right for each. Be careful with relying only on device ID, as a platform’s performance also depends heavily on the available power, which can be set by the device manufacturer to something lower than the optimal thermal design point.
Fast ISPC Texture Compression
The Fast ISPC Texture Compressor sample performs high-quality BC7, BC6H, ETC1, and ASTC compression on the CPU using the Intel ISPC to exploit SIMD instruction sets.
Additional Resources
Direct3D* Website – DirectX 12 and other DirectX resources
Vulkan – Khronos site with additional resources
Metal 2 – Apple’s developer site for Metal 2
Notices
Twitter: Optimization methods for Intel® Processor Graphics Gen11 for developers to harness the architecture’s capabilities and provide API guidance for the latest graphics APIs.
Summary: Optimization methods for Intel® Processor Graphics Gen11 for developers to harness the architecture’s capabilities and provide API guidance for the latest graphics APIs.