Intel® System Debugger (ISD)
Intel® System Debugger (ISD) is a debugging tool set which is part of Intel ® System Studio (ISS). ISD is composed by 3 debugging tools for Windows* and 2 debugging tools for Linux* respectively. They are System Debug, System Trace, and WinDbg* extension (Windows* only). System Debug is a BIOS source level debugging tool. Users can set breakpoints at any target line or have step-by-step line-by-line debugging. System Trace is for capturing ME/BIOS and some power management messages. The traditional and popular measure to get BIOS logs is to wire out a serial port and get logs from COM port. But it’s only for BIOS messages. System Trace collects CSME and BIOS messages with time-stamps and put them together in sequence. It’s much easier for users to understand that the issue they have is caused by ME or BIOS. WinDbg* extension is an extension for the traditional Microsoft* WinDbg*. The traditional WinDbg* has to work with functional Windows* debug drivers. But in some system hang cases, the debug driver is also dead. The normal WinDbg* cannot output anything. WinDbg* extension changes the debugging route to Intel® Direct Connect Interface (DCI). So, when the OS is malfunction, we can expect WinDbg* still can send out some information as clues.
p.s. Crashlog will join ISD as a new debugging tool in 2018.
TCA (Target Connection Agent)
Target Connection Agent (TCA) is an Eclipse plug-in app to help users to easily configure connection settings in Intel® System Debugger (ISD) 2018. It has a friendly dialog and shows pictures of what type of connection method that users should choose for debugging their platforms. Once the connection is established, users can start using ISD tools to debug BIOS or Windows and collect trace logs for issue analysis.
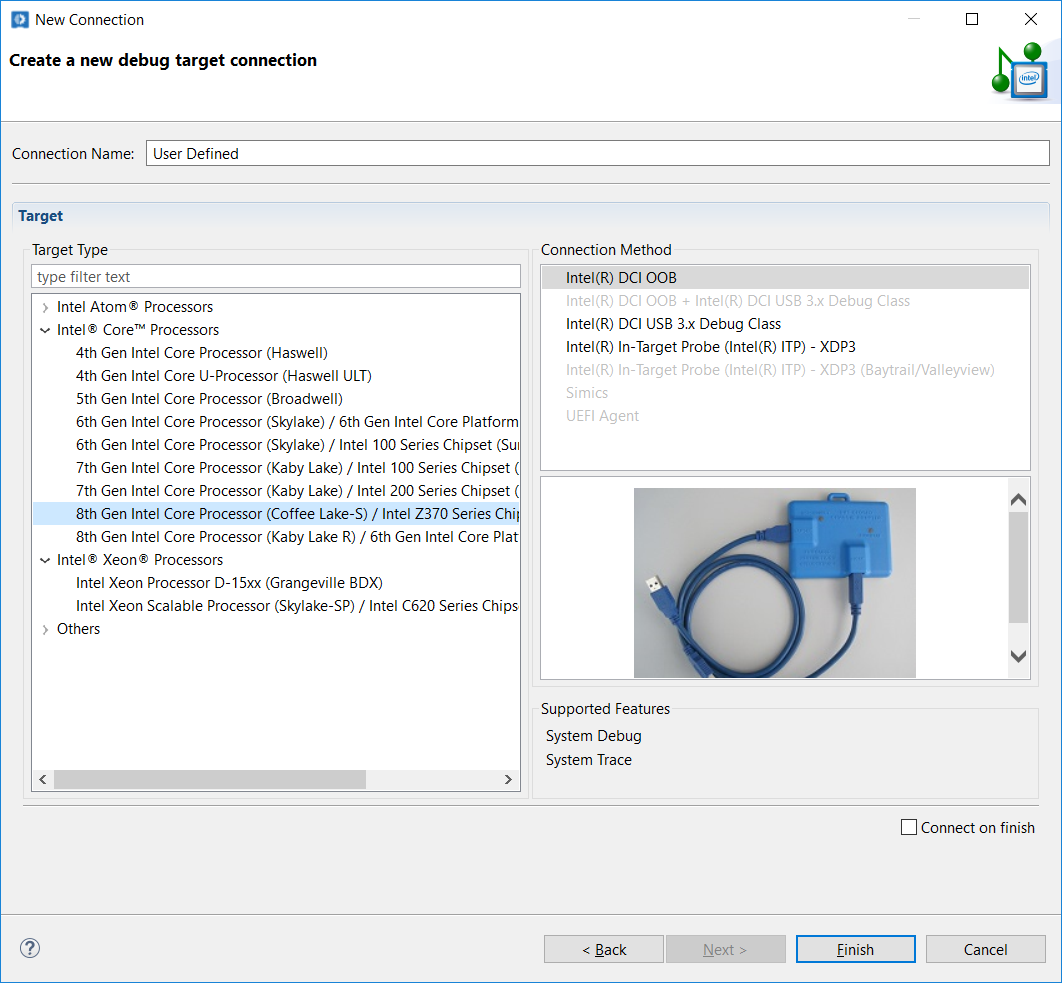
Friendly Target Connection Agent (TCA) dialog
How to Make a Connection to a Target Platform
The following paragraph shows how to use Target Connection Agent (TCA) to setup a connection to a target platform.
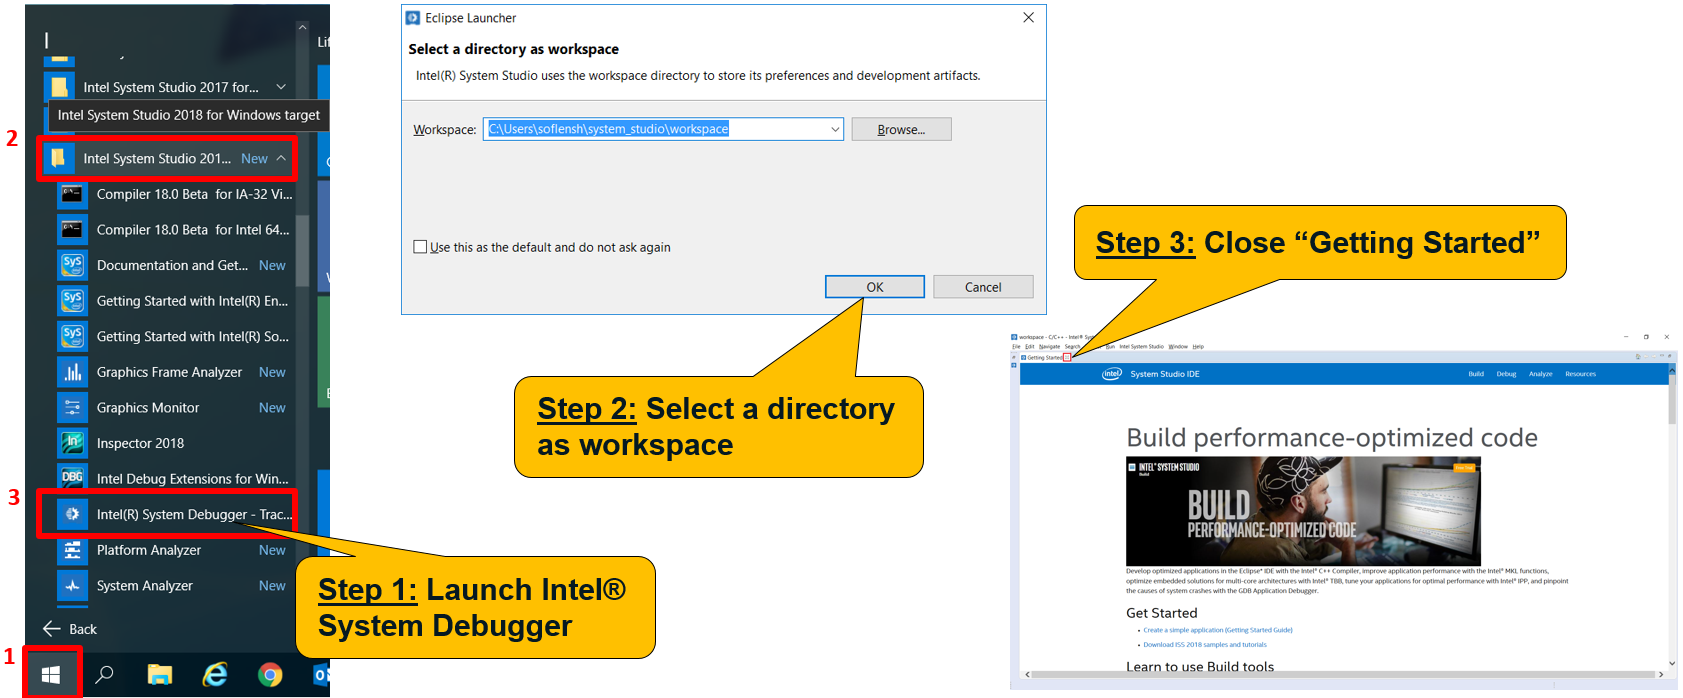
Step 1. Launch Intel® System Debugger (ISD) - Trace and Debug
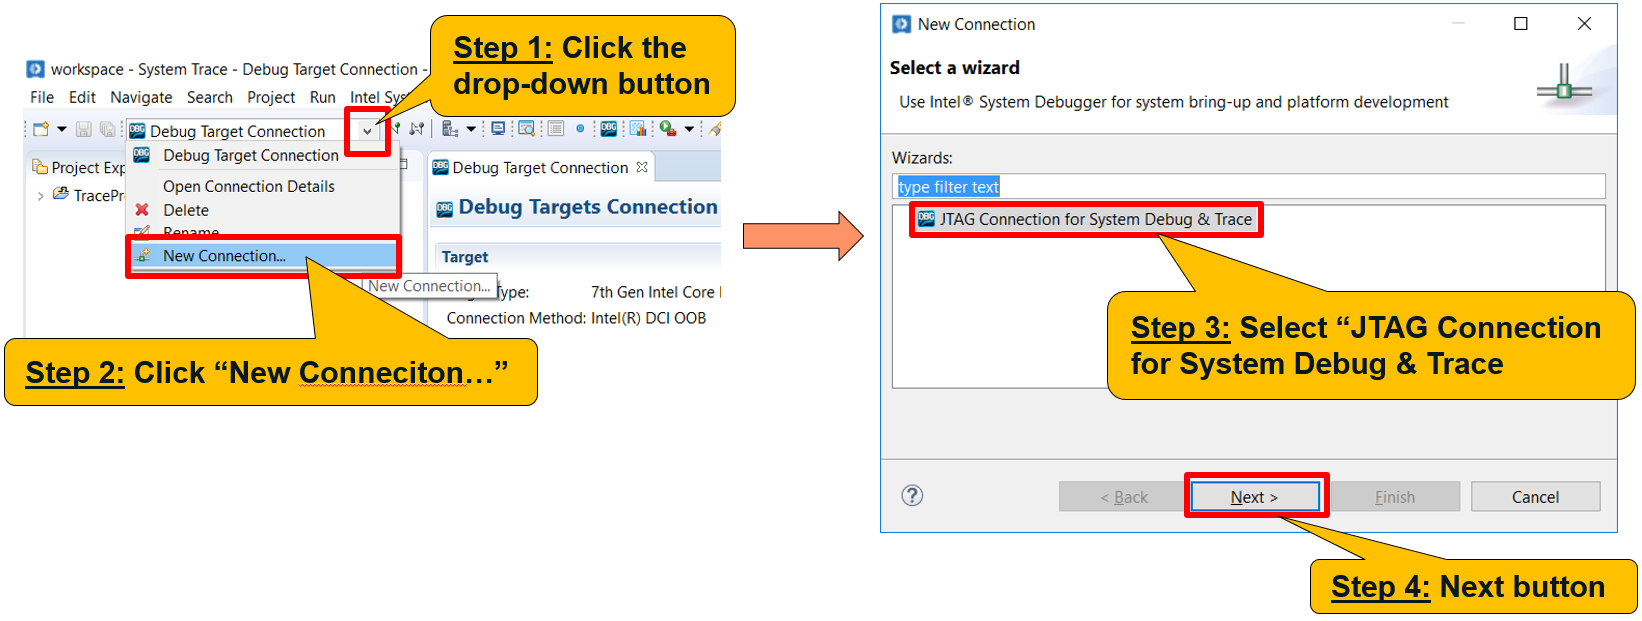
Step 2. Click New Connection... to open TCA dialog
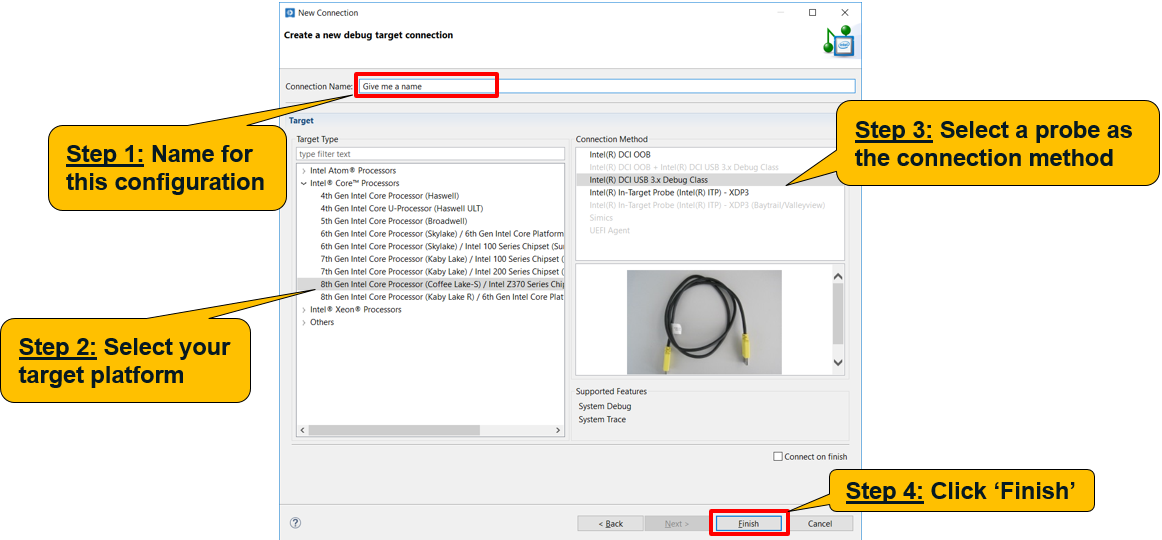
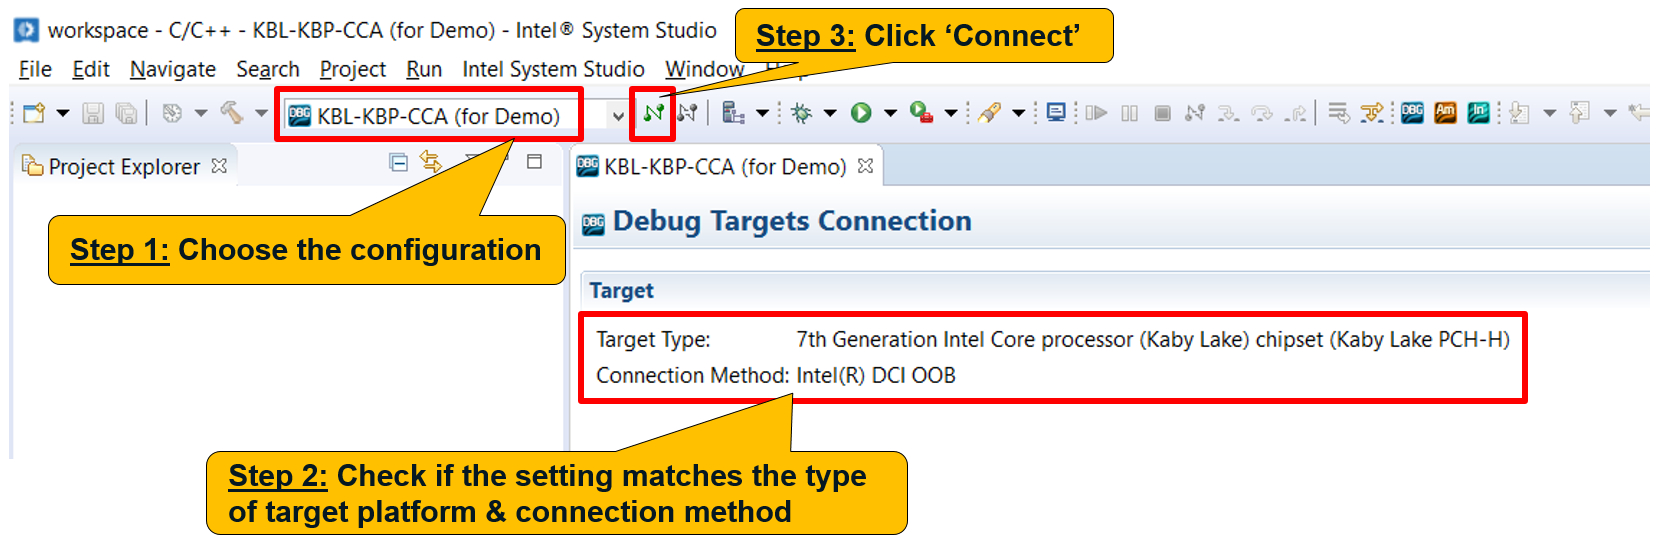
Step 3. Name the configuration, select target platform, and choose a connection method
Step 4. Select the configuration name you set and press the green Connect button (![]() )
)
Step 5. Now you can launch System Debug, System Trace, or WinDbg* extension
Available Platforms and Connection methods
Intel Atom® Processors
| Type of Target Platform | Intel® DCI OOB | Intel® DCI USB 3.x Debug Class | Intel® In-Target Probe (ITP) - XDP3 |
|---|---|---|---|
| Z36xx, Z37xx - 2 Cores (Baytrail / MinnowBoard MAX) | ● | ||
| C2xxx (Avoton) | ● | ||
| C3xxx (Denverton) | ● | ||
| E6xx (Tunnel Creek) | ● | ||
| N3xxx, J3xxx (Braswell) | ● | ||
| Z35xx (Anniedale / Moorefield) | ● | ||
| x5-Z8xxx, x7-Z8700 (Cherry Trail) | ● | ||
| N4200, N3350, x7-E3950, x5-39xx (Apollo Lake) | ● |
Intel® CoreTM Processors
| Type of Target Platform | Intel® DCI OOB | Intel® DCI USB 3.x Debug Class | Intel® In-Target Probe (ITP) - XDP3 |
|---|---|---|---|
| 4th Gen Processor (Haswell) | ● | ||
| 4th Gen U-Processor (Haswell ULT) | ● | ||
| 5th Gen Processor (Broadwell) | ● | ||
| 6th Gen Processor (Skylake) / 6th Gen Platform I/O (SunrisePoint PCH-LP) | ● | ● | |
| 6th Gen Processor (Skylake) / Intel 100 Series Chipset (SunrisePoint PCH-H) | ● | ● | |
| 7th Gen Processor (Kaby Lake) / Intel 100 Series Chipset (SunrisePoint PCH-H) | ● | ● | ● |
| 7th Gen Processor (Kaby Lake) / Intel 200 Series Chipset (Kaby Lake PCH-H) | ● | ● | ● |
| 8th Gen Processor (Coffee Lake-S) / Intel Z370 Series Chipset (Kaby Lake PCH-H) | ● | ● | ● |
| 8th Gen Processor (Kaby Lake R) / 6th Gen Core Platform I/O (SunrisePoint PCH-LP) | ● | ● |
Intel® Xeon® Processors
| Type of Target Platform | Intel® DCI OOB | Intel® DCI USB 3.x Debug Class | Intel® In-Target Probe (ITP) - XDP3 |
|---|---|---|---|
| Intel Xeon Processor D-15xx (Grangeville BDX) | ● | ||
| Intel Xeon Scalable Processor (Skylake-SP) / Intel C620 Series Chipset (Lewisburg) | ● | ● | ● |